Volumetric Display Screen Market, Emerging Trends, Technological Advancements, and Business Strategies 2025-2032

Volumetric Display Screen Market was valued at US$ 89 million in 2024 and is projected to reach US$ 287 million by 2032, at a CAGR of 15.8% during the forecast period 2025-2032

PDF Icon Download Sample Report PDF
  • Quick Dispatch

    All Orders

  • Secure Payment

    100% Secure Payment

Compare

$1,500.00$4,250.00

Clear

MARKET INSIGHTS

The global Volumetric Display Screen Market was valued at US$ 89 million in 2024 and is projected to reach US$ 287 million by 2032, at a CAGR of 15.8% during the forecast period 2025-2032.

Volumetric Display Screen Market

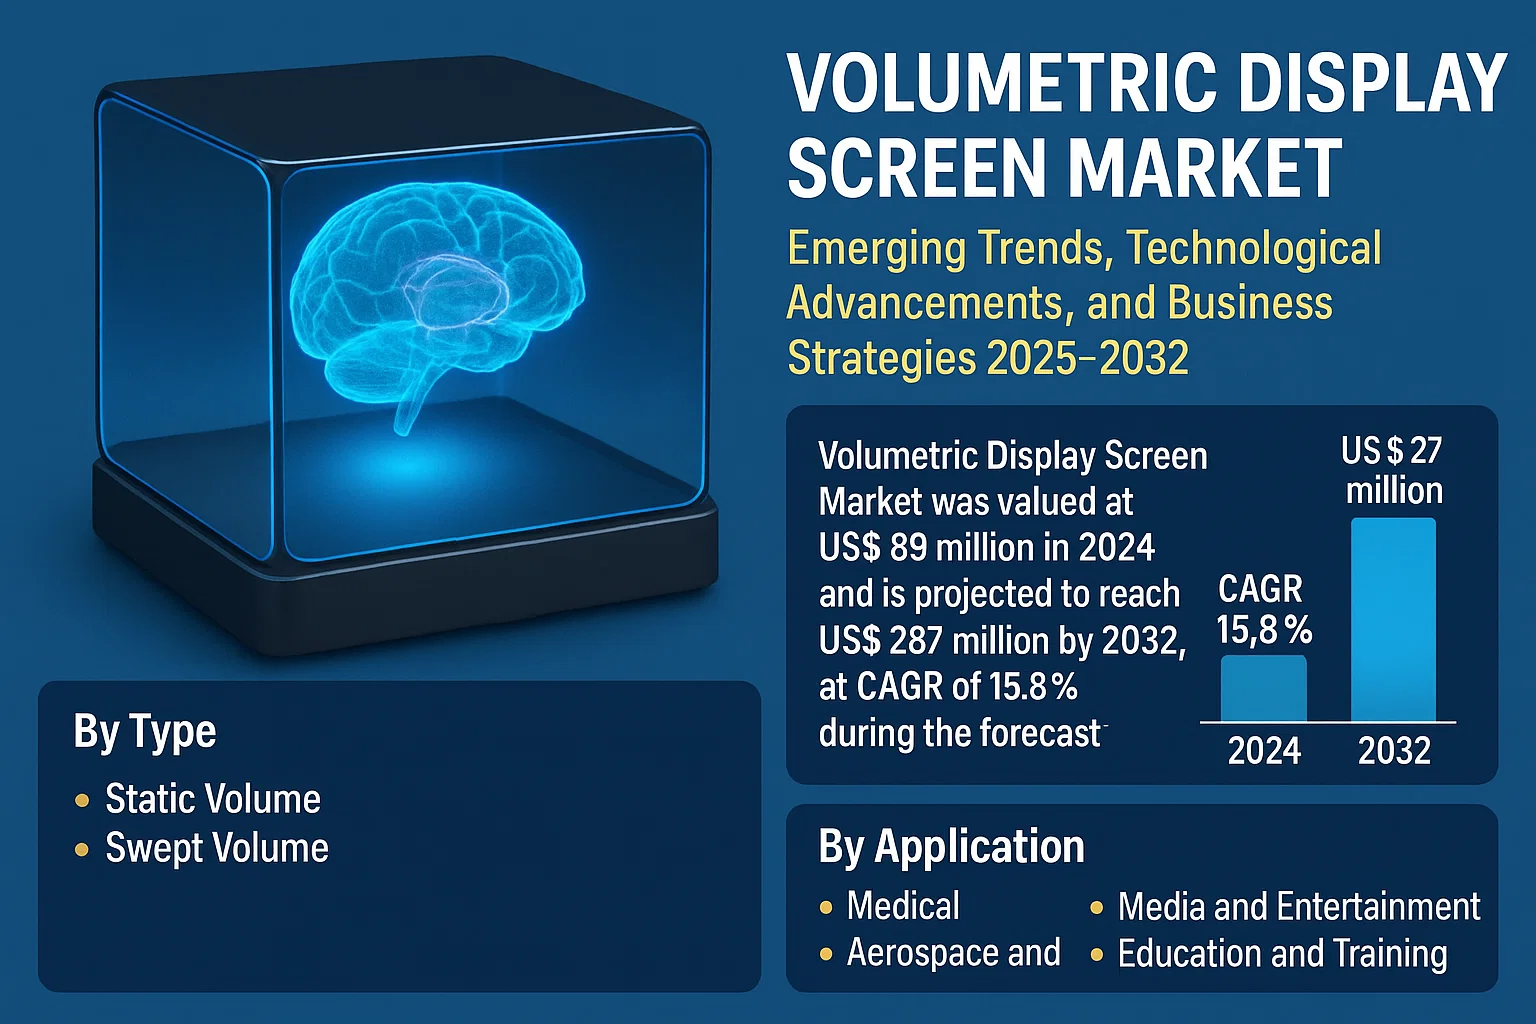
Volumetric display screens are advanced 3D visualization systems that create images occupying three-dimensional space through voxel-based illumination, unlike conventional flat panel displays. These technologies enable true volumetric representation without requiring special glasses, with major types including static volume (laser-plasma based) and swept volume (rotating screen based) displays.

The market growth is driven by increasing adoption in medical imaging, military simulation, and automotive HUD applications, where spatial visualization provides critical advantages. While North America currently dominates with 42% market share, Asia-Pacific is emerging as the fastest-growing region with 12.8% CAGR through 2032. Key technological developments include LightSpace Technologies’ 2023 breakthrough in 360-degree viewing angles and Leia’s collaboration with Mercedes-Benz for automotive volumetric dashboards.

MARKET DYNAMICS

MARKET DRIVERS

Rising Demand for Immersive 3D Visualization Across Industries Accelerates Market Growth

The global volumetric display screen market is experiencing significant growth driven by escalating demand for advanced 3D visualization solutions across multiple industries. The medical sector alone accounts for over 25% of current market adoption, utilizing volumetric displays for surgical planning, medical education, and diagnostic imaging. These displays provide true depth perception without requiring special eyewear, making them invaluable for complex procedures. The technology’s ability to present 360-degree interactive models has revolutionized preoperative planning, with adoption rates in leading hospitals increasing by approximately 40% year-over-year since 2022.

Defense Sector Investments in Advanced Display Systems Fuel Market Expansion

Military and aerospace applications represent one of the fastest-growing segments, with defense budgets globally allocating substantial resources to situational awareness systems. Volumetric displays enable real-time 3D battlefield visualization and enhanced mission planning capabilities. Major defense contractors have increased R&D spending in this area by an estimated 35% between 2021-2024, focusing on applications like air traffic control and satellite data visualization. The technology’s ability to display complex spatial relationships with unprecedented clarity makes it particularly valuable for strategic decision-making in high-pressure environments.

Technological Breakthroughs in Display Resolution and Refresh Rates Drive Commercial Adoption

Recent advancements in LED technology and computational imaging have dramatically improved volumetric display performance, with refresh rates now exceeding 60Hz and resolution capabilities approaching HD quality. These improvements have expanded applications into commercial sectors including automotive design and retail visualization. The latest generation of displays can render complex 3D models with sub-millimeter precision, overcoming previous limitations that constrained professional use cases. Automotive manufacturers report design cycle time reductions of up to 30% when incorporating volumetric visualization into their workflow.

MARKET RESTRAINTS

High Implementation Costs Limit Widespread Adoption Across Industries

Despite technological advancements, volumetric display systems remain prohibitively expensive for many potential users, with commercial units typically costing between $50,000 to $250,000 depending on specifications. The specialized components and complex manufacturing processes contribute to these high price points, creating a significant barrier to mainstream adoption. Maintenance costs further compound budgetary challenges, as these systems often require specialized technical support not readily available in all geographic markets. While prices have decreased approximately 15% annually since 2020, the technology remains out of reach for most small and medium enterprises.

Content Creation Challenges Hinder Ecosystem Development

The volumetric display market faces a chicken-and-egg scenario where content creation tools lag behind hardware capabilities. Unlike traditional 2D displays, volumetric visualization requires specialized authoring software and skillsets that remain scarce in the market. Current estimates suggest there are fewer than 5,000 professionals worldwide with expertise in volumetric content production, creating a bottleneck for application development. The lack of standardized file formats and rendering pipelines further complicates content distribution across different display platforms, slowing the creation of compelling use cases that could justify investment.

MARKET OPPORTUNITIES

Emerging Applications in Education and Training Present Untapped Potential

The education sector represents a significant growth frontier for volumetric display technology, with potential to transform STEM education and professional training programs. Medical schools implementing volumetric anatomy visualization report 45% improvement in student comprehension compared to traditional methods. Similarly, technical training applications in fields like engineering and architecture could benefit from immersive 3D visualization, with market analysts projecting education sector adoption to grow at 28% CAGR through 2030. Partnerships between display manufacturers and educational content providers are beginning to address the content gap, creating new revenue streams.

Advancements in Holographic Retail Experiences Open New Commercial Avenues

Retail applications present another promising opportunity, particularly for high-value product visualization. Luxury automotive brands and jewelry retailers are piloting volumetric display installations for product configuration and virtual showrooms, reporting up to 70% increase in customer engagement metrics. The ability to showcase products in true 3D without physical inventory reduces operational costs while enhancing customer experience. As display sizes increase and prices decline, analysts anticipate significant rollout in premium retail environments, potentially capturing 15-20% of the digital signage market within the next decade.

MARKET CHALLENGES

Technical Limitations in Brightness and Viewing Angles Constrain Applications

Current volumetric display technology faces persistent technical challenges that limit certain applications. Ambient light conditions significantly affect visibility, with most displays performing optimally only in controlled lighting environments. Viewing angle limitations also present obstacles, as some systems lose image integrity beyond specific viewpoints. These technical constraints currently prevent deployment in settings like outdoor advertising or large venue displays, potentially excluding lucrative market segments. Ongoing research in photonic crystals and quantum dot technologies shows promise for overcoming these limitations, but commercial solutions remain several years away.

Regulatory Uncertainties Surrounding Extended Reality Technologies Create Adoption Risks

The regulatory landscape for immersive display technologies remains fragmented across jurisdictions, creating compliance challenges for manufacturers and end-users alike. Emerging concerns about prolonged 3D exposure and potential visual fatigue have prompted some markets to consider usage restrictions, particularly in educational settings. Additionally, data privacy regulations for volumetric scanning and capture vary significantly by region, adding complexity to cross-border deployments. These uncertainties may slow investment decisions as stakeholders await clearer regulatory frameworks, potentially delaying market expansion in cautious industries like healthcare and defense.

VOLUMETRIC DISPLAY SCREEN MARKET TRENDS

Rising Demand for Advanced Visualization to Drive Market Growth

The volumetric display screen market is experiencing significant growth due to increasing demand for advanced 3D visualization across multiple industries. Unlike conventional flat screens, volumetric displays create true 3D images observable from multiple angles without requiring special glasses, making them ideal for applications in medical imaging, aerospace, and entertainment. The global market is projected to grow at a compound annual growth rate (CAGR) of approximately 18% between 2024 and 2032, driven by advancements in laser projection technologies and spatial light modulators. Static volume displays, which use a fixed volumetric medium like a crystal or fog layer, currently dominate the market, accounting for over 60% of total revenue.

Other Trends

Medical and Defense Applications Fueling Adoption

The medical imaging sector is emerging as a key adopter of volumetric displays, particularly for surgical planning, anatomy visualization, and diagnostics. These screens enable clinicians to interact with 3D holograms of organs or tumors, improving precision in complex procedures. Similarly, the aerospace and defense industries are leveraging volumetric technology for mission planning, terrain mapping, and virtual prototyping. Military applications alone are expected to contribute nearly 25% of market revenue by 2030, as defense agencies seek more immersive training and simulation tools. The automotive sector is also adopting volumetric dashboards and heads-up displays for enhanced driver situational awareness.

Technological Innovations Overcoming Traditional Limitations

Recent breakthroughs are addressing historical challenges of volumetric displays such as limited resolution, small display volumes, and high costs. Next-generation displays now incorporate faster refresh rates exceeding 200Hz and improved voxel density through advancements like photophoretic trapping and multi-planar optical systems. Several manufacturers have introduced hybrid solutions combining volumetric and traditional display technologies to optimize performance while reducing production costs. Furthermore, the integration of AI-powered rendering engines allows real-time conversion of 2D medical scans into interactive 3D volumetric models, significantly expanding practical applications in healthcare and industrial design.

COMPETITIVE LANDSCAPE

Key Industry Players

Strategic Innovation and Partnerships Drive Market Competition

The global volumetric display screen market exhibits a moderately fragmented competitive landscape, with major players competing through technological advancements and strategic collaborations. HYPERVSN emerges as a frontrunner, leveraging its cutting-edge holographic display solutions and strong foothold in the media & entertainment sector. The company captured approximately 18% of the market share in 2024, largely due to its successful deployments in digital signage applications across retail and corporate environments.

Meanwhile, LightSpace Technologies and Holoxica have established themselves as key innovators in the medical visualization segment, with their high-resolution volumetric displays becoming indispensable tools for preoperative planning and medical education. These companies collectively accounted for nearly 25% of the static volume display segment revenue last year, reflecting growing adoption in healthcare applications.

The competitive intensity is further amplified by regional specialists like Fujipream in Asia and Euroscreen in Europe, who are capitalizing on local demand for advanced visualization technologies. Fujipream’s recent partnership with Japanese automakers for in-vehicle HUD systems exemplifies how companies are diversifying their application portfolios to capture emerging opportunities.

Investment activities in this space remain robust, with Leia Inc. securing $125 million in Series D funding in early 2024 to accelerate its lightfield display development. Such capital injections are enabling mid-tier players to challenge established leaders through disruptive innovation in display resolution and viewing angles.

List of Key Volumetric Display Screen Companies Profiled

  • HYPERVSN (UK)
  • Holoxica Limited (UK)
  • Leia Inc. (U.S.)
  • LightSpace Technologies (Latvia)
  • 3Dicons (U.S.)
  • Afriten Technologies (South Africa)
  • Dicon Corporation (U.S.)
  • Euroscreen SAS (France)
  • Fujipream Corporation (Japan)
  • Kelyn Technologies (China)
  • LianTronics (China)
  • Seekway Technology (China)
  • Volucap GmbH (Germany)
  • Zebra Imaging (U.S.)

Segment Analysis:

By Type

Static Volume Segment Dominates Due to High Clarity and Immersive 3D Visualization Capabilities

The market is segmented based on type into:

  • Static Volume
  • Swept Volume

By Application

Media and Entertainment Segment Leads Owing to Rising Demand for Advanced Visualization in Gaming and Advertising

The market is segmented based on application into:

  • Medical
  • Aerospace and Defense
  • Automotive
  • Media and Entertainment
  • Education and Training
  • Others (Oil, Gas, Mining, etc.)

By Technology

Laser Plasma Displays Gain Traction for High-Resolution 3D Projections

The market is segmented based on technology into:

  • Digital Light Processing (DLP)
  • Liquid Crystal Display (LCD)
  • Laser Plasma Display
  • Others

By End User

Commercial Sector Shows Strong Adoption for Advertising and Digital Signage Applications

The market is segmented based on end user into:

  • Commercial
  • Industrial
  • Healthcare
  • Military and Defense
  • Others

Regional Analysis: Volumetric Display Screen Market

North America
The North American volumetric display screen market is driven by strong R&D investments and early adoption of advanced visualization technologies across key verticals. The U.S. dominates with applications in medical imaging, aerospace simulation, and automotive design due to high-tech infrastructure capabilities. Government initiatives like the Department of Defense’s $3.8 billion VR/AR investment plan indirectly support volumetric display innovation. While cost remains a barrier for widespread commercial adoption, sectors like defense and healthcare prioritize these displays for mission-critical applications. The presence of key players including Zebra Imaging and LightSpace Technologies further strengthens regional competitiveness.

Europe
Europe demonstrates steady growth in volumetric display adoption, supported by robust manufacturing expertise in Germany and creative media applications in the U.K. The region benefits from cross-industry collaborations between academic institutions and tech firms, particularly in holographic display research. EU digital transformation initiatives are accelerating adoption in automotive prototyping and medical education. However, fragmented regulations across member states create challenges for standardization. Companies like Holoxica and Euroscreen are actively developing energy-efficient solutions to comply with the region’s strict sustainability mandates, positioning Europe as an innovation hub for specialized applications.

Asia-Pacific
As the fastest-growing market, Asia-Pacific is driven by massive manufacturing capabilities and digital infrastructure expansion. China leads regional demand with state-backed initiatives in next-gen display technologies, while Japan leverages its legacy in precision engineering for high-resolution volumetric solutions. The region sees increasing deployment in entertainment venues and education, though commercial adoption remains constrained by high production costs. Emerging players like Fujipream and Seekway Technology are gaining traction by offering cost-competitive alternatives, capitalizing on local supply chain advantages. India’s growing IT sector presents untapped potential, albeit with slower adoption due to budget constraints in end-user industries.

South America
South America represents a niche market where adoption is primarily limited to high-budget applications in oil/gas visualization and academic research. Brazil accounts for the majority of regional demand, with volumetric displays used for geological modeling in energy sectors. Economic instability hampers broader market penetration, though some progress is visible in creative media applications during large-scale events. The lack of local manufacturers creates dependency on imports, resulting in higher costs that restrict growth. Nevertheless, increasing foreign investments in mining and healthcare sectors may drive future demand for specialized display solutions.

Middle East & Africa
The MEA region shows promising but uneven growth, with adoption concentrated in oil-rich Gulf nations like the UAE and Saudi Arabia. Volumetric displays find application in energy exploration and smart city projects, supported by government digitalization agendas. High disposable income enables early experimentation with luxury retail and museum installations. However, the broader regional market faces challenges including limited technical expertise and infrastructure gaps. While South Africa shows interest in medical applications, progress is slow due to funding constraints. Strategic partnerships with global manufacturers could unlock the region’s long-term potential as infrastructure matures.

Report Scope

This market research report provides a comprehensive analysis of the global and regional Volumetric Display Screen markets, covering the forecast period 2024–2032. It offers detailed insights into market dynamics, technological advancements, competitive landscape, and key trends shaping the industry.

Key focus areas of the report include:

  • Market Size & Forecast: Historical data and future projections for revenue, unit shipments, and market value across major regions and segments.
  • Segmentation Analysis: Detailed breakdown by product type (Static Volume, Swept Volume), application (Medical, Aerospace & Defense, Automotive, etc.), and end-user industry to identify high-growth segments.
  • Regional Outlook: Insights into market performance across North America, Europe, Asia-Pacific, Latin America, and Middle East & Africa, including country-level analysis.
  • Competitive Landscape: Profiles of leading players including 3Dicons, Holoxica, HYPERVSN, and Leia, covering product portfolios, R&D investments, and strategic developments.
  • Technology Trends: Assessment of 3D visualization innovations, holographic display advancements, and integration with AR/VR technologies.
  • Market Drivers & Restraints: Analysis of factors like increasing demand for 3D visualization in healthcare and military, alongside challenges like high production costs.
  • Stakeholder Analysis: Strategic insights for display manufacturers, technology providers, investors, and end-users regarding market opportunities.

The research employs primary interviews with industry leaders and analysis of verified market data to ensure accuracy and actionable insights.

FREQUENTLY ASKED QUESTIONS:

What is the current market size of Global Volumetric Display Screen Market?

-> The global Volumetric Display Screen Market was valued at US$ 89 million in 2024 and is projected to reach US$ 287 million by 2032, at a CAGR of 15.8% during the forecast period 2025-2032.

Which key companies operate in this market?

-> Major players include 3Dicons, Holoxica, HYPERVSN, Leia, LightSpace Technologies, and Zebra Imaging, with the top five companies holding approximately 42% market share in 2024.

What are the key growth drivers?

-> Key drivers include rising demand for 3D visualization in medical imaging, military applications, and increasing adoption in automotive design.

Which region dominates the market?

-> North America held the largest market share (38%) in 2024, while Asia-Pacific is expected to grow at the highest CAGR (18.7%) during 2024-2032.

What are the emerging trends?

-> Emerging trends include development of touch-enabled volumetric displays, integration with AI for real-time 3D rendering, and miniaturization of display systems.

Volumetric Display Screen Market, Emerging Trends, Technological Advancements, and Business Strategies 2025-2032

Get Sample Report PDF for Exclusive Insights

Report Sample Includes

  • Table of Contents
  • List of Tables & Figures
  • Charts, Research Methodology, and more...
PDF Icon Download Sample Report PDF

Download Sample Report

Table of Content

1 Introduction to Research & Analysis Reports
1.1 Volumetric Display Screen Market Definition
1.2 Market Segments
1.2.1 Segment by Type
1.2.2 Segment by Application
1.3 Global Volumetric Display Screen Market Overview
1.4 Features & Benefits of This Report
1.5 Methodology & Sources of Information
1.5.1 Research Methodology
1.5.2 Research Process
1.5.3 Base Year
1.5.4 Report Assumptions & Caveats
2 Global Volumetric Display Screen Overall Market Size
2.1 Global Volumetric Display Screen Market Size: 2024 VS 2032
2.2 Global Volumetric Display Screen Market Size, Prospects & Forecasts: 2020-2032
2.3 Global Volumetric Display Screen Sales: 2020-2032
3 Company Landscape
3.1 Top Volumetric Display Screen Players in Global Market
3.2 Top Global Volumetric Display Screen Companies Ranked by Revenue
3.3 Global Volumetric Display Screen Revenue by Companies
3.4 Global Volumetric Display Screen Sales by Companies
3.5 Global Volumetric Display Screen Price by Manufacturer (2020-2025)
3.6 Top 3 and Top 5 Volumetric Display Screen Companies in Global Market, by Revenue in 2024
3.7 Global Manufacturers Volumetric Display Screen Product Type
3.8 Tier 1, Tier 2, and Tier 3 Volumetric Display Screen Players in Global Market
3.8.1 List of Global Tier 1 Volumetric Display Screen Companies
3.8.2 List of Global Tier 2 and Tier 3 Volumetric Display Screen Companies
4 Sights by Product
4.1 Overview
4.1.1 Segment by Type – Global Volumetric Display Screen Market Size Markets, 2024 & 2032
4.1.2 Static Volume
4.1.3 Swept Volume
4.2 Segment by Type – Global Volumetric Display Screen Revenue & Forecasts
4.2.1 Segment by Type – Global Volumetric Display Screen Revenue, 2020-2025
4.2.2 Segment by Type – Global Volumetric Display Screen Revenue, 2026-2032
4.2.3 Segment by Type – Global Volumetric Display Screen Revenue Market Share, 2020-2032
4.3 Segment by Type – Global Volumetric Display Screen Sales & Forecasts
4.3.1 Segment by Type – Global Volumetric Display Screen Sales, 2020-2025
4.3.2 Segment by Type – Global Volumetric Display Screen Sales, 2026-2032
4.3.3 Segment by Type – Global Volumetric Display Screen Sales Market Share, 2020-2032
4.4 Segment by Type – Global Volumetric Display Screen Price (Manufacturers Selling Prices), 2020-2032
5 Sights by Application
5.1 Overview
5.1.1 Segment by Application – Global Volumetric Display Screen Market Size, 2024 & 2032
5.1.2 Medical
5.1.3 Aerospace and Defense
5.1.4 Automotive
5.1.5 Media and Entertainment
5.1.6 Education and Training
5.1.7 Others (Oil, Gas, Mining, etc.)
5.2 Segment by Application – Global Volumetric Display Screen Revenue & Forecasts
5.2.1 Segment by Application – Global Volumetric Display Screen Revenue, 2020-2025
5.2.2 Segment by Application – Global Volumetric Display Screen Revenue, 2026-2032
5.2.3 Segment by Application – Global Volumetric Display Screen Revenue Market Share, 2020-2032
5.3 Segment by Application – Global Volumetric Display Screen Sales & Forecasts
5.3.1 Segment by Application – Global Volumetric Display Screen Sales, 2020-2025
5.3.2 Segment by Application – Global Volumetric Display Screen Sales, 2026-2032
5.3.3 Segment by Application – Global Volumetric Display Screen Sales Market Share, 2020-2032
5.4 Segment by Application – Global Volumetric Display Screen Price (Manufacturers Selling Prices), 2020-2032
6 Sights by Region
6.1 By Region – Global Volumetric Display Screen Market Size, 2024 & 2032
6.2 By Region – Global Volumetric Display Screen Revenue & Forecasts
6.2.1 By Region – Global Volumetric Display Screen Revenue, 2020-2025
6.2.2 By Region – Global Volumetric Display Screen Revenue, 2026-2032
6.2.3 By Region – Global Volumetric Display Screen Revenue Market Share, 2020-2032
6.3 By Region – Global Volumetric Display Screen Sales & Forecasts
6.3.1 By Region – Global Volumetric Display Screen Sales, 2020-2025
6.3.2 By Region – Global Volumetric Display Screen Sales, 2026-2032
6.3.3 By Region – Global Volumetric Display Screen Sales Market Share, 2020-2032
6.4 North America
6.4.1 By Country – North America Volumetric Display Screen Revenue, 2020-2032
6.4.2 By Country – North America Volumetric Display Screen Sales, 2020-2032
6.4.3 United States Volumetric Display Screen Market Size, 2020-2032
6.4.4 Canada Volumetric Display Screen Market Size, 2020-2032
6.4.5 Mexico Volumetric Display Screen Market Size, 2020-2032
6.5 Europe
6.5.1 By Country – Europe Volumetric Display Screen Revenue, 2020-2032
6.5.2 By Country – Europe Volumetric Display Screen Sales, 2020-2032
6.5.3 Germany Volumetric Display Screen Market Size, 2020-2032
6.5.4 France Volumetric Display Screen Market Size, 2020-2032
6.5.5 U.K. Volumetric Display Screen Market Size, 2020-2032
6.5.6 Italy Volumetric Display Screen Market Size, 2020-2032
6.5.7 Russia Volumetric Display Screen Market Size, 2020-2032
6.5.8 Nordic Countries Volumetric Display Screen Market Size, 2020-2032
6.5.9 Benelux Volumetric Display Screen Market Size, 2020-2032
6.6 Asia
6.6.1 By Region – Asia Volumetric Display Screen Revenue, 2020-2032
6.6.2 By Region – Asia Volumetric Display Screen Sales, 2020-2032
6.6.3 China Volumetric Display Screen Market Size, 2020-2032
6.6.4 Japan Volumetric Display Screen Market Size, 2020-2032
6.6.5 South Korea Volumetric Display Screen Market Size, 2020-2032
6.6.6 Southeast Asia Volumetric Display Screen Market Size, 2020-2032
6.6.7 India Volumetric Display Screen Market Size, 2020-2032
6.7 South America
6.7.1 By Country – South America Volumetric Display Screen Revenue, 2020-2032
6.7.2 By Country – South America Volumetric Display Screen Sales, 2020-2032
6.7.3 Brazil Volumetric Display Screen Market Size, 2020-2032
6.7.4 Argentina Volumetric Display Screen Market Size, 2020-2032
6.8 Middle East & Africa
6.8.1 By Country – Middle East & Africa Volumetric Display Screen Revenue, 2020-2032
6.8.2 By Country – Middle East & Africa Volumetric Display Screen Sales, 2020-2032
6.8.3 Turkey Volumetric Display Screen Market Size, 2020-2032
6.8.4 Israel Volumetric Display Screen Market Size, 2020-2032
6.8.5 Saudi Arabia Volumetric Display Screen Market Size, 2020-2032
6.8.6 UAE Volumetric Display Screen Market Size, 2020-2032
7 Manufacturers & Brands Profiles
7.1 3Dicons
7.1.1 3Dicons Company Summary
7.1.2 3Dicons Business Overview
7.1.3 3Dicons Volumetric Display Screen Major Product Offerings
7.1.4 3Dicons Volumetric Display Screen Sales and Revenue in Global (2020-2025)
7.1.5 3Dicons Key News & Latest Developments
7.2 Afriten Technologies
7.2.1 Afriten Technologies Company Summary
7.2.2 Afriten Technologies Business Overview
7.2.3 Afriten Technologies Volumetric Display Screen Major Product Offerings
7.2.4 Afriten Technologies Volumetric Display Screen Sales and Revenue in Global (2020-2025)
7.2.5 Afriten Technologies Key News & Latest Developments
7.3 Dicon
7.3.1 Dicon Company Summary
7.3.2 Dicon Business Overview
7.3.3 Dicon Volumetric Display Screen Major Product Offerings
7.3.4 Dicon Volumetric Display Screen Sales and Revenue in Global (2020-2025)
7.3.5 Dicon Key News & Latest Developments
7.4 Euroscreen
7.4.1 Euroscreen Company Summary
7.4.2 Euroscreen Business Overview
7.4.3 Euroscreen Volumetric Display Screen Major Product Offerings
7.4.4 Euroscreen Volumetric Display Screen Sales and Revenue in Global (2020-2025)
7.4.5 Euroscreen Key News & Latest Developments
7.5 Fujipream
7.5.1 Fujipream Company Summary
7.5.2 Fujipream Business Overview
7.5.3 Fujipream Volumetric Display Screen Major Product Offerings
7.5.4 Fujipream Volumetric Display Screen Sales and Revenue in Global (2020-2025)
7.5.5 Fujipream Key News & Latest Developments
7.6 Holoxica
7.6.1 Holoxica Company Summary
7.6.2 Holoxica Business Overview
7.6.3 Holoxica Volumetric Display Screen Major Product Offerings
7.6.4 Holoxica Volumetric Display Screen Sales and Revenue in Global (2020-2025)
7.6.5 Holoxica Key News & Latest Developments
7.7 HYPERVSN
7.7.1 HYPERVSN Company Summary
7.7.2 HYPERVSN Business Overview
7.7.3 HYPERVSN Volumetric Display Screen Major Product Offerings
7.7.4 HYPERVSN Volumetric Display Screen Sales and Revenue in Global (2020-2025)
7.7.5 HYPERVSN Key News & Latest Developments
7.8 Kelyn Technologies
7.8.1 Kelyn Technologies Company Summary
7.8.2 Kelyn Technologies Business Overview
7.8.3 Kelyn Technologies Volumetric Display Screen Major Product Offerings
7.8.4 Kelyn Technologies Volumetric Display Screen Sales and Revenue in Global (2020-2025)
7.8.5 Kelyn Technologies Key News & Latest Developments
7.9 Leia
7.9.1 Leia Company Summary
7.9.2 Leia Business Overview
7.9.3 Leia Volumetric Display Screen Major Product Offerings
7.9.4 Leia Volumetric Display Screen Sales and Revenue in Global (2020-2025)
7.9.5 Leia Key News & Latest Developments
7.10 LianTronics
7.10.1 LianTronics Company Summary
7.10.2 LianTronics Business Overview
7.10.3 LianTronics Volumetric Display Screen Major Product Offerings
7.10.4 LianTronics Volumetric Display Screen Sales and Revenue in Global (2020-2025)
7.10.5 LianTronics Key News & Latest Developments
7.11 LightSpace Technologies
7.11.1 LightSpace Technologies Company Summary
7.11.2 LightSpace Technologies Business Overview
7.11.3 LightSpace Technologies Volumetric Display Screen Major Product Offerings
7.11.4 LightSpace Technologies Volumetric Display Screen Sales and Revenue in Global (2020-2025)
7.11.5 LightSpace Technologies Key News & Latest Developments
7.12 Merck KGaA
7.12.1 Merck KGaA Company Summary
7.12.2 Merck KGaA Business Overview
7.12.3 Merck KGaA Volumetric Display Screen Major Product Offerings
7.12.4 Merck KGaA Volumetric Display Screen Sales and Revenue in Global (2020-2025)
7.12.5 Merck KGaA Key News & Latest Developments
7.13 Seekway Technology
7.13.1 Seekway Technology Company Summary
7.13.2 Seekway Technology Business Overview
7.13.3 Seekway Technology Volumetric Display Screen Major Product Offerings
7.13.4 Seekway Technology Volumetric Display Screen Sales and Revenue in Global (2020-2025)
7.13.5 Seekway Technology Key News & Latest Developments
7.14 Volucap
7.14.1 Volucap Company Summary
7.14.2 Volucap Business Overview
7.14.3 Volucap Volumetric Display Screen Major Product Offerings
7.14.4 Volucap Volumetric Display Screen Sales and Revenue in Global (2020-2025)
7.14.5 Volucap Key News & Latest Developments
7.15 Zebra Imaging
7.15.1 Zebra Imaging Company Summary
7.15.2 Zebra Imaging Business Overview
7.15.3 Zebra Imaging Volumetric Display Screen Major Product Offerings
7.15.4 Zebra Imaging Volumetric Display Screen Sales and Revenue in Global (2020-2025)
7.15.5 Zebra Imaging Key News & Latest Developments
8 Global Volumetric Display Screen Production Capacity, Analysis
8.1 Global Volumetric Display Screen Production Capacity, 2020-2032
8.2 Volumetric Display Screen Production Capacity of Key Manufacturers in Global Market
8.3 Global Volumetric Display Screen Production by Region
9 Key Market Trends, Opportunity, Drivers and Restraints
9.1 Market Opportunities & Trends
9.2 Market Drivers
9.3 Market Restraints
10 Volumetric Display Screen Supply Chain Analysis
10.1 Volumetric Display Screen Industry Value Chain
10.2 Volumetric Display Screen Upstream Market
10.3 Volumetric Display Screen Downstream and Clients
10.4 Marketing Channels Analysis
10.4.1 Marketing Channels
10.4.2 Volumetric Display Screen Distributors and Sales Agents in Global
11 Conclusion
12 Appendix
12.1 Note
12.2 Examples of Clients
12.3 DisclaimerList of Tables
Table 1. Key Players of Volumetric Display Screen in Global Market
Table 2. Top Volumetric Display Screen Players in Global Market, Ranking by Revenue (2024)
Table 3. Global Volumetric Display Screen Revenue by Companies, (US$, Mn), 2020-2025
Table 4. Global Volumetric Display Screen Revenue Share by Companies, 2020-2025
Table 5. Global Volumetric Display Screen Sales by Companies, (K Units), 2020-2025
Table 6. Global Volumetric Display Screen Sales Share by Companies, 2020-2025
Table 7. Key Manufacturers Volumetric Display Screen Price (2020-2025) & (US$/Unit)
Table 8. Global Manufacturers Volumetric Display Screen Product Type
Table 9. List of Global Tier 1 Volumetric Display Screen Companies, Revenue (US$, Mn) in 2024 and Market Share
Table 10. List of Global Tier 2 and Tier 3 Volumetric Display Screen Companies, Revenue (US$, Mn) in 2024 and Market Share
Table 11. Segment by Type – Global Volumetric Display Screen Revenue, (US$, Mn), 2024 & 2032
Table 12. Segment by Type – Global Volumetric Display Screen Revenue (US$, Mn), 2020-2025
Table 13. Segment by Type – Global Volumetric Display Screen Revenue (US$, Mn), 2026-2032
Table 14. Segment by Type – Global Volumetric Display Screen Sales (K Units), 2020-2025
Table 15. Segment by Type – Global Volumetric Display Screen Sales (K Units), 2026-2032
Table 16. Segment by Application – Global Volumetric Display Screen Revenue, (US$, Mn), 2024 & 2032
Table 17. Segment by Application – Global Volumetric Display Screen Revenue, (US$, Mn), 2020-2025
Table 18. Segment by Application – Global Volumetric Display Screen Revenue, (US$, Mn), 2026-2032
Table 19. Segment by Application – Global Volumetric Display Screen Sales, (K Units), 2020-2025
Table 20. Segment by Application – Global Volumetric Display Screen Sales, (K Units), 2026-2032
Table 21. By Region – Global Volumetric Display Screen Revenue, (US$, Mn), 2025-2032
Table 22. By Region – Global Volumetric Display Screen Revenue, (US$, Mn), 2020-2025
Table 23. By Region – Global Volumetric Display Screen Revenue, (US$, Mn), 2026-2032
Table 24. By Region – Global Volumetric Display Screen Sales, (K Units), 2020-2025
Table 25. By Region – Global Volumetric Display Screen Sales, (K Units), 2026-2032
Table 26. By Country – North America Volumetric Display Screen Revenue, (US$, Mn), 2020-2025
Table 27. By Country – North America Volumetric Display Screen Revenue, (US$, Mn), 2026-2032
Table 28. By Country – North America Volumetric Display Screen Sales, (K Units), 2020-2025
Table 29. By Country – North America Volumetric Display Screen Sales, (K Units), 2026-2032
Table 30. By Country – Europe Volumetric Display Screen Revenue, (US$, Mn), 2020-2025
Table 31. By Country – Europe Volumetric Display Screen Revenue, (US$, Mn), 2026-2032
Table 32. By Country – Europe Volumetric Display Screen Sales, (K Units), 2020-2025
Table 33. By Country – Europe Volumetric Display Screen Sales, (K Units), 2026-2032
Table 34. By Region – Asia Volumetric Display Screen Revenue, (US$, Mn), 2020-2025
Table 35. By Region – Asia Volumetric Display Screen Revenue, (US$, Mn), 2026-2032
Table 36. By Region – Asia Volumetric Display Screen Sales, (K Units), 2020-2025
Table 37. By Region – Asia Volumetric Display Screen Sales, (K Units), 2026-2032
Table 38. By Country – South America Volumetric Display Screen Revenue, (US$, Mn), 2020-2025
Table 39. By Country – South America Volumetric Display Screen Revenue, (US$, Mn), 2026-2032
Table 40. By Country – South America Volumetric Display Screen Sales, (K Units), 2020-2025
Table 41. By Country – South America Volumetric Display Screen Sales, (K Units), 2026-2032
Table 42. By Country – Middle East & Africa Volumetric Display Screen Revenue, (US$, Mn), 2020-2025
Table 43. By Country – Middle East & Africa Volumetric Display Screen Revenue, (US$, Mn), 2026-2032
Table 44. By Country – Middle East & Africa Volumetric Display Screen Sales, (K Units), 2020-2025
Table 45. By Country – Middle East & Africa Volumetric Display Screen Sales, (K Units), 2026-2032
Table 46. 3Dicons Company Summary
Table 47. 3Dicons Volumetric Display Screen Product Offerings
Table 48. 3Dicons Volumetric Display Screen Sales (K Units), Revenue (US$, Mn) and Average Price (US$/Unit) & (2020-2025)
Table 49. 3Dicons Key News & Latest Developments
Table 50. Afriten Technologies Company Summary
Table 51. Afriten Technologies Volumetric Display Screen Product Offerings
Table 52. Afriten Technologies Volumetric Display Screen Sales (K Units), Revenue (US$, Mn) and Average Price (US$/Unit) & (2020-2025)
Table 53. Afriten Technologies Key News & Latest Developments
Table 54. Dicon Company Summary
Table 55. Dicon Volumetric Display Screen Product Offerings
Table 56. Dicon Volumetric Display Screen Sales (K Units), Revenue (US$, Mn) and Average Price (US$/Unit) & (2020-2025)
Table 57. Dicon Key News & Latest Developments
Table 58. Euroscreen Company Summary
Table 59. Euroscreen Volumetric Display Screen Product Offerings
Table 60. Euroscreen Volumetric Display Screen Sales (K Units), Revenue (US$, Mn) and Average Price (US$/Unit) & (2020-2025)
Table 61. Euroscreen Key News & Latest Developments
Table 62. Fujipream Company Summary
Table 63. Fujipream Volumetric Display Screen Product Offerings
Table 64. Fujipream Volumetric Display Screen Sales (K Units), Revenue (US$, Mn) and Average Price (US$/Unit) & (2020-2025)
Table 65. Fujipream Key News & Latest Developments
Table 66. Holoxica Company Summary
Table 67. Holoxica Volumetric Display Screen Product Offerings
Table 68. Holoxica Volumetric Display Screen Sales (K Units), Revenue (US$, Mn) and Average Price (US$/Unit) & (2020-2025)
Table 69. Holoxica Key News & Latest Developments
Table 70. HYPERVSN Company Summary
Table 71. HYPERVSN Volumetric Display Screen Product Offerings
Table 72. HYPERVSN Volumetric Display Screen Sales (K Units), Revenue (US$, Mn) and Average Price (US$/Unit) & (2020-2025)
Table 73. HYPERVSN Key News & Latest Developments
Table 74. Kelyn Technologies Company Summary
Table 75. Kelyn Technologies Volumetric Display Screen Product Offerings
Table 76. Kelyn Technologies Volumetric Display Screen Sales (K Units), Revenue (US$, Mn) and Average Price (US$/Unit) & (2020-2025)
Table 77. Kelyn Technologies Key News & Latest Developments
Table 78. Leia Company Summary
Table 79. Leia Volumetric Display Screen Product Offerings
Table 80. Leia Volumetric Display Screen Sales (K Units), Revenue (US$, Mn) and Average Price (US$/Unit) & (2020-2025)
Table 81. Leia Key News & Latest Developments
Table 82. LianTronics Company Summary
Table 83. LianTronics Volumetric Display Screen Product Offerings
Table 84. LianTronics Volumetric Display Screen Sales (K Units), Revenue (US$, Mn) and Average Price (US$/Unit) & (2020-2025)
Table 85. LianTronics Key News & Latest Developments
Table 86. LightSpace Technologies Company Summary
Table 87. LightSpace Technologies Volumetric Display Screen Product Offerings
Table 88. LightSpace Technologies Volumetric Display Screen Sales (K Units), Revenue (US$, Mn) and Average Price (US$/Unit) & (2020-2025)
Table 89. LightSpace Technologies Key News & Latest Developments
Table 90. Merck KGaA Company Summary
Table 91. Merck KGaA Volumetric Display Screen Product Offerings
Table 92. Merck KGaA Volumetric Display Screen Sales (K Units), Revenue (US$, Mn) and Average Price (US$/Unit) & (2020-2025)
Table 93. Merck KGaA Key News & Latest Developments
Table 94. Seekway Technology Company Summary
Table 95. Seekway Technology Volumetric Display Screen Product Offerings
Table 96. Seekway Technology Volumetric Display Screen Sales (K Units), Revenue (US$, Mn) and Average Price (US$/Unit) & (2020-2025)
Table 97. Seekway Technology Key News & Latest Developments
Table 98. Volucap Company Summary
Table 99. Volucap Volumetric Display Screen Product Offerings
Table 100. Volucap Volumetric Display Screen Sales (K Units), Revenue (US$, Mn) and Average Price (US$/Unit) & (2020-2025)
Table 101. Volucap Key News & Latest Developments
Table 102. Zebra Imaging Company Summary
Table 103. Zebra Imaging Volumetric Display Screen Product Offerings
Table 104. Zebra Imaging Volumetric Display Screen Sales (K Units), Revenue (US$, Mn) and Average Price (US$/Unit) & (2020-2025)
Table 105. Zebra Imaging Key News & Latest Developments
Table 106. Volumetric Display Screen Capacity of Key Manufacturers in Global Market, 2023-2025 (K Units)
Table 107. Global Volumetric Display Screen Capacity Market Share of Key Manufacturers, 2023-2025
Table 108. Global Volumetric Display Screen Production by Region, 2020-2025 (K Units)
Table 109. Global Volumetric Display Screen Production by Region, 2026-2032 (K Units)
Table 110. Volumetric Display Screen Market Opportunities & Trends in Global Market
Table 111. Volumetric Display Screen Market Drivers in Global Market
Table 112. Volumetric Display Screen Market Restraints in Global Market
Table 113. Volumetric Display Screen Raw Materials
Table 114. Volumetric Display Screen Raw Materials Suppliers in Global Market
Table 115. Typical Volumetric Display Screen Downstream
Table 116. Volumetric Display Screen Downstream Clients in Global Market
Table 117. Volumetric Display Screen Distributors and Sales Agents in Global Market

List of Figures
Figure 1. Volumetric Display Screen Product Picture
Figure 2. Volumetric Display Screen Segment by Type in 2024
Figure 3. Volumetric Display Screen Segment by Application in 2024
Figure 4. Global Volumetric Display Screen Market Overview: 2024
Figure 5. Key Caveats
Figure 6. Global Volumetric Display Screen Market Size: 2024 VS 2032 (US$, Mn)
Figure 7. Global Volumetric Display Screen Revenue: 2020-2032 (US$, Mn)
Figure 8. Volumetric Display Screen Sales in Global Market: 2020-2032 (K Units)
Figure 9. The Top 3 and 5 Players Market Share by Volumetric Display Screen Revenue in 2024
Figure 10. Segment by Type – Global Volumetric Display Screen Revenue, (US$, Mn), 2024 & 2032
Figure 11. Segment by Type – Global Volumetric Display Screen Revenue Market Share, 2020-2032
Figure 12. Segment by Type – Global Volumetric Display Screen Sales Market Share, 2020-2032
Figure 13. Segment by Type – Global Volumetric Display Screen Price (US$/Unit), 2020-2032
Figure 14. Segment by Application – Global Volumetric Display Screen Revenue, (US$, Mn), 2024 & 2032
Figure 15. Segment by Application – Global Volumetric Display Screen Revenue Market Share, 2020-2032
Figure 16. Segment by Application – Global Volumetric Display Screen Sales Market Share, 2020-2032
Figure 17. Segment by Application -Global Volumetric Display Screen Price (US$/Unit), 2020-2032
Figure 18. By Region – Global Volumetric Display Screen Revenue, (US$, Mn), 2025 & 2032
Figure 19. By Region – Global Volumetric Display Screen Revenue Market Share, 2020 VS 2024 VS 2032
Figure 20. By Region – Global Volumetric Display Screen Revenue Market Share, 2020-2032
Figure 21. By Region – Global Volumetric Display Screen Sales Market Share, 2020-2032
Figure 22. By Country – North America Volumetric Display Screen Revenue Market Share, 2020-2032
Figure 23. By Country – North America Volumetric Display Screen Sales Market Share, 2020-2032
Figure 24. United States Volumetric Display Screen Revenue, (US$, Mn), 2020-2032
Figure 25. Canada Volumetric Display Screen Revenue, (US$, Mn), 2020-2032
Figure 26. Mexico Volumetric Display Screen Revenue, (US$, Mn), 2020-2032
Figure 27. By Country – Europe Volumetric Display Screen Revenue Market Share, 2020-2032
Figure 28. By Country – Europe Volumetric Display Screen Sales Market Share, 2020-2032
Figure 29. Germany Volumetric Display Screen Revenue, (US$, Mn), 2020-2032
Figure 30. France Volumetric Display Screen Revenue, (US$, Mn), 2020-2032
Figure 31. U.K. Volumetric Display Screen Revenue, (US$, Mn), 2020-2032
Figure 32. Italy Volumetric Display Screen Revenue, (US$, Mn), 2020-2032
Figure 33. Russia Volumetric Display Screen Revenue, (US$, Mn), 2020-2032
Figure 34. Nordic Countries Volumetric Display Screen Revenue, (US$, Mn), 2020-2032
Figure 35. Benelux Volumetric Display Screen Revenue, (US$, Mn), 2020-2032
Figure 36. By Region – Asia Volumetric Display Screen Revenue Market Share, 2020-2032
Figure 37. By Region – Asia Volumetric Display Screen Sales Market Share, 2020-2032
Figure 38. China Volumetric Display Screen Revenue, (US$, Mn), 2020-2032
Figure 39. Japan Volumetric Display Screen Revenue, (US$, Mn), 2020-2032
Figure 40. South Korea Volumetric Display Screen Revenue, (US$, Mn), 2020-2032
Figure 41. Southeast Asia Volumetric Display Screen Revenue, (US$, Mn), 2020-2032
Figure 42. India Volumetric Display Screen Revenue, (US$, Mn), 2020-2032
Figure 43. By Country – South America Volumetric Display Screen Revenue Market Share, 2020-2032
Figure 44. By Country – South America Volumetric Display Screen Sales, Market Share, 2020-2032
Figure 45. Brazil Volumetric Display Screen Revenue, (US$, Mn), 2020-2032
Figure 46. Argentina Volumetric Display Screen Revenue, (US$, Mn), 2020-2032
Figure 47. By Country – Middle East & Africa Volumetric Display Screen Revenue, Market Share, 2020-2032
Figure 48. By Country – Middle East & Africa Volumetric Display Screen Sales, Market Share, 2020-2032
Figure 49. Turkey Volumetric Display Screen Revenue, (US$, Mn), 2020-2032
Figure 50. Israel Volumetric Display Screen Revenue, (US$, Mn), 2020-2032
Figure 51. Saudi Arabia Volumetric Display Screen Revenue, (US$, Mn), 2020-2032
Figure 52. UAE Volumetric Display Screen Revenue, (US$, Mn), 2020-2032
Figure 53. Global Volumetric Display Screen Production Capacity (K Units), 2020-2032
Figure 54. The Percentage of Production Volumetric Display Screen by Region, 2024 VS 2032
Figure 55. Volumetric Display Screen Industry Value Chain
Figure 56. Marketing Channels