Video Scoreboard Market Technology Adoption, AI Integration and Industry Outlook (2026-2034)

Video Scoreboard Market size was valued at USD 569 million in 2025. The market is projected to grow from USD 591 million in 2026 to USD 740 million by 2034, exhibiting a CAGR of 3.9% during the forecast period.

PDF Icon Download Sample Report PDF
  • Quick Dispatch

    All Orders

  • Secure Payment

    100% Secure Payment

Price range: $1,500.00 through $4,250.00

Clear

Market Insights

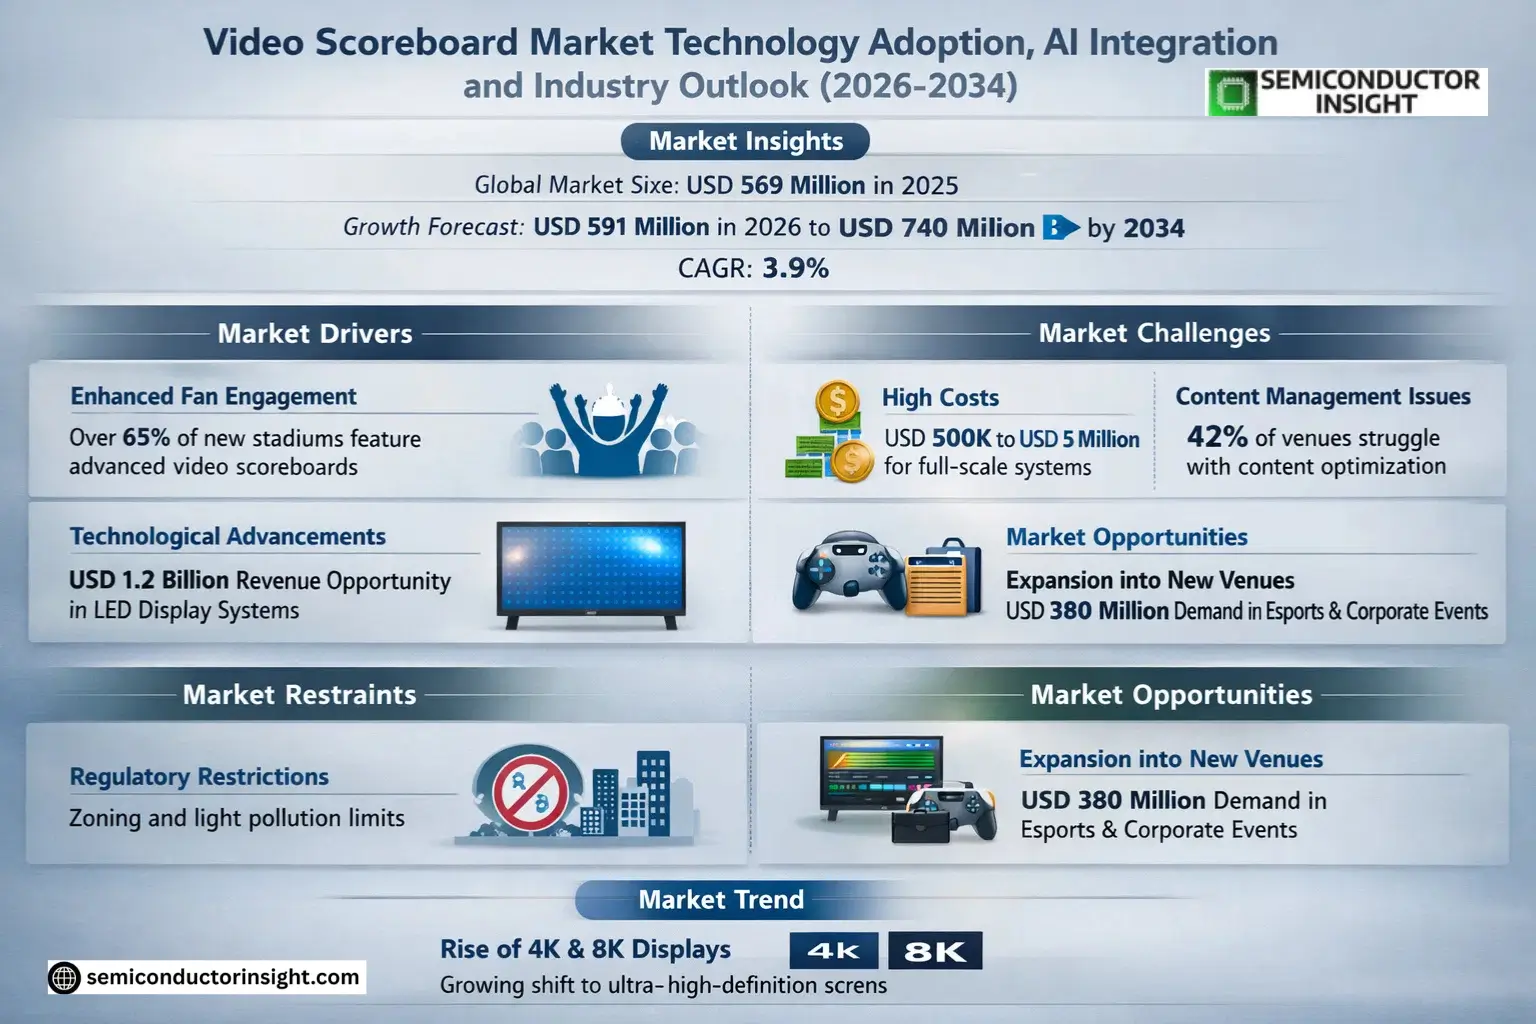
Global Video Scoreboard Market size was valued at USD 569 million in 2025. The market is projected to grow from USD 591 million in 2026 to USD 740 million by 2034, exhibiting a CAGR of 3.9% during the forecast period.

Video scoreboards are advanced display systems used in sports venues to showcase live scores, player statistics, advertisements, and instant replays. These systems integrate LED or LCD technology for high-visibility performance and often include features like wireless connectivity, real-time data integration, and interactive fan engagement tools. The market includes both standard and customized scoreboards tailored for various indoor and outdoor sporting applications.

The market growth is driven by increasing investments in sports infrastructure, rising demand for enhanced spectator experiences, and technological advancements in display solutions. While North America currently dominates due to high adoption rates in professional leagues, Asia-Pacific shows strong potential with growing investments in stadium modernization. Key players such as Daktronics and Nevco continue innovating with energy-efficient designs and modular systems to meet evolving industry requirements.

Video Scoreboard Market Size & Forecast

MARKET DRIVERS

Growing Demand for Enhanced Fan Engagement

Video Scoreboard Market is experiencing significant growth due to increasing demand for immersive fan experiences in stadiums and sports arenas. Modern video scoreboards integrate high-definition displays and real-time data to enhance audience engagement, driving adoption across sports franchises and event venues. Over 65% of newly constructed stadiums now incorporate advanced video scoreboard systems as a standard feature.

Technological Advancements in Display Systems

Innovations in LED technology have revolutionized the Video Scoreboard Market, enabling brighter, more energy-efficient displays with higher resolution. The shift from conventional scoreboards to full-color LED video systems has created a USD 1.2 billion revenue opportunity, with annual growth projected at 8.3% through 2028.

Digital transformation in sports infrastructure and rising sponsorship revenues are further fueling investments in premium video scoreboard solutions.

MARKET CHALLENGES

High Implementation and Maintenance Costs

Video Scoreboard Market faces pricing barriers, particularly for smaller venues and educational institutions. A full-featured LED video scoreboard system can cost between USD 500,000 to USD 5 million, with annual maintenance expenses adding 15-20% to the total cost of ownership.

Other Challenges

Content Management Complexity
Managing dynamic content for modern video scoreboards requires specialized software and trained personnel, creating operational challenges for some organizations. Approximately 42% of venues report difficulties in maximizing their video scoreboard capabilities due to content creation limitations.

MARKET RESTRAINTS

Regulatory and Zoning Restrictions

Municipal regulations on light pollution and digital signage often restrict video scoreboard implementations, particularly in urban environments. Some jurisdictions impose strict brightness limits or operational time restrictions that limit the effectiveness of outdoor video display systems.

MARKET OPPORTUNITIES

Expansion into Non-Traditional Venues

Video Scoreboard Market is expanding beyond professional sports into collegiate facilities, esports arenas, and corporate event spaces. Global esports sector alone is creating USD 380 million in annual demand for compact, high-refresh-rate video scoreboard solutions tailored for competitive gaming venues.
Video Scoreboard Market Trends

Growing Demand for High-Resolution Displays

Video Scoreboard Market is experiencing a shift toward ultra-high-definition displays as sports venues seek to enhance viewer engagement. Stadiums and arenas are upgrading from standard LED panels to 4K and 8K resolution screens for better clarity and immersive experiences. Manufacturers like Daktronics and Watchfire Signs are leading this transition with advanced pixel pitch technologies.

Other Trends

Customization for Multi-Sport Venues

Sports facilities increasingly require versatile scoreboards that can adapt to different events. Customized Video Scoreboards with modular designs allow quick configuration changes for basketball, hockey, and concerts. The demand for flexible displays has grown by approximately 12% annually as venues optimize space utilization.

Integration with Digital Analytics

Modern Video Scoreboards now incorporate real-time data feeds, player statistics, and interactive elements. This trend is driven by the sports industry’s focus on fan engagement technologies. Solution providers are embedding IoT sensors and cloud connectivity to deliver dynamic content during live events.

Energy-Efficient LED Solutions

Venue operators are prioritizing sustainability, leading to increased adoption of low-power LED Video Scoreboards. New models consume 30-40% less energy than previous generations while maintaining brightness, reducing operational costs for stadium owners.

Regional Adoption Patterns

North America remains the dominant region for Video Scoreboard installations, accounting for over 45% of global deployments. However, Asia-Pacific shows the fastest growth, particularly in China and India, where new stadium constructions are driving demand. Europe maintains steady adoption with upgrades to existing sports infrastructure.

COMPETITIVE LANDSCAPE

Key Industry Players

Video Scoreboard Market Dominated by Technology Leaders and Sports Solution Providers

Global Video Scoreboard Market is characterized by the dominance of established players like Daktronics and Nevco, which collectively hold significant market share. These companies lead through continuous innovation in LED technology and control systems, catering to both standard and customized scoreboard requirements. The market exhibits moderate consolidation with the top five players accounting for substantial revenue share, while regional specialists continue to maintain strong positions in local markets.

Niche players like Formetco Sports and Bodet Sport have carved out specialized positions through tailored solutions for specific sports applications. Emerging competitors are focusing on energy-efficient displays and integrated digital signage capabilities to differentiate their offerings. The competitive intensity has increased with advancements in high-resolution LED technologies and demand for multi-functional scoreboard systems across sports venues worldwide.

List of Key Video Scoreboard Companies Profiled

  • Daktronics
  • Nevco
  • OES Scoreboards
  • Formetco Sports
  • FSL Scoreboards
  • Fair-Play
  • Bodet Sport
  • Plainview LED
  • Ultravision LED
  • Watchfire Signs, LLC
  • VCRNOW
  • All American Scoreboards
  • Samsung Electronics
  • Leyard Optoelectronic
  • Absen Optoelectronic

Segment Analysis:

Segment Category Sub-Segments Key Insights
By Type
  • Standard Scoreboards
  • Customized Scoreboards
Customized Scoreboards are gaining traction due to growing demand for branded fan experiences.

  • Enable sponsorships and dynamic content integration beyond basic scorekeeping
  • High-definition LED displays preferred for seamless video integration
  • Flexible architectural designs to match venue aesthetics
By Application
  • Indoor Sports Venues
  • Outdoor Sports Venues
  • Entertainment Complexes
  • Others
Outdoor Sports Venues dominate installations due to large spectator capacities and professional sports demand.

  • Require weather-resistant construction with high brightness displays
  • Multi-screen configurations becoming standard for enhanced viewing angles
  • Integration with stadium WiFi networks for interactive fan engagement
By End User
  • Professional Sports Teams
  • Educational Institutions
  • Municipal Authorities
Professional Sports Teams lead adoption with premium installations.

  • View scoreboards as revenue generators through advertising integrations
  • Increasingly specify modular systems for easy content updates
  • Preference for suppliers with full-service maintenance contracts
By Display Technology
  • LED Displays
  • LCD Screens
  • Hybrid Systems
LED Displays represent the industry standard for most implementations.

  • Offer superior visibility under various lighting conditions
  • Modular design allows for creative shapes and sizes
  • Energy efficiency improvements driving cost savings
By Control System
  • Local Control Systems
  • Cloud-Based Platforms
  • Hybrid Solutions
Cloud-Based Platforms are transforming content management capabilities.

  • Enable remote content updates across multiple venues
  • Integration with sports data APIs for real-time statistics
  • Growing preference for subscription-based software models

Regional Analysis: Video Scoreboard Market

North America

North America emerges as the undisputed leader in the Video Scoreboard Market, driven by cutting-edge technology adoption and robust sports infrastructure. The region’s dominance stems from early AI integration in stadium display systems and premium sports leagues prioritizing immersive fan experiences. Major tech hubs like Silicon Valley are pioneering AI-powered video analytics for dynamic content display, while Canadian markets show increasing demand for energy-efficient LED solutions. Strategic partnerships between display manufacturers and sports franchises fuel innovation, with hockey and basketball arenas setting global benchmarks. The region’s regulatory environment encourages digital transformation in sports venues, creating ideal conditions for next-generation scoreboard deployment across collegiate and professional sectors.

Technology Leadership
North American manufacturers lead in 4K/8K micro-LED displays with integrated AI content management systems, enabling real-time stats visualization and targeted advertising during live events. Key players maintain R&D centers focused on reducing latency in video processing.
Stadium Modernization
Over 60% of major league stadiums have undergone display system upgrades since 2020, incorporating multi-screen video walls and interactive fan engagement features. This refresh cycle creates sustained demand for advanced video scoreboard solutions with IoT connectivity.
AI Integration
Machine learning algorithms now power automatic camera switching and instant replay generation for scoreboard displays. Several NHL arenas employ computer vision to track puck movement and player positions for enhanced spectator visualization.
Content Personalization
Next-generation systems allow venue operators to deliver customized content to different seating sections. Luxury suite displays show premium stats packages while general seating areas receive crowd prompts and social media integrations.

Europe
European markets demonstrate strong growth in modular video scoreboard solutions, particularly in soccer stadiums complying with UEFA broadcast standards. German manufacturers lead in developing weather-resistant outdoor displays capable of high brightness performance. The region shows increasing adoption of circular and curved display configurations to suit historic venue architectures, with sustainability becoming a key purchase criterion. Emerging opportunities exist in Eastern Europe where stadium modernization initiatives align with major sporting events.

Asia-Pacific
Asia-Pacific represents the fastest-growing region with China and Japan driving demand through massive sports infrastructure projects. Japanese vendors specialize in high-density pixel displays for baseball stadiums, while Australian venues pioneer solar-powered scoreboard systems. India’s expanding IPL cricket league creates substantial opportunities, though price sensitivity remains challenging. Regional manufacturers compete on cost-effective solutions with extended durability for tropical climates.

South America
Brazil and Argentina dominate South American demand, focused on cost-efficient LED displays for soccer stadiums. The market shows preference for dual-purpose systems serving both sporting and concert events. Infrastructure limitations in some countries create demand for portable and temporary video scoreboard solutions. Emerging interest in fan engagement technologies could drive future upgrades across the region’s major football venues.

Middle East & Africa
Gulf nations lead regional adoption through massive investments in smart stadium projects tied to international events. UAE and Qatar showcase cutting-edge circular video displays with Arabic/English bilingual interfaces. African markets remain nascent but show potential with increasing professionalization of soccer leagues. Climatic challenges spur innovation in heat-resistant display components and dust-proof enclosures for outdoor installations.

Report Scope

This market research report provides a comprehensive analysis of the Video Scoreboard Market , covering the forecast period 2025–2034. It offers detailed insights into market dynamics, technological advancements, competitive landscape, and key trends shaping the industry.

Key focus areas of the report include:

  • Market Overview: The report begins with an overview outlining its current market scenario, key growth indicators, and industry transformation drivers. It discusses macroeconomic factors, demand–supply balance, regulatory landscape, and the strategic role of video scoreboards in enhancing sports venues and events.
  • Market Size & Forecast: Historical data and future projections for revenue, unit shipments, and market value across major regions and segments.
  • Segmentation Analysis: Detailed breakdown by product type, application, and end-user industry to identify high-growth segments and investment opportunities.
  • Regional Insights: Insights into market performance across North America, Europe, Asia, South America, and Middle East & Africa, including country-level analysis where relevant.
  • Competitive Landscape: Profiles of leading market participants, including their product offerings, R&D focus, manufacturing capacity, pricing strategies, and recent developments such as mergers, acquisitions, and partnerships.
  • Technology Trends & Innovation: Assessment of emerging technologies, integration of AI/IoT, and evolving industry standards.
  • Market Drivers & Restraints: Evaluation of factors driving market growth along with challenges, supply chain constraints, regulatory issues, and market-entry barriers.
  • Stakeholder Insights: Insights for component suppliers, OEMs, system integrators, investors, and policymakers regarding the evolving ecosystem and strategic opportunities.

Primary and secondary research methods are employed, including interviews with industry experts, data from verified sources, and real-time market intelligence to ensure the accuracy and reliability of the insights presented.

FREQUENTLY ASKED QUESTIONS:

What is the current market size of Video Scoreboard Market?

-> Video Scoreboard Market size was valued at USD 569 million in 2025. The market is projected to grow from USD 591 million in 2026 to USD 740 million by 2034, exhibiting a CAGR of 3.9% during the forecast period.

Which key companies operate in Video Scoreboard Market?

-> Key players include Daktronics, Nevco, OES Scoreboards, Formetco Sports, FSL Scoreboards, Fair-Play, Bodet Sport, plainview led, Ultravision LED, and Watchfire Signs, LLC, among others.

What are the key growth drivers?

-> Key growth drivers include increasing demand for advanced sports infrastructure, rising popularity of live sports events, and technological advancements in display solutions.

Which region dominates the market?

-> North America is a dominant market, while Asia is expected to witness significant growth during the forecast period.

What are the emerging trends?

-> Emerging trends include high-resolution LED displays, integration with digital signage systems, and adoption in non-sports applications.

Video Scoreboard Market Technology Adoption, AI Integration and Industry Outlook (2026-2034)

Get Sample Report PDF for Exclusive Insights

Report Sample Includes

  • Table of Contents
  • List of Tables & Figures
  • Charts, Research Methodology, and more...
PDF Icon Download Sample Report PDF
SKU: a8dcf9095f57
Category:
License Type

Corporate License, Excel License, PDF and Excel Databook License

Download Sample Report

Table of Content

1 Introduction to Research & Analysis Reports
1.1 Video Scoreboard Market Definition
1.2 Market Segments
1.2.1 Segment by Type
1.2.2 Segment by Application
1.3 Global Video Scoreboard Market Overview
1.4 Features & Benefits of This Report
1.5 Methodology & Sources of Information
1.5.1 Research Methodology
1.5.2 Research Process
1.5.3 Base Year
1.5.4 Report Assumptions & Caveats
2 Global Video Scoreboard Overall Market Size
2.1 Global Video Scoreboard Market Size: 2025 VS 2034
2.2 Global Video Scoreboard Market Size, Prospects & Forecasts: 2021-2034
2.3 Global Video Scoreboard Sales: 2021-2034
3 Company Landscape
3.1 Top Video Scoreboard Players in Global Market
3.2 Top Global Video Scoreboard Companies Ranked by Revenue
3.3 Global Video Scoreboard Revenue by Companies
3.4 Global Video Scoreboard Sales by Companies
3.5 Global Video Scoreboard Price by Manufacturer (2021-2026)
3.6 Top 3 and Top 5 Video Scoreboard Companies in Global Market, by Revenue in 2025
3.7 Global Manufacturers Video Scoreboard Product Type
3.8 Tier 1, Tier 2, and Tier 3 Video Scoreboard Players in Global Market
3.8.1 List of Global Tier 1 Video Scoreboard Companies
3.8.2 List of Global Tier 2 and Tier 3 Video Scoreboard Companies
4 Sights by Type
4.1 Overview
4.1.1 Segment by Type – Global Video Scoreboard Market Size Markets, 2025 & 2034
4.1.2 Standard Scoreboards
4.1.3 Customized Scoreboards
4.2 Segment by Type – Global Video Scoreboard Revenue & Forecasts
4.2.1 Segment by Type – Global Video Scoreboard Revenue, 2021-2026
4.2.2 Segment by Type – Global Video Scoreboard Revenue, 2027-2034
4.2.3 Segment by Type – Global Video Scoreboard Revenue Market Share, 2021-2034
4.3 Segment by Type – Global Video Scoreboard Sales & Forecasts
4.3.1 Segment by Type – Global Video Scoreboard Sales, 2021-2026
4.3.2 Segment by Type – Global Video Scoreboard Sales, 2027-2034
4.3.3 Segment by Type – Global Video Scoreboard Sales Market Share, 2021-2034
4.4 Segment by Type – Global Video Scoreboard Price (Manufacturers Selling Prices), 2021-2034
5 Sights by Application
5.1 Overview
5.1.1 Segment by Application – Global Video Scoreboard Market Size, 2025 & 2034
5.1.2 Indoor Sports Venues
5.1.3 Outdoor Sports Venues
5.2 Segment by Application – Global Video Scoreboard Revenue & Forecasts
5.2.1 Segment by Application – Global Video Scoreboard Revenue, 2021-2026
5.2.2 Segment by Application – Global Video Scoreboard Revenue, 2027-2034
5.2.3 Segment by Application – Global Video Scoreboard Revenue Market Share, 2021-2034
5.3 Segment by Application – Global Video Scoreboard Sales & Forecasts
5.3.1 Segment by Application – Global Video Scoreboard Sales, 2021-2026
5.3.2 Segment by Application – Global Video Scoreboard Sales, 2027-2034
5.3.3 Segment by Application – Global Video Scoreboard Sales Market Share, 2021-2034
5.4 Segment by Application – Global Video Scoreboard Price (Manufacturers Selling Prices), 2021-2034
6 Sights Region
6.1 By Region – Global Video Scoreboard Market Size, 2025 & 2034
6.2 By Region – Global Video Scoreboard Revenue & Forecasts
6.2.1 By Region – Global Video Scoreboard Revenue, 2021-2026
6.2.2 By Region – Global Video Scoreboard Revenue, 2027-2034
6.2.3 By Region – Global Video Scoreboard Revenue Market Share, 2021-2034
6.3 By Region – Global Video Scoreboard Sales & Forecasts
6.3.1 By Region – Global Video Scoreboard Sales, 2021-2026
6.3.2 By Region – Global Video Scoreboard Sales, 2027-2034
6.3.3 By Region – Global Video Scoreboard Sales Market Share, 2021-2034
6.4 North America
6.4.1 By Country – North America Video Scoreboard Revenue, 2021-2034
6.4.2 By Country – North America Video Scoreboard Sales, 2021-2034
6.4.3 United States Video Scoreboard Market Size, 2021-2034
6.4.4 Canada Video Scoreboard Market Size, 2021-2034
6.4.5 Mexico Video Scoreboard Market Size, 2021-2034
6.5 Europe
6.5.1 By Country – Europe Video Scoreboard Revenue, 2021-2034
6.5.2 By Country – Europe Video Scoreboard Sales, 2021-2034
6.5.3 Germany Video Scoreboard Market Size, 2021-2034
6.5.4 France Video Scoreboard Market Size, 2021-2034
6.5.5 U.K. Video Scoreboard Market Size, 2021-2034
6.5.6 Italy Video Scoreboard Market Size, 2021-2034
6.5.7 Russia Video Scoreboard Market Size, 2021-2034
6.5.8 Nordic Countries Video Scoreboard Market Size, 2021-2034
6.5.9 Benelux Video Scoreboard Market Size, 2021-2034
6.6 Asia
6.6.1 By Region – Asia Video Scoreboard Revenue, 2021-2034
6.6.2 By Region – Asia Video Scoreboard Sales, 2021-2034
6.6.3 China Video Scoreboard Market Size, 2021-2034
6.6.4 Japan Video Scoreboard Market Size, 2021-2034
6.6.5 South Korea Video Scoreboard Market Size, 2021-2034
6.6.6 Southeast Asia Video Scoreboard Market Size, 2021-2034
6.6.7 India Video Scoreboard Market Size, 2021-2034
6.7 South America
6.7.1 By Country – South America Video Scoreboard Revenue, 2021-2034
6.7.2 By Country – South America Video Scoreboard Sales, 2021-2034
6.7.3 Brazil Video Scoreboard Market Size, 2021-2034
6.7.4 Argentina Video Scoreboard Market Size, 2021-2034
6.8 Middle East & Africa
6.8.1 By Country – Middle East & Africa Video Scoreboard Revenue, 2021-2034
6.8.2 By Country – Middle East & Africa Video Scoreboard Sales, 2021-2034
6.8.3 Turkey Video Scoreboard Market Size, 2021-2034
6.8.4 Israel Video Scoreboard Market Size, 2021-2034
6.8.5 Saudi Arabia Video Scoreboard Market Size, 2021-2034
6.8.6 UAE Video Scoreboard Market Size, 2021-2034
7 Manufacturers & Brands Profiles
7.1 Daktronics
7.1.1 Daktronics Company Summary
7.1.2 Daktronics Business Overview
7.1.3 Daktronics Video Scoreboard Major Product Offerings
7.1.4 Daktronics Video Scoreboard Sales and Revenue in Global (2021-2026)
7.1.5 Daktronics Key News & Latest Developments
7.2 Nevco
7.2.1 Nevco Company Summary
7.2.2 Nevco Business Overview
7.2.3 Nevco Video Scoreboard Major Product Offerings
7.2.4 Nevco Video Scoreboard Sales and Revenue in Global (2021-2026)
7.2.5 Nevco Key News & Latest Developments
7.3 OES Scoreboards
7.3.1 OES Scoreboards Company Summary
7.3.2 OES Scoreboards Business Overview
7.3.3 OES Scoreboards Video Scoreboard Major Product Offerings
7.3.4 OES Scoreboards Video Scoreboard Sales and Revenue in Global (2021-2026)
7.3.5 OES Scoreboards Key News & Latest Developments
7.4 Formetco Sports
7.4.1 Formetco Sports Company Summary
7.4.2 Formetco Sports Business Overview
7.4.3 Formetco Sports Video Scoreboard Major Product Offerings
7.4.4 Formetco Sports Video Scoreboard Sales and Revenue in Global (2021-2026)
7.4.5 Formetco Sports Key News & Latest Developments
7.5 FSL Scoreboards
7.5.1 FSL Scoreboards Company Summary
7.5.2 FSL Scoreboards Business Overview
7.5.3 FSL Scoreboards Video Scoreboard Major Product Offerings
7.5.4 FSL Scoreboards Video Scoreboard Sales and Revenue in Global (2021-2026)
7.5.5 FSL Scoreboards Key News & Latest Developments
7.6 Fair-Play
7.6.1 Fair-Play Company Summary
7.6.2 Fair-Play Business Overview
7.6.3 Fair-Play Video Scoreboard Major Product Offerings
7.6.4 Fair-Play Video Scoreboard Sales and Revenue in Global (2021-2026)
7.6.5 Fair-Play Key News & Latest Developments
7.7 Bodet Sport
7.7.1 Bodet Sport Company Summary
7.7.2 Bodet Sport Business Overview
7.7.3 Bodet Sport Video Scoreboard Major Product Offerings
7.7.4 Bodet Sport Video Scoreboard Sales and Revenue in Global (2021-2026)
7.7.5 Bodet Sport Key News & Latest Developments
7.8 plainview led
7.8.1 plainview led Company Summary
7.8.2 plainview led Business Overview
7.8.3 plainview led Video Scoreboard Major Product Offerings
7.8.4 plainview led Video Scoreboard Sales and Revenue in Global (2021-2026)
7.8.5 plainview led Key News & Latest Developments
7.9 Ultravision LED
7.9.1 Ultravision LED Company Summary
7.9.2 Ultravision LED Business Overview
7.9.3 Ultravision LED Video Scoreboard Major Product Offerings
7.9.4 Ultravision LED Video Scoreboard Sales and Revenue in Global (2021-2026)
7.9.5 Ultravision LED Key News & Latest Developments
7.10 Watchfire Signs, LLC
7.10.1 Watchfire Signs, LLC Company Summary
7.10.2 Watchfire Signs, LLC Business Overview
7.10.3 Watchfire Signs, LLC Video Scoreboard Major Product Offerings
7.10.4 Watchfire Signs, LLC Video Scoreboard Sales and Revenue in Global (2021-2026)
7.10.5 Watchfire Signs, LLC Key News & Latest Developments
7.11 VCRNOW
7.11.1 VCRNOW Company Summary
7.11.2 VCRNOW Business Overview
7.11.3 VCRNOW Video Scoreboard Major Product Offerings
7.11.4 VCRNOW Video Scoreboard Sales and Revenue in Global (2021-2026)
7.11.5 VCRNOW Key News & Latest Developments
7.12 All American Scoreboards
7.12.1 All American Scoreboards Company Summary
7.12.2 All American Scoreboards Business Overview
7.12.3 All American Scoreboards Video Scoreboard Major Product Offerings
7.12.4 All American Scoreboards Video Scoreboard Sales and Revenue in Global (2021-2026)
7.12.5 All American Scoreboards Key News & Latest Developments
8 Global Video Scoreboard Production Capacity, Analysis
8.1 Global Video Scoreboard Production Capacity, 2021-2034
8.2 Video Scoreboard Production Capacity of Key Manufacturers in Global Market
8.3 Global Video Scoreboard Production by Region
9 Key Market Trends, Opportunity, Drivers and Restraints
9.1 Market Opportunities & Trends
9.2 Market Drivers
9.3 Market Restraints
10 Video Scoreboard Supply Chain Analysis
10.1 Video Scoreboard Industry Value Chain
10.2 Video Scoreboard Upstream Market
10.3 Video Scoreboard Downstream and Clients
10.4 Marketing Channels Analysis
10.4.1 Marketing Channels
10.4.2 Video Scoreboard Distributors and Sales Agents in Global
11 Conclusion
12 Appendix
12.1 Note
12.2 Examples of Clients
12.3 DisclaimerList of Tables
Table 1. Key Players of Video Scoreboard in Global Market
Table 2. Top Video Scoreboard Players in Global Market, Ranking by Revenue (2025)
Table 3. Global Video Scoreboard Revenue by Companies, (US$, Mn), 2021-2026
Table 4. Global Video Scoreboard Revenue Share by Companies, 2021-2026
Table 5. Global Video Scoreboard Sales by Companies, (Units), 2021-2026
Table 6. Global Video Scoreboard Sales Share by Companies, 2021-2026
Table 7. Key Manufacturers Video Scoreboard Price (2021-2026) & (US$/Unit)
Table 8. Global Manufacturers Video Scoreboard Product Type
Table 9. List of Global Tier 1 Video Scoreboard Companies, Revenue (US$, Mn) in 2025 and Market Share
Table 10. List of Global Tier 2 and Tier 3 Video Scoreboard Companies, Revenue (US$, Mn) in 2025 and Market Share
Table 11. Segment by Type – Global Video Scoreboard Revenue, (US$, Mn), 2025 & 2034
Table 12. Segment by Type – Global Video Scoreboard Revenue (US$, Mn), 2021-2026
Table 13. Segment by Type – Global Video Scoreboard Revenue (US$, Mn), 2027-2034
Table 14. Segment by Type – Global Video Scoreboard Sales (Units), 2021-2026
Table 15. Segment by Type – Global Video Scoreboard Sales (Units), 2027-2034
Table 16. Segment by Application – Global Video Scoreboard Revenue, (US$, Mn), 2025 & 2034
Table 17. Segment by Application – Global Video Scoreboard Revenue, (US$, Mn), 2021-2026
Table 18. Segment by Application – Global Video Scoreboard Revenue, (US$, Mn), 2027-2034
Table 19. Segment by Application – Global Video Scoreboard Sales, (Units), 2021-2026
Table 20. Segment by Application – Global Video Scoreboard Sales, (Units), 2027-2034
Table 21. By Region – Global Video Scoreboard Revenue, (US$, Mn), 2025 & 2034
Table 22. By Region – Global Video Scoreboard Revenue, (US$, Mn), 2021-2026
Table 23. By Region – Global Video Scoreboard Revenue, (US$, Mn), 2027-2034
Table 24. By Region – Global Video Scoreboard Sales, (Units), 2021-2026
Table 25. By Region – Global Video Scoreboard Sales, (Units), 2027-2034
Table 26. By Country – North America Video Scoreboard Revenue, (US$, Mn), 2021-2026
Table 27. By Country – North America Video Scoreboard Revenue, (US$, Mn), 2027-2034
Table 28. By Country – North America Video Scoreboard Sales, (Units), 2021-2026
Table 29. By Country – North America Video Scoreboard Sales, (Units), 2027-2034
Table 30. By Country – Europe Video Scoreboard Revenue, (US$, Mn), 2021-2026
Table 31. By Country – Europe Video Scoreboard Revenue, (US$, Mn), 2027-2034
Table 32. By Country – Europe Video Scoreboard Sales, (Units), 2021-2026
Table 33. By Country – Europe Video Scoreboard Sales, (Units), 2027-2034
Table 34. By Region – Asia Video Scoreboard Revenue, (US$, Mn), 2021-2026
Table 35. By Region – Asia Video Scoreboard Revenue, (US$, Mn), 2027-2034
Table 36. By Region – Asia Video Scoreboard Sales, (Units), 2021-2026
Table 37. By Region – Asia Video Scoreboard Sales, (Units), 2027-2034
Table 38. By Country – South America Video Scoreboard Revenue, (US$, Mn), 2021-2026
Table 39. By Country – South America Video Scoreboard Revenue, (US$, Mn), 2027-2034
Table 40. By Country – South America Video Scoreboard Sales, (Units), 2021-2026
Table 41. By Country – South America Video Scoreboard Sales, (Units), 2027-2034
Table 42. By Country – Middle East & Africa Video Scoreboard Revenue, (US$, Mn), 2021-2026
Table 43. By Country – Middle East & Africa Video Scoreboard Revenue, (US$, Mn), 2027-2034
Table 44. By Country – Middle East & Africa Video Scoreboard Sales, (Units), 2021-2026
Table 45. By Country – Middle East & Africa Video Scoreboard Sales, (Units), 2027-2034
Table 46. Daktronics Company Summary
Table 47. Daktronics Video Scoreboard Product Offerings
Table 48. Daktronics Video Scoreboard Sales (Units), Revenue (US$, Mn) and Average Price (US$/Unit) & (2021-2026)
Table 49. Daktronics Key News & Latest Developments
Table 50. Nevco Company Summary
Table 51. Nevco Video Scoreboard Product Offerings
Table 52. Nevco Video Scoreboard Sales (Units), Revenue (US$, Mn) and Average Price (US$/Unit) & (2021-2026)
Table 53. Nevco Key News & Latest Developments
Table 54. OES Scoreboards Company Summary
Table 55. OES Scoreboards Video Scoreboard Product Offerings
Table 56. OES Scoreboards Video Scoreboard Sales (Units), Revenue (US$, Mn) and Average Price (US$/Unit) & (2021-2026)
Table 57. OES Scoreboards Key News & Latest Developments
Table 58. Formetco Sports Company Summary
Table 59. Formetco Sports Video Scoreboard Product Offerings
Table 60. Formetco Sports Video Scoreboard Sales (Units), Revenue (US$, Mn) and Average Price (US$/Unit) & (2021-2026)
Table 61. Formetco Sports Key News & Latest Developments
Table 62. FSL Scoreboards Company Summary
Table 63. FSL Scoreboards Video Scoreboard Product Offerings
Table 64. FSL Scoreboards Video Scoreboard Sales (Units), Revenue (US$, Mn) and Average Price (US$/Unit) & (2021-2026)
Table 65. FSL Scoreboards Key News & Latest Developments
Table 66. Fair-Play Company Summary
Table 67. Fair-Play Video Scoreboard Product Offerings
Table 68. Fair-Play Video Scoreboard Sales (Units), Revenue (US$, Mn) and Average Price (US$/Unit) & (2021-2026)
Table 69. Fair-Play Key News & Latest Developments
Table 70. Bodet Sport Company Summary
Table 71. Bodet Sport Video Scoreboard Product Offerings
Table 72. Bodet Sport Video Scoreboard Sales (Units), Revenue (US$, Mn) and Average Price (US$/Unit) & (2021-2026)
Table 73. Bodet Sport Key News & Latest Developments
Table 74. plainview led Company Summary
Table 75. plainview led Video Scoreboard Product Offerings
Table 76. plainview led Video Scoreboard Sales (Units), Revenue (US$, Mn) and Average Price (US$/Unit) & (2021-2026)
Table 77. plainview led Key News & Latest Developments
Table 78. Ultravision LED Company Summary
Table 79. Ultravision LED Video Scoreboard Product Offerings
Table 80. Ultravision LED Video Scoreboard Sales (Units), Revenue (US$, Mn) and Average Price (US$/Unit) & (2021-2026)
Table 81. Ultravision LED Key News & Latest Developments
Table 82. Watchfire Signs, LLC Company Summary
Table 83. Watchfire Signs, LLC Video Scoreboard Product Offerings
Table 84. Watchfire Signs, LLC Video Scoreboard Sales (Units), Revenue (US$, Mn) and Average Price (US$/Unit) & (2021-2026)
Table 85. Watchfire Signs, LLC Key News & Latest Developments
Table 86. VCRNOW Company Summary
Table 87. VCRNOW Video Scoreboard Product Offerings
Table 88. VCRNOW Video Scoreboard Sales (Units), Revenue (US$, Mn) and Average Price (US$/Unit) & (2021-2026)
Table 89. VCRNOW Key News & Latest Developments
Table 90. All American Scoreboards Company Summary
Table 91. All American Scoreboards Video Scoreboard Product Offerings
Table 92. All American Scoreboards Video Scoreboard Sales (Units), Revenue (US$, Mn) and Average Price (US$/Unit) & (2021-2026)
Table 93. All American Scoreboards Key News & Latest Developments
Table 94. Video Scoreboard Capacity of Key Manufacturers in Global Market, 2024-2026 (Units)
Table 95. Global Video Scoreboard Capacity Market Share of Key Manufacturers, 2024-2026
Table 96. Global Video Scoreboard Production by Region, 2021-2026 (Units)
Table 97. Global Video Scoreboard Production by Region, 2027-2034 (Units)
Table 98. Video Scoreboard Market Opportunities & Trends in Global Market
Table 99. Video Scoreboard Market Drivers in Global Market
Table 100. Video Scoreboard Market Restraints in Global Market
Table 101. Video Scoreboard Raw Materials
Table 102. Video Scoreboard Raw Materials Suppliers in Global Market
Table 103. Typical Video Scoreboard Downstream
Table 104. Video Scoreboard Downstream Clients in Global Market
Table 105. Video Scoreboard Distributors and Sales Agents in Global Market

List of Figures
Figure 1. Video Scoreboard Product Picture
Figure 2. Video Scoreboard Segment by Type in 2025
Figure 3. Video Scoreboard Segment by Application in 2025
Figure 4. Global Video Scoreboard Market Overview: 2025
Figure 5. Key Caveats
Figure 6. Global Video Scoreboard Market Size: 2025 VS 2034 (US$, Mn)
Figure 7. Global Video Scoreboard Revenue: 2021-2034 (US$, Mn)
Figure 8. Video Scoreboard Sales in Global Market: 2021-2034 (Units)
Figure 9. The Top 3 and 5 Players Market Share by Video Scoreboard Revenue in 2025
Figure 10. Segment by Type – Global Video Scoreboard Revenue, (US$, Mn), 2025 & 2034
Figure 11. Segment by Type – Global Video Scoreboard Revenue Market Share, 2021-2034
Figure 12. Segment by Type – Global Video Scoreboard Sales Market Share, 2021-2034
Figure 13. Segment by Type – Global Video Scoreboard Price (US$/Unit), 2021-2034
Figure 14. Segment by Application – Global Video Scoreboard Revenue, (US$, Mn), 2025 & 2034
Figure 15. Segment by Application – Global Video Scoreboard Revenue Market Share, 2021-2034
Figure 16. Segment by Application – Global Video Scoreboard Sales Market Share, 2021-2034
Figure 17. Segment by Application -Global Video Scoreboard Price (US$/Unit), 2021-2034
Figure 18. By Region – Global Video Scoreboard Revenue, (US$, Mn), 2025 & 2034
Figure 19. By Region – Global Video Scoreboard Revenue Market Share, 2021 VS 2025 VS 2034
Figure 20. By Region – Global Video Scoreboard Revenue Market Share, 2021-2034
Figure 21. By Region – Global Video Scoreboard Sales Market Share, 2021-2034
Figure 22. By Country – North America Video Scoreboard Revenue Market Share, 2021-2034
Figure 23. By Country – North America Video Scoreboard Sales Market Share, 2021-2034
Figure 24. United States Video Scoreboard Revenue, (US$, Mn), 2021-2034
Figure 25. Canada Video Scoreboard Revenue, (US$, Mn), 2021-2034
Figure 26. Mexico Video Scoreboard Revenue, (US$, Mn), 2021-2034
Figure 27. By Country – Europe Video Scoreboard Revenue Market Share, 2021-2034
Figure 28. By Country – Europe Video Scoreboard Sales Market Share, 2021-2034
Figure 29. Germany Video Scoreboard Revenue, (US$, Mn), 2021-2034
Figure 30. France Video Scoreboard Revenue, (US$, Mn), 2021-2034
Figure 31. U.K. Video Scoreboard Revenue, (US$, Mn), 2021-2034
Figure 32. Italy Video Scoreboard Revenue, (US$, Mn), 2021-2034
Figure 33. Russia Video Scoreboard Revenue, (US$, Mn), 2021-2034
Figure 34. Nordic Countries Video Scoreboard Revenue, (US$, Mn), 2021-2034
Figure 35. Benelux Video Scoreboard Revenue, (US$, Mn), 2021-2034
Figure 36. By Region – Asia Video Scoreboard Revenue Market Share, 2021-2034
Figure 37. By Region – Asia Video Scoreboard Sales Market Share, 2021-2034
Figure 38. China Video Scoreboard Revenue, (US$, Mn), 2021-2034
Figure 39. Japan Video Scoreboard Revenue, (US$, Mn), 2021-2034
Figure 40. South Korea Video Scoreboard Revenue, (US$, Mn), 2021-2034
Figure 41. Southeast Asia Video Scoreboard Revenue, (US$, Mn), 2021-2034
Figure 42. India Video Scoreboard Revenue, (US$, Mn), 2021-2034
Figure 43. By Country – South America Video Scoreboard Revenue Market Share, 2021-2034
Figure 44. By Country – South America Video Scoreboard Sales, Market Share, 2021-2034
Figure 45. Brazil Video Scoreboard Revenue, (US$, Mn), 2021-2034
Figure 46. Argentina Video Scoreboard Revenue, (US$, Mn), 2021-2034
Figure 47. By Country – Middle East & Africa Video Scoreboard Revenue, Market Share, 2021-2034
Figure 48. By Country – Middle East & Africa Video Scoreboard Sales, Market Share, 2021-2034
Figure 49. Turkey Video Scoreboard Revenue, (US$, Mn), 2021-2034
Figure 50. Israel Video Scoreboard Revenue, (US$, Mn), 2021-2034
Figure 51. Saudi Arabia Video Scoreboard Revenue, (US$, Mn), 2021-2034
Figure 52. UAE Video Scoreboard Revenue, (US$, Mn), 2021-2034
Figure 53. Global Video Scoreboard Production Capacity (Units), 2021-2034
Figure 54. The Percentage of Production Video Scoreboard by Region, 2025 VS 2034
Figure 55. Video Scoreboard Industry Value Chain
Figure 56. Marketing Channels