
Key Statistics
Key Takeaways
- Gauge pressure sensors hold the largest revenue share in 2025, because gauge measurement referenced to ambient air is the default requirement across HVAC, appliance, industrial instrumentation and medical fluid handling – the four highest-volume destinations for uncompensated sensing elements.
- Differential pressure sensors are the fastest-growing type, driven by filter-clogging detection, airflow measurement in ventilation systems and flow sensing in respiratory and dialysis equipment, where a high-accuracy differential element paired with the OEM’s own calibration outperforms a packaged compensated module on cost.
- Piezoresistive silicon remains the dominant sensing technology and is structurally inseparable from this market, since the uncompensated category exists precisely because a bare piezoresistive bridge is cheap to produce and its temperature error is predictable enough for the customer to correct in firmware.
- Industrial is the largest application and medical the fastest-growing, both for the same commercial reason: OEMs in these sectors already own calibration and test capability, so they capture the cost saving of buying an uncompensated element rather than paying for factory compensation they would repeat anyway.
- Asia-Pacific leads and grows fastest. The region produced 59.2 million motor vehicles in 2025 – 61% of global output – and hosts the appliance, HVAC and consumer electronics assembly base that consumes uncompensated elements in the highest volumes.
- Growth is deliberately modest and the reason is structural. This is a mature, price-eroding category under continuous substitution pressure from integrated digital sensors; TE Connectivity’s sensors business within Transportation Solutions declined 8% organically in fiscal 2025, a USD 79 million reduction, illustrating how exposed discrete sensing revenue is to both cycle and substitution.
Uncompensated Pressure Sensor Market Overview
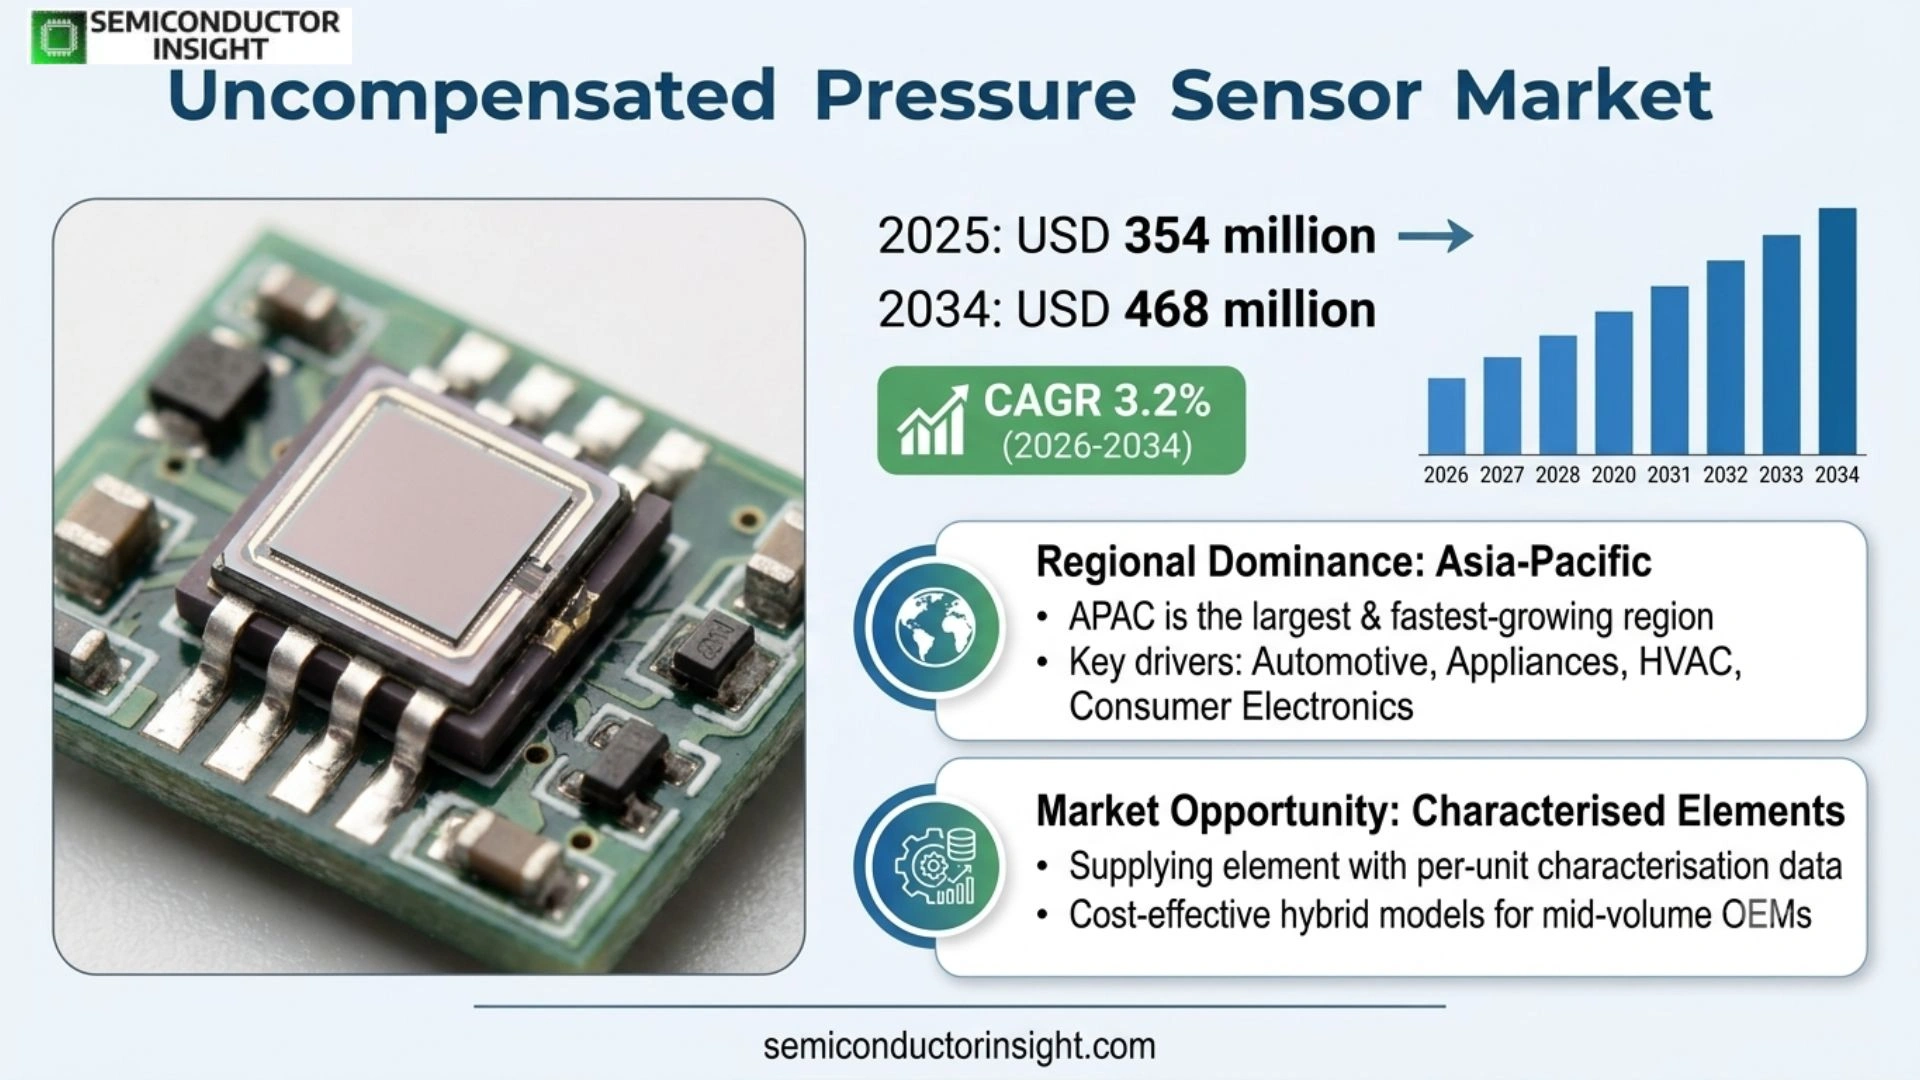
The global uncompensated pressure sensor market was valued at USD 354 million in 2025 and is projected to reach USD 468 million by 2034, expanding at a CAGR of 3.2% across the 2026–2034 forecast period. Asia-Pacific held the largest revenue share in 2025 and is also the fastest-growing region, reflecting its concentration of automotive, appliance, HVAC and consumer electronics assembly.
An uncompensated pressure sensor is a sensing element supplied without on-chip signal conditioning, amplification or temperature compensation. It outputs a small, raw differential voltage from a Wheatstone bridge whose resistance changes as a diaphragm deflects under applied pressure. Because that output varies with temperature and carries device-to-device offset and span error, the customer must characterise and correct it – which is exactly why the part is cheaper than a compensated or fully digital equivalent.
The category therefore sells to a specific kind of buyer rather than to the market at large. An OEM that already operates end-of-line calibration, holds a microcontroller in the product with spare compute, and builds enough volume to amortise the characterisation effort will nearly always find the uncompensated element the lower-cost route. An OEM without those capabilities pays for factory compensation instead. Understanding that division is more useful to a supplier than any growth rate, because it defines the addressable customer set.
Scope covers bare and packaged sensing elements – piezoresistive silicon dies, ceramic and metal-diaphragm elements, and port-mounted assemblies – delivered without compensation circuitry, across gauge, differential and absolute measurement references. Fully signal-conditioned analogue-output sensors, digital I2C and SPI sensors with integrated compensation, and complete pressure transmitters sit outside the definition, even though they frequently contain the same sensing die at their core.
The market’s macro backdrop in 2025 was unusually divergent. Global semiconductor sales reached USD 791.7 billion, up 25.6% on 2024, but that growth was overwhelmingly concentrated in logic at USD 301.9 billion, up 39.9%, and memory at USD 223.1 billion, up 34.8% – the AI-driven categories. Sensing components saw none of that lift, which is why a record year for semiconductors overall coincided with flat or declining revenue at several major sensor suppliers.
Demand is ultimately tied to unit production of the equipment these elements sit inside, and that base grew moderately. World motor vehicle production reached 96.4 million units in 2025, up 3.9% from 92.7 million in 2024, while North American robot orders rose 6.6% to 36,766 units worth USD 2.25 billion. Those are the growth rates this market realistically tracks – mid-single-digit unit expansion in the equipment that consumes sensing elements, not the semiconductor headline.
Segment Analysis: By Type
By measurement reference, the uncompensated pressure sensor market is segmented into gauge, differential and absolute sensors plus other configurations, with gauge and differential each subdivided by output format and accuracy class. Gauge sensors held the largest revenue share in 2025, while differential sensors – particularly the high-accuracy class – are the fastest-growing type on the strength of airflow, filter monitoring and respiratory applications.
| Type | Function | Market position |
|---|---|---|
| Gauge Pressure Sensor Digital output · Analog output |
Measures pressure relative to local atmospheric pressure through a vented reference port, so the reading tracks ambient changes automatically | Largest share in 2025. The default reference for HVAC duct and refrigerant monitoring, appliance water level sensing, industrial process instrumentation and medical fluid handling. The analogue-output sub-type dominates unit volume because a raw bridge output is what the uncompensated category is; digital-output variants at this tier carry an ADC without the compensation coefficients, which suits customers who want a serial interface but intend to calibrate themselves. Pricing is the most competitive in the category and erodes steadily. |
| Differential Pressure Sensor High accuracy · Standard |
Measures the difference between two independent pressure ports, resolving small deltas across a restriction, filter or flow element | Fastest-growing type. The high-accuracy class is where growth concentrates: respiratory and dialysis equipment, ventilation airflow measurement, filter-clogging detection in HVAC and industrial plant, and cleanroom differential monitoring. These applications need resolution in the tens of pascals, which is achievable from an uncompensated element only when the customer characterises each unit – a workflow medical and instrumentation OEMs already run, and which they will not pay a supplier to duplicate. |
| Absolute Pressure Sensor | Measures against a sealed vacuum reference, giving a reading independent of local atmospheric conditions | A smaller but technically demanding segment serving barometric altitude sensing, manifold absolute pressure measurement, vacuum process monitoring and weather instrumentation. The sealed reference cavity raises manufacturing complexity and yield sensitivity relative to gauge devices, which supports a modest price premium. Growth is steady rather than rapid, and the segment is the most exposed to displacement by integrated barometric sensors in consumer devices. |
| Others | Sealed-gauge, compound-range and application-specific element configurations, including media-isolated and high-temperature variants | Specification-led demand from harsh-media and extended-temperature applications where standard silicon elements cannot survive direct exposure. Volumes are modest and average selling prices the highest in the category, with purchasing decided by chemical compatibility, burst rating and temperature range rather than by unit cost. Design-in positions here are unusually durable because requalifying a media-isolated element is expensive. |
Sensing technology as a second segmentation axis
Underneath the measurement reference sit four transduction mechanisms, and their distribution is far more concentrated than the type segmentation suggests. Piezoresistive silicon dominates the uncompensated category almost by definition: the technology’s characteristic weakness – a strong, repeatable temperature coefficient – is precisely what the customer agrees to correct in exchange for a lower part price. Capacitive elements offer better stability and lower power but a less linear raw output, optical elements serve electromagnetically hostile environments, and resonant elements deliver the highest precision at the highest cost.
| Sensing technology | Characteristics | Position in the uncompensated segment |
|---|---|---|
| Piezoresistive | Silicon diaphragm with implanted or diffused resistors in a Wheatstone bridge; high sensitivity, strong and repeatable temperature dependence | The dominant technology. Mature high-volume MEMS processing keeps die cost low, and the predictability of its thermal error is what makes customer-side compensation viable. Essentially all high-volume uncompensated gauge and differential elements use this mechanism. |
| Capacitive | Deflecting diaphragm forms one plate of a variable capacitor; low power draw, good long-term stability, inherently non-linear raw output | The fastest-growing mechanism within the segment, favoured in battery-powered and low-drift applications. Adoption is limited by the fact that its raw output needs more sophisticated linearisation, which raises the customer’s characterisation burden and narrows the cost advantage. |
| Optical | Interferometric or intensity-based measurement of diaphragm deflection using fibre-coupled light | A specialist niche where electrical immunity is mandatory – MRI environments, high-voltage plant, and intrinsically safe installations in hazardous areas. Very low unit volumes and very high prices, with purchasing driven by environmental constraint rather than by cost comparison. |
| Resonant | Measures the shift in a vibrating structure’s resonant frequency under applied stress; excellent stability and hysteresis performance | The highest-precision option and the smallest by volume, used in metrology, calibration references and aerospace instrumentation. Rarely sold uncompensated in the conventional sense, since customers buying this level of precision generally require a characterised device. |
Pricing by type and technology
Average selling prices in this market are low in absolute terms and span roughly a factor of five between the highest-volume analogue gauge elements and media-isolated or high-accuracy differential parts. The commercially important dynamic is not the spread but its direction: standard gauge elements face continuous erosion from volume suppliers, while high-accuracy differential and media-isolated variants have held pricing far better, because the customer’s alternative is a substantially more expensive compensated module rather than a cheaper competing element.
Segment Analysis: By Application
By application, the market is segmented into industrial, medical, automotive, consumer electronics and other end uses. Industrial is the largest application by revenue, reflecting the breadth of process instrumentation and HVAC demand, while medical is the fastest-growing – in both cases because these OEMs already operate the calibration capability that makes buying an uncompensated element economically rational.
| Application | Demand characteristics |
|---|---|
| Industrial | The largest application. Process instrumentation, HVAC and building services, pneumatics, compressed air systems, filtration monitoring and hydraulic equipment. Demand correlates with capital equipment investment and with automation activity: North American robot orders reached 36,766 units worth USD 2.25 billion in 2025, up 6.6% in units and 10.1% in value, with general industries rather than automotive driving the increase. Industrial buyers value extended temperature range, media compatibility and long-term availability, and they typically hold design-in positions for a decade or more once a sensing element is qualified into an instrument platform. |
| Medical | Fastest-growing application. Ventilators and respiratory support, dialysis machines, infusion pumps, blood pressure monitoring and laboratory fluid handling. The purchasing logic is distinctive: because a medical device maker must characterise and validate its measurement chain end-to-end for regulatory submission regardless of what it buys, factory compensation is duplicated work. Buying uncompensated elements and calibrating in the finished device is both cheaper and cleaner from a validation standpoint, which structurally favours this category over integrated digital alternatives. |
| Automotive | Manifold absolute pressure, fuel system, brake and transmission pressure, HVAC refrigerant monitoring and tyre pressure monitoring. World vehicle production reached 96.4 million units in 2025, up 3.9%, with Asia-Pacific contributing 59.2 million units and China alone 34.53 million including 16.626 million new-energy vehicles, up 29%. The segment’s complication is that automotive increasingly demands qualified, compensated and diagnostics-capable sensors, so unit growth does not translate proportionally into uncompensated element demand – a tension visible in TE Connectivity’s 8% organic decline in sensors within Transportation Solutions in fiscal 2025. |
| Consumer Electronics | Small appliances, coffee machines, washing machines and dishwashers, air purifiers, wearable and portable devices. The most price-sensitive segment in the market, with purchasing decided almost entirely on landed cost and supply continuity. This is also the segment most exposed to displacement, since consumer product designers frequently prefer a fully integrated digital sensor that removes calibration from the production line altogether – a trade they will accept at low volumes even at a higher unit price. |
| Others | Aerospace ground equipment, agricultural machinery, marine systems, energy infrastructure and laboratory instrumentation. Individually modest but collectively meaningful, and characterised by long qualification cycles, extended availability requirements and a preference for media-isolated or high-temperature variants. Average selling prices are well above the category mean, and supplier switching is rare once a platform is qualified. |
Regional Analysis
Asia-Pacific holds the largest share of the uncompensated pressure sensor market in 2025 and is also its fastest-growing region. The region produced 59.2 million motor vehicles in 2025 – 61% of the world’s 96.4 million units – and hosts the appliance, HVAC and consumer electronics assembly base that consumes sensing elements in the highest volumes. North America and Europe follow, both weighted toward higher-value industrial and medical demand rather than volume consumer assembly.
How does regional demand differ across the uncompensated pressure sensor market?
The regions divide along a clear line: where equipment is assembled versus where it is specified. Asia-Pacific consumes the volume because that is where appliances, vehicles and consumer products are physically built, and its 2025 semiconductor sales grew 45.0% year-on-year, the fastest of any region. North America and Europe consume fewer units but at materially higher average prices, because their demand concentrates in medical, instrumentation and process applications where accuracy class and qualification evidence outrank unit cost.
| Region | Position | Growth outlook | Demand profile | What decides supplier selection |
|---|---|---|---|---|
| Asia-Pacific | Largest | Highest in market | Volume assembly led | Landed cost, supply continuity, local technical support and second-source availability |
| North America | Second largest | Moderate | Medical and industrial led | Accuracy class, documented lot traceability, long-term availability commitments |
| Europe | Third largest | Moderate, steady | Instrumentation and regulation led | RoHS and REACH conformity, process instrumentation approvals, supplier longevity |
| South America | Fourth | Moderate | Import dependent | Landed cost, distributor stocking depth, INMETRO conformity |
| Middle East & Africa | Smallest base | Emerging | Project and infrastructure led | Supply reliability, project delivery timing, regional distribution presence |
Key Uncompensated Pressure Sensor Manufacturers and Competitive Landscape
The market is moderately concentrated among diversified sensor and semiconductor manufacturers – NXP Semiconductors, TE Connectivity, Honeywell International, Bourns and Fujikura – with specialist element makers such as Merit Sensor Systems and regional cost competitors including Memsensing Microsystems occupying defined positions. Scale in MEMS fabrication and breadth of qualified part numbers are the principal sources of advantage.
Competition operates on three axes. The first is die cost, which is a function of MEMS wafer scale: suppliers running high-volume piezoresistive lines amortise process development across many part numbers and can price below entrants who cannot. The second is consistency – lot-to-lot repeatability of offset, span and temperature coefficient determines how cheaply the customer can characterise the part, so a supplier with tighter distributions effectively lowers the buyer’s total cost even at an identical unit price.
The third axis is portfolio breadth and lifecycle assurance. An instrument maker qualifying an element into a platform needs confidence that the part will remain available for the ten-to-fifteen-year life of the product, and that a range of pressure ranges and port configurations exists so that one supplier can serve a whole product family. This favours large diversified manufacturers and is the practical reason regional cost competitors struggle to displace incumbents in medical and industrial accounts even where they win on price.
The competitive context in 2025 was demanding. NXP reported full-year revenue of USD 12.27 billion, down 3%, with Automotive flat at USD 7.12 billion and Industrial & IoT flat at USD 2.27 billion, while TE Connectivity grew total sales 9% to USD 17.3 billion but saw sensors within Transportation Solutions decline 8% organically, a USD 79 million reduction. Those results describe a category where suppliers are growing elsewhere while discrete sensing revenue stagnates – the clearest available evidence of substitution pressure.
Tier structure
| Tier | Companies | Basis of competition |
|---|---|---|
| Tier 1 | NXP Semiconductors, TE Connectivity, Honeywell International | MEMS fabrication scale, breadth of qualified pressure ranges and packages, global distribution and documented long-term availability for regulated applications |
| Tier 2 | Bourns, Fujikura, Merit Sensor Systems | Specialist element expertise, tight parameter distributions that lower the customer’s calibration burden, and application depth in medical and industrial niches |
| Tier 3 | Memsensing Microsystems and other regional MEMS suppliers | Cost leadership on high-volume gauge elements, rapid local support in Asia-Pacific, and increasing qualification activity for export into Western distribution |
Key companies profiled
- NXP Semiconductors (Netherlands)
- TE Connectivity (Switzerland)
- Bourns, Inc. (U.S.)
- Fujikura Ltd. (Japan)
- Merit Sensor Systems (U.S.)
- Honeywell International Inc. (U.S.)
- Memsensing Microsystems (China)
Uncompensated Pressure Sensor Production Capacity Analysis
Production is concentrated in established MEMS foundries and captive fabs across the United States, Japan, Europe, China and Southeast Asia, with final packaging and test heavily weighted toward Asia. Wafer capacity has not constrained this market; the binding constraints are test and calibration throughput, and the economics of running mature-node MEMS lines in a semiconductor industry whose capital is flowing almost entirely toward AI-driven logic and memory.
An uncompensated element is produced on a mature MEMS process – bulk-micromachined silicon diaphragms with implanted piezoresistors, typically on 150 mm or 200 mm wafers – followed by die singulation, port or package attachment and electrical test. The process is well understood and the equipment fully depreciated at most established suppliers, which is precisely why die cost can be low enough to make the uncompensated business model work at all.
Test throughput, not wafer supply, sets practical capacity. Every element must be electrically verified across at least part of its pressure range, and parts sold with characterisation data require multi-point measurement at multiple temperatures – a slow, equipment-bound operation. Suppliers differentiate by how efficiently they run this step, since it is the largest controllable cost after silicon and directly determines how tight a parameter distribution they can economically guarantee.
The category faces a structural capital problem that is worth stating plainly. Global semiconductor sales grew 25.6% to USD 791.7 billion in 2025, but logic and memory accounted for USD 301.9 billion and USD 223.1 billion respectively and captured essentially all of the growth. Investment in mature-node MEMS capacity competes for attention against those returns, which means capacity additions in this category are incremental and demand-led rather than strategic.
Geographic concentration of packaging and test in Asia is an increasing procurement topic for medical and aerospace buyers, who ask for documented supply continuity and, in some programmes, regional final test. Supply-chain resilience requirements of this kind raise cost in a category with thin margins, and are one reason suppliers have consolidated part ranges rather than broadened them in recent years.
Uncompensated Pressure Sensor Market Dynamics: Drivers, Restraints and Opportunities
Growth is driven by medical device production, industrial automation investment, regulatory mandates that create compulsory measurement points, and the persistent cost advantage of customer-side calibration. The dominant restraint is substitution by integrated digital sensors, which remove calibration from the customer’s production line entirely and are falling in price faster than uncompensated elements can.
MARKET DRIVERS
Drivers Impact Analysis*
| Driver | (~) % impact on CAGR forecast | Geographic relevance | Impact timeline |
|---|---|---|---|
| Medical device production and respiratory equipment demand | +1.2% | North America, Europe, Japan | Medium term (2–4 years) |
| Industrial automation investment and robot installations | +0.9% | North America, Asia-Pacific, Europe | Medium term (2–4 years) |
| Regulatory mandates creating compulsory measurement points | +0.7% | India, EU, North America, China | Long term (≥ 4 years) |
| Building ventilation and filtration monitoring requirements | +0.6% | Europe, North America, developed Asia-Pacific | Medium term (2–4 years) |
| Vehicle production growth in Asia-Pacific | +0.5% | China, India, Southeast Asia | Short term (≤ 2 years) |
| Cost advantage of customer-side calibration at volume | +0.4% | Global, high-volume OEMs first | Long term (≥ 4 years) |
Medical device manufacture is the highest-quality demand in the category
Ventilators, dialysis machines, infusion pumps and blood pressure monitoring all require pressure measurement, and the medical device maker must validate its complete measurement chain for regulatory submission regardless of whether the component arrived compensated. Factory compensation is therefore duplicated effort that the buyer pays for twice. This argument is financial rather than technical, it does not weaken as integrated sensors get cheaper, and it is the single most durable driver this market has.
Automation investment adds measurement points faster than it adds machines
A3 reported North American robot orders of 36,766 units worth USD 2.25 billion in 2025, up 6.6% in units and 10.1% in value, with growth led by food and consumer goods, semiconductors and electronics, and life sciences rather than automotive. Collaborative robots alone accounted for 7,212 units worth USD 241 million. Vacuum gripper monitoring, pneumatic actuation and force feedback in these systems are pressure-sensing applications, and modern cells carry more of them per machine than earlier generations.
Regulation converts optional measurement into mandatory measurement
Tyre pressure monitoring requirements – FMVSS 138 in the United States, UN Regulation 141 in markets applying the UNECE framework, and AIS-154 in India – make a pressure measurement point compulsory rather than discretionary on vehicles that would otherwise omit it. In a market where world vehicle production reached 96.4 million units in 2025 and India alone built 6.49 million, regulatory mandates of this kind are the most reliable mechanism by which unit growth translates into sensing demand.
Building services requirements favour differential measurement specifically
Energy performance rules across Europe and North America increasingly require ventilation systems to demonstrate measured airflow and to monitor filter condition rather than to run on fixed schedules. Both are differential pressure applications, and both sit in equipment built by manufacturers who calibrate in house. This is the mechanism by which building regulation, which never mentions sensors, becomes the fastest-growing source of demand for high-accuracy differential elements.
MARKET RESTRAINTS
Restraints Impact Analysis*
| Restraint | (~) % impact on CAGR forecast | Geographic relevance | Impact timeline |
|---|---|---|---|
| Substitution by integrated digital sensors with on-chip compensation | -1.8% | Global, consumer and low-volume designs first | Medium term (2–4 years) |
| Price erosion in the standard gauge element tier | -1.1% | Asia-Pacific, consumer applications | Short term (≤ 2 years) |
| Customer calibration capability required to realise the cost advantage | -0.8% | South America, MEA, small OEMs globally | Long term (≥ 4 years) |
| Automotive qualification requirements favouring compensated devices | -0.6% | Europe, North America, Japan | Medium term (2–4 years) |
| Mature-node MEMS capacity competing for capital against AI-driven logic and memory | -0.3% | Global | Long term (≥ 4 years) |
Integrated digital sensors are the structural threat
A fully compensated I2C sensor removes characterisation, calibration equipment and firmware correction from the customer’s process entirely, and its price falls with each process generation. For any OEM below the volume threshold at which characterisation amortises, that trade is compelling. The uncompensated category is not disappearing – its cost advantage at genuine volume is real – but its addressable customer set narrows as integrated device prices decline, which is what caps growth at low single digits.
Discrete sensing revenue is visibly under pressure
TE Connectivity grew fiscal 2025 net sales 9% to USD 17.3 billion, with Industrial Solutions up 17.6% organically to USD 7.874 billion, yet sensors within Transportation Solutions fell 8% organically – a USD 79 million decline. NXP reported full-year revenue down 3% to USD 12.27 billion with Automotive flat at USD 7.12 billion. Suppliers are growing in connectivity, industrial and AI-adjacent products while discrete sensing stagnates, which is the clearest evidence available that the constraint is structural rather than cyclical.
The cost advantage requires capability the buyer may not have
Buying uncompensated is only cheaper if the customer can characterise, store coefficients and correct in firmware at acceptable cost. That requires end-of-line test capability, engineering resource and volume to amortise both. OEMs without those things pay more in total for a nominally cheaper part, which is why uncompensated penetration is far lower in South America, the Middle East and Africa, and among small manufacturers everywhere, than raw price comparisons would predict.
MARKET OPPORTUNITIES
Characterised uncompensated elements as a middle tier
Supplying an uncompensated element together with per-unit characterisation data – coefficients the customer loads into firmware without running their own multi-temperature test – captures most of the cost advantage while removing the capability barrier described above. This hybrid model expands the addressable customer set into mid-volume OEMs who currently default to compensated modules, and it is defensible because it depends on the supplier’s test infrastructure rather than on price alone.
Respiratory and dialysis equipment
Respiratory support and renal therapy equipment combine high-accuracy differential measurement, stringent validation requirements and manufacturers who already own calibration capability – the exact intersection where uncompensated elements win decisively. Installed-base growth in these categories across ageing populations in Europe, Japan and North America supports demand that is demographic rather than cyclical, and design-in positions persist for the full product life.
New-energy vehicle thermal management
China produced 16.626 million new-energy vehicles in 2025, up 29%. Battery-electric platforms eliminate manifold and fuel system measurement points but introduce battery pack, coolant loop and heat pump pressure monitoring. Suppliers positioned on the thermal management side of that transition can offset losses in legacy powertrain applications, though the transition redistributes demand rather than expanding it.
Southeast Asian manufacturing relocation
Appliance and electronics assembly moving from China into Vietnam, Thailand and Malaysia re-opens bills of materials that were settled years earlier. In a category where design-in positions normally persist for a decade, relocation is one of the few reliable mechanisms for displacing an incumbent, and suppliers with local technical support in those markets are positioned to capture designs that would be inaccessible in a stable manufacturing base.
Uncompensated Pressure Sensor Supply Chain Analysis
The value chain runs from silicon wafers and MEMS processing through die attach, packaging and electrical test to a channel split between direct OEM supply and broadline component distribution. Value concentrates in MEMS process know-how upstream and in design-in position downstream, while packaging and test in the middle is the most cost-exposed stage.
Upstream. Inputs are largely commoditised and multiply sourced. Silicon wafers at mature nodes, glass substrates for anodic bonding and standard packaging materials are widely available, and none constitutes a structural bottleneck. The exception is media-isolation fluids and specialty elastomers for harsh-media variants, where chemical compatibility qualification limits the supplier set and substitution requires requalifying the finished element with the customer.
Manufacturing. MEMS processing is the stage where genuine know-how sits – diaphragm thickness control, piezoresistor placement and bond quality determine sensitivity, linearity and the tightness of the parameter distribution the supplier can guarantee. Because customers compensate in firmware, a tight distribution is worth real money to them, and it is the one attribute in this category that cannot be replicated by a low-cost entrant simply by buying equipment.
Channel. High-volume OEMs buy direct under annual agreements negotiated on price and supply continuity, while broadline distributors serve mid-volume and prototype demand where technical support and small quantities matter more than unit cost. Contract manufacturers are an increasingly significant intermediary, and where the CM controls procurement the specification decision can be reopened at each production transfer – one of the few regular threats to an established design-in position.
Downstream. The specification decision is made once, during product design, and repeats for the production life of the equipment – a decade or more in medical and industrial applications. That makes design-in far more valuable than any individual order and explains why suppliers invest in application engineering with no immediate revenue attached. Switching costs are high because the customer’s calibration routine is tuned to a specific element’s behaviour, and changing supplier means recharacterising the whole measurement chain.
Recent Developments in the Uncompensated Pressure Sensor Market
- 23 April 2026 Market data
OICA reported world motor vehicle production of 96.4 million units in 2025, up 3.9% from 92.7 million in 2024. Asia-Pacific produced 59.2 million units, up 7.6% and equal to 61% of global output, while Europe fell 0.8% to 17.2 million and the Americas fell 2.1% to 18.74 million. China alone built 34.53 million vehicles including 16.626 million new-energy vehicles, up 29%. Vehicle output is the single largest unit driver of pressure sensing demand, and its regional distribution explains Asia-Pacific’s market leadership.
Source - 6 February 2026 Market data
SIA reported global semiconductor sales of USD 791.7 billion in 2025, up 25.6%, with Asia-Pacific growing 45.0%, the Americas 30.5%, China 17.3%, Europe 6.3% and Japan declining 4.7%. Logic reached USD 301.9 billion, up 39.9%, and memory USD 223.1 billion, up 34.8%. The concentration of growth in AI-driven categories is why a record semiconductor year did not lift discrete sensing revenue, and it frames the capital allocation problem facing mature-node MEMS capacity.
Source - 6 February 2026 Market data
A3 reported North American robot orders of 36,766 units valued at USD 2.25 billion in 2025, up 6.6% in units and 10.1% in value – a sixth consecutive quarter of year-on-year growth. Collaborative robots accounted for 7,212 units worth USD 241 million, or 19.6% of unit volume, rising to 28.6% of units in the fourth quarter. General industries outpaced automotive, shifting sensing demand toward food, life sciences and electronics equipment.
Source - 2 February 2026 Market data
NXP Semiconductors reported full-year 2025 revenue of USD 12.27 billion, down 3%, with Automotive flat at USD 7.12 billion and Industrial & IoT flat at USD 2.27 billion. Fourth-quarter revenue of USD 3.34 billion was up 7%, and first-quarter 2026 guidance implies 8–15% year-on-year growth. The flat performance in the two end markets that consume pressure sensing elements is a direct read on demand conditions in this category.
Source - 29 October 2025 Market data
TE Connectivity reported fiscal 2025 net sales of USD 17.3 billion, up 9%, but disclosed that sensors within Transportation Solutions declined 8% organically – a USD 79 million reduction. Industrial Solutions grew 17.6% organically to USD 7.874 billion while Transportation Solutions fell 1% organically to USD 9.388 billion. The divergence between a growing company and a declining discrete sensing line is the clearest public evidence of substitution pressure in this market.
Source - In force In force
Tyre pressure monitoring mandates continue to expand the compulsory measurement base. UN Regulation 141 establishes uniform provisions for tyre pressure monitoring systems across contracting parties to the UNECE framework, complementing FMVSS 138 in the United States and AIS-154 in India. Regulations of this type convert a discretionary feature into a mandatory measurement point, which is the most durable form of demand creation available to this category.
Source
REPORT SCOPE & SEGMENTATION
| Attribute | Details |
|---|---|
| Study Period | 2021–2034 |
| Base Year | 2025 |
| Estimated Year | 2026 |
| Forecast Period | 2026–2034 |
| Historical Period | 2021–2025 |
| Market Size 2025 | USD 354 Million |
| Market Size 2034 | USD 468 Million |
| Growth Rate | CAGR of 3.2% from 2026–2034 |
| Unit | Value (USD Million) and Volume (Million Units) |
| Segmentation | By Type, By Sensing Technology, By Application, and By Region |
| By Type | Gauge Pressure Sensor (Digital Output, Analog Output) · Differential Pressure Sensor (High Accuracy, Standard) · Absolute Pressure Sensor · Others |
| By Sensing Technology | Piezoresistive · Capacitive · Optical · Resonant |
| By Application | Consumer Electronics · Medical · Industrial · Automotive · Others |
| By Region | Each region analysed by Type, Application and Country Asia-PacificChina, Japan, India, South Korea, Southeast Asia North AmericaU.S., Canada, Mexico EuropeGermany, France, Italy, U.K., Nordic Countries, Benelux, Rest of Europe South AmericaBrazil, Argentina, Chile, Colombia, Rest of South America Middle East & AfricaSaudi Arabia, UAE, Türkiye, South Africa, Egypt, Rest of MEA |
| Key Companies Profiled | NXP Semiconductors, TE Connectivity, Bourns Inc., Fujikura Ltd., Merit Sensor Systems, Honeywell International Inc., Memsensing Microsystems |
| Customization Scope | Free report customization (equivalent to up to 4 analyst working days) with purchase. Addition or alteration to country, regional and segment scope. |
Frequently Asked Questions
What is the current size of the uncompensated pressure sensor market?
The global uncompensated pressure sensor market was valued at USD 354 million in 2025 and is projected to reach USD 468 million by 2034, expanding at a CAGR of 3.2% across the 2026–2034 forecast period. The base year is 2025, the historical period runs from 2021, and values are reported in US dollars with volumes in million units. Growth is modest because the category is mature and faces continuous substitution from integrated digital sensors.
What is an uncompensated pressure sensor?
An uncompensated pressure sensor is a sensing element supplied without on-chip signal conditioning, amplification or temperature compensation. It outputs a small raw voltage from a Wheatstone bridge whose resistance changes as a diaphragm deflects under pressure. Because that output varies with temperature and carries device-to-device offset and span error, the customer characterises and corrects it in firmware – which is why the part costs less than a compensated or fully digital equivalent.
Which region leads the uncompensated pressure sensor market?
Asia-Pacific held the largest revenue share in 2025 and is also the fastest-growing region. The region produced 59.2 million motor vehicles in 2025, equal to 61% of global output, and its semiconductor sales grew 45.0% year-on-year – the fastest of any region. It also hosts the appliance, HVAC and consumer electronics assembly base that consumes uncompensated sensing elements in the highest volumes.
What are the main types of uncompensated pressure sensor?
By measurement reference the market covers gauge sensors, which measure relative to atmospheric pressure through a vented port; differential sensors, which measure the difference between two ports; absolute sensors, which measure against a sealed vacuum reference; and other configurations including sealed-gauge and media-isolated variants. Gauge sensors hold the largest revenue share and differential sensors are growing fastest.
Which sensing technology dominates the uncompensated segment?
Piezoresistive silicon dominates and is structurally inseparable from the category. The technology’s characteristic weakness – a strong but highly repeatable temperature coefficient – is exactly what the customer agrees to correct in firmware in exchange for a lower part price. Capacitive elements are growing fastest within the segment on low power draw and stability, while optical and resonant technologies serve specialist niches.
Which applications drive uncompensated pressure sensor demand?
Industrial is the largest application, covering process instrumentation, HVAC, pneumatics and filtration monitoring, while medical is the fastest-growing, spanning ventilators, dialysis machines and infusion pumps. Both lead for the same reason: these OEMs already operate calibration and validation capability, so paying for factory compensation duplicates work they must perform anyway for their own product qualification.
Who are the key companies in the uncompensated pressure sensor market?
The market is led by NXP Semiconductors, TE Connectivity and Honeywell International on MEMS fabrication scale and portfolio breadth, followed by Bourns, Fujikura and Merit Sensor Systems competing on specialist element expertise and tight parameter distributions. Memsensing Microsystems and other regional MEMS suppliers compete on cost in Asia-Pacific and are increasingly qualifying for export into Western distribution.
What are the key growth drivers for the uncompensated pressure sensor market?
The principal drivers are medical device production, particularly respiratory and renal therapy equipment; industrial automation investment, with North American robot orders reaching 36,766 units worth USD 2.25 billion in 2025; regulatory mandates such as FMVSS 138, UN Regulation 141 and India’s AIS-154 that make pressure measurement compulsory; and building ventilation rules that favour differential measurement specifically.
What are the main restraints on the uncompensated pressure sensor market?
The dominant restraint is substitution by integrated digital sensors that remove calibration from the customer’s production line entirely and fall in price with each process generation. Price erosion in the standard gauge tier, the calibration capability customers need to realise the cost advantage at all, and automotive qualification requirements favouring compensated devices compound the pressure – visible in TE Connectivity’s 8% organic sensors decline in fiscal 2025.
What is the outlook for the uncompensated pressure sensor market through 2034?
The market is projected to grow from USD 354 million in 2025 to USD 468 million by 2034 at a 3.2% CAGR. The category will not be displaced, because its cost advantage at genuine volume is real, but its addressable customer set narrows as integrated sensor prices fall. Growth will concentrate in medical and high-accuracy differential applications, with Asia-Pacific continuing to lead on assembly volume.

Get Sample Report PDF for Exclusive Insights
Report Sample Includes
- Table of Contents
- List of Tables & Figures
- Charts, Research Methodology, and more...


