Touch Screen Module Market, Size, Trends, Business Strategies 2026-2033

Touch Screen Module Market size was valued at USD 29,740 million in 2025. The market is projected to grow from USD 30,890 million in 2026 to USD 37,400 million by 2033, exhibiting a CAGR of 3.4% during the forecast period.

PDF Icon Download Sample Report PDF
  • Quick Dispatch

    All Orders

  • Secure Payment

    100% Secure Payment

Price range: $1,500.00 through $4,250.00

Clear

Market Insights

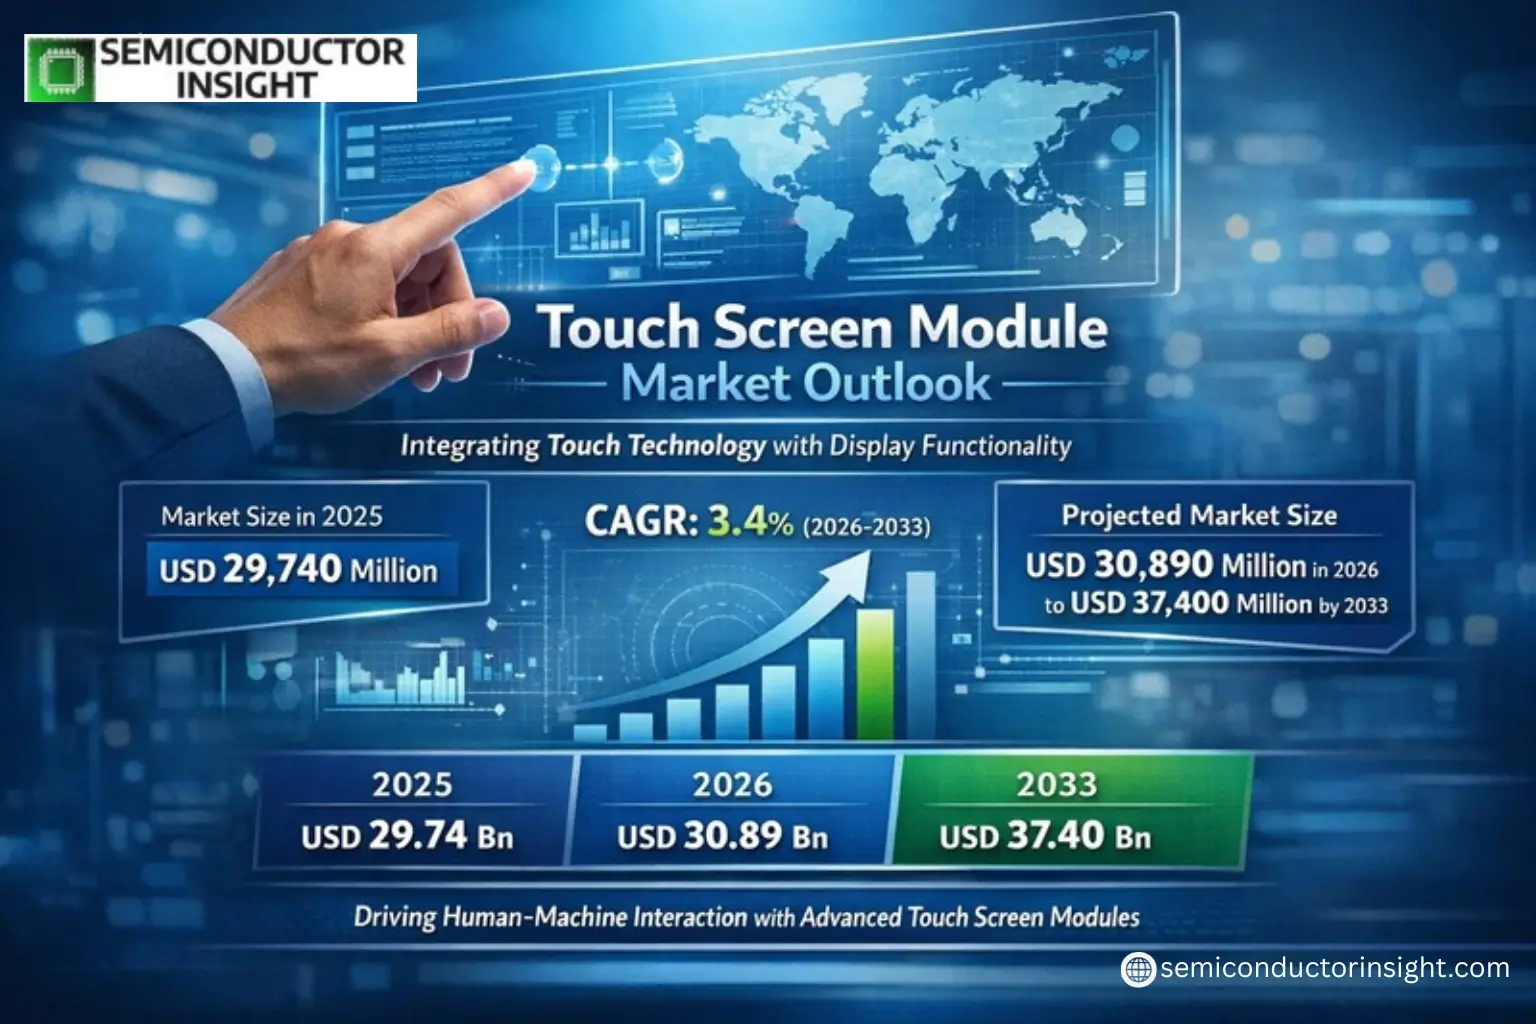
Global Touch Screen Module Market size was valued at USD 29,740 million in 2025. The market is projected to grow from USD 30,890 million in 2026 to USD 37,400 million by 2033, exhibiting a CAGR of 3.4% during the forecast period.

Touch Screen Modules are critical components that integrate touch technology with display functionality, enabling intuitive human-machine interaction. These modules detect user inputs such as taps, swipes, or multi-touch gestures and convert them into electrical signals for device control. Key technologies include resistive, capacitive (projected and surface), infrared, and surface acoustic wave solutions. Capacitive touch screens dominate the market due to their high sensitivity, durability, and multi-touch capabilities.

The market growth is driven by rising demand for smartphones, automotive displays, and industrial automation systems. Advancements like flexible OLED integration and AI-enhanced touch accuracy are accelerating adoption. However, supply chain dependencies on materials like ITO films pose cost challenges. Leading players such as Samsung Display, LG Display, and Tianma are investing in innovations like ultra-thin designs and foldable modules to maintain competitive advantage.

Xyz market size & forecast

MARKET DRIVERS

Rising Demand for Interactive Displays

Touch Screen Module Market is experiencing growth due to increasing adoption in smartphones, tablets, and automotive infotainment systems. Demand for high-resolution multi-touch displays has surged by approximately 18% annually, backed by consumer preference for intuitive interfaces.

Advancements in Touch Technology

Technological innovations such as capacitive and resistive Touch Screen Modules are enhancing user experience with faster response times. The market is projected to grow by $5.2 billion by 2027, driven by industrial and healthcare applications.

Manufacturers are focusing on durable and energy-efficient modules to meet diverse industry demands.

MARKET CHALLENGES

High Production Costs

Touch Screen Module Market faces constraints from increasing raw material costs, particularly for indium tin oxide (ITO), which accounts for 40% of module production expenses. This impacts profit margins for small and mid-sized manufacturers.

Other Challenges

Supply Chain Disruptions
Global semiconductor shortages have delayed Touch Screen Module production, affecting delivery timelines by 20-25% in key markets.

Technical Limitations
Resistive Touch Screen Modules struggle with multi-touch functionality, creating adoption barriers in premium devices.

MARKET RESTRAINTS

Regulatory Compliance

Stringent regulations on electronic waste and hazardous materials in regions like the EU restrict material choices for Touch Screen Modules, potentially increasing compliance costs by 12-15%.

MARKET OPPORTUNITIES

Expansion in Automotive Sector

The automotive Touch Screen Module Market is projected to grow at 9% CAGR, fueled by demand for digital dashboards and ADAS interfaces in electric and autonomous vehicles.

Emerging Markets Growth

Developing economies offer significant potential, with demand for affordable Touch Screen Modules in education and retail sectors growing by 22% year-over-year.
Touch Screen Module Market ($29.74 Billion) Growth Trends

Capacitive Technology Dominates with 3.4% CAGR Projection

Global Touch Screen Module market is projected to reach $37.4 billion by 2033, growing at 3.4% CAGR from its 2025 valuation of $29.74 billion. Capacitive touch modules maintain 68% market share due to superior sensitivity and multi-touch capability, while resistive solutions remain relevant in industrial applications requiring stylus input. Emerging flexible OLED integrations and In-Cell/On-Cell technologies are driving premium segment growth.

Other Trends

Automotive Sector Accelerates Demand

Automotive applications now represent 22% of touch module demand, spurred by smart cockpit implementations in electric vehicles. Manufacturers are developing large-format (12-17 inch) modules with enhanced durability against temperature extremes and vibration. Haptic feedback adoption in automotive touchscreens grew 27% YoY in 2023.

Supply Chain and Regional Dynamics Reshaping Production

Asia-Pacific commands 58% of global production, with Chinese manufacturers increasing market share to 31% through cost-competitive solutions. However, Japanese/Korean firms retain technology leadership in flexible displays, holding 73% of patents. The industry faces material cost pressures, with ITO film prices fluctuating 15-20% annually.

Industrial & Medical Applications Show Steady Growth

Dustproof/waterproof touch modules for industrial use grew 11% in 2023, while medical device integrations account for 9% of the market. These sectors prioritize reliability over resolution, with projected 4.1% CAGR through 2030 for ruggedized solutions.

Emerging Technologies Challenge Traditional Input Methods

While voice and gesture interfaces gain traction, touch maintains 89% share in primary device interaction. The market is responding with AI-enhanced touch accuracy (error rates reduced to <0.5mm) and pressure-sensitive solutions. Foldable display shipments incorporating touch modules reached 18.2 million units in 2023, signaling new form factor opportunities.

COMPETITIVE LANDSCAPE

Key Industry Players

Global Touch Screen Module Market dominated by Asian manufacturers with technological leadership from Japan and Korea

Touch Screen Module Market remains highly concentrated, with Samsung Display and LG Display leading in premium capacitive touch solutions for smartphones and automotive applications. These Korean manufacturers control approximately 35% of the global market share through advanced OLED touch integration technologies. Japanese firms like Sharp and Nissha maintain strong positions in high-reliability industrial touch panels, leveraging patented film sensor architectures. Chinese suppliers including TPK and Tianma are rapidly catching up through aggressive capacity expansion and government-supported R&D initiatives, particularly in mid-range consumer electronics segments.

Emerging players from Taiwan (CANDO, Youngfast) and China (O-Film, Goworld) are gaining traction in cost-sensitive markets through optimized supply chains. Specialized manufacturers such as 3M and Fujitsu focus on niche segments demanding extreme durability, with products featuring anti-glare coatings and wide temperature tolerance. The competitive landscape is witnessing increased vertical integration as display panel makers like BOE and Innolux enter the touch module business, while touch specialists respond with value-added solutions like force touch and waterproofing technologies.

List of Key Touch Screen Module Companies Profiled

Segment Analysis:

Segment Category Sub-Segments Key Insights
By Type
  • Resistive Touch Screen
  • Capacitive Touch Screen
  • Piezoelectric Touch Screen
Capacitive Touch Screen dominates current market demand due to superior performance characteristics:

  • Multi-touch functionality enables advanced gesture controls demanded by modern devices
  • Higher durability and scratch resistance compared to resistive alternatives
  • Better optical clarity and sunlight visibility for outdoor applications
By Application
  • Smartphone
  • Tablet & PC
  • Automotive
  • Industrial & Medical
  • Smart Home
Smartphone remains the primary growth driver with evolving requirements:

  • Increasing demand for edge-to-edge displays with ultra-narrow bezels
  • High refresh rates (120Hz+) becoming standard for premium user experience
  • Foldable screen technology creating new opportunities for flexible touch modules
By End User
  • Consumer Electronics
  • Automotive Manufacturers
  • Industrial Equipment Providers
  • Healthcare Device Makers
Consumer Electronics demonstrates the most dynamic innovation cycle:

  • Constant product refreshes (smartphones, tablets) drive iterative touch technology improvements
  • Premiumization trend pushes adoption of high-performance touch solutions with haptic feedback
  • Emerging AR/VR applications creating demand for ultra-low latency touch interfaces
By Technology
  • In-Cell Technology
  • On-Cell Technology
  • Out-Cell Technology
In-Cell Technology gaining strong momentum across industries:

  • Enables thinner device profiles by integrating touch sensors within LCD layers
  • Superior optical performance with reduced light diffusion compared to out-cell solutions
  • Preferred for premium smartphones requiring slimmer designs and better touch response
By Screen Size
  • Small (6-10 inch)
  • Medium (10-20 inch)
  • Large (20+ inch)
Small Screen solutions show strongest market penetration currently:

  • High-volume applications in smartphones create economies of scale for small touch panels
  • Technical challenges increase exponentially with screen size for touch accuracy and latency
  • Emerging automotive dashboard applications bridging into medium screen segment

Regional Analysis: Global Touch Screen Module Market

Asia-Pacific

The Asia-Pacific region dominates the Touch Screen Module Market, driven by massive electronics manufacturing hubs across China, Japan, and South Korea. This region benefits from robust supply chains supporting touchscreen production for smartphones, automotive displays, and industrial control panels. Government initiatives promoting smart manufacturing and significant investments in consumer electronics R&D further accelerate market growth. Local manufacturers benefit from cost advantages in component production while maintaining competitive quality standards. The regional demand is amplified by increasing adoption of touch interfaces across educational devices, retail kiosks, and healthcare equipment. Local brands like Samsung, LG, and Huawei contribute significantly to technological advancements in capacitive and resistive touch modules, setting global benchmarks for innovation.

Manufacturing Ecosystem
Asia-Pacific’s integrated supply chain for touch panels combines specialized glass suppliers, IC manufacturers, and assembly plants within proximity, reducing production costs. The region accounts for over 60% of global touch module component manufacturing.
Consumer Electronics Boom
The smartphone and tablet markets in China and India drive touch module demand. Mid-range device manufacturers increasingly adopt premium touch technologies previously reserved for flagship models, expanding market opportunities.
Automotive Integration
Japanese automakers lead in implementing advanced touchscreen dashboards. The transition from physical buttons to touch interfaces in vehicles creates new demand for rugged, sunlight-readable touch modules with haptic feedback.
Industrial Automation
Southeast Asian factories increasingly deploy touch-controlled machinery interfaces. The durability requirements in industrial environments push innovations in glove-compatible and water-resistant touch modules.

North America
North America remains a technology innovation hub for advanced Touch Screen Module applications. The region’s strong R&D culture drives development of next-generation technologies like force touch and seamless OLED-integrated touch sensors. The automotive sector shows particularly high adoption rates for large-format touch displays, with premium brands incorporating multi-touch capabilities. Healthcare applications have grown significantly, with touch interfaces used in medical imaging systems and diagnostic equipment. The U.S. defense sector’s investment in rugged touch displays for field operations further diversifies market opportunities.

Europe
European manufacturers focus on high-precision touch modules for specialized applications. The automotive industry demands curved and flexible touchscreens for premium vehicle interiors, while industrial equipment suppliers require touch solutions that withstand extreme temperatures. Stringent EU regulations push development of eco-friendly touch module materials and energy-efficient production processes. Germany’s industrial automation sector and France’s aerospace industry present key growth areas for ruggedized touch interfaces with advanced gesture control capabilities.

South America
Touch Screen Module Market in South America shows steady growth, led by Brazil’s consumer electronics sector and Argentina’s emerging digital signage industry. Although smaller than other regions, local demand benefits from increasing smartphone penetration and government digitalization initiatives. Challenges include higher import costs for advanced touch components and limited local manufacturing capabilities. However, partnerships between regional brands and Asian manufacturers are helping bridge this technology gap for mid-range touchscreen products.

Middle East & Africa
This region experiences growing touch module demand from smart city projects and retail digital transformation. Gulf countries invest heavily in large-format touch displays for public spaces and corporate environments. Africa’s mobile-first economy drives demand for affordable touchscreen devices, with local assembly plants emerging in key markets. The educational technology sector presents new opportunities, with governments deploying touch-enabled learning devices in schools across urban centers.

Report Scope

This market research report provides a comprehensive analysis of the Touch Screen Module Market , covering the forecast period 2025–2033. It offers detailed insights into market dynamics, technological advancements, competitive landscape, and key trends shaping the industry.

Key focus areas of the report include:

  • Market Overview: The report begins with an overview outlining its current market scenario, key growth indicators, and industry transformation drivers. It discusses macroeconomic factors, demand–supply balance, regulatory landscape, and the strategic role of touch technology in powering advancements across industries such as consumer electronics, automotive displays, industrial automation, and medical devices.
  • Market Size & Forecast: Historical data and future projections for revenue, unit shipments, and market value across major regions and segments.
  • Segmentation Analysis: Detailed breakdown by product type (resistive, capacitive, piezoelectric), application (smartphone, tablet & PC, automotive), and end-user industry to identify high-growth segments.
  • Regional Insights: Insights into market performance across North America, Europe, Asia-Pacific, Latin America, and the Middle East & Africa, including country-level analysis.
  • Competitive Landscape: Profiles of leading market participants, including their product offerings, R&D focus, manufacturing capacity, and recent developments.
  • Technology Trends & Innovation: Assessment of emerging technologies like flexible OLEDs, Mini LED backlighting, AI-driven touch accuracy improvements, and In-Cell/On-Cell integration.
  • Market Drivers & Restraints: Evaluation of factors driving market growth along with supply chain constraints and technological disruption risks.
  • Stakeholder Insights: Strategic perspectives for component suppliers, OEMs, system integrators, and investors.

Primary and secondary research methods are employed, including interviews with industry experts and data from verified sources to ensure accuracy.

FREQUENTLY ASKED QUESTIONS:

What is the current market size of Touch Screen Module Market?

-> Touch Screen Module Market size was valued at USD 29,740 million in 2025. The market is projected to grow from USD 30,890 million in 2026 to USD 37,400 million by 2033, exhibiting a CAGR of 3.4% during the forecast period.

Which key companies operate in Touch Screen Module Market?

-> Key players include Tianma, Samsung Display, 3M, LG, Fujitsu, Nissha, Sharp, TPK, and SHENZHEN O-FILM THCH, among others.

What are the key growth drivers?

-> Key growth drivers include smartphone innovations, automotive smart cockpit demand, industrial automation, and AI-enhanced touch technology.

Which region dominates the market?

-> Asia-Pacific dominates the market, led by China and South Korea’s display manufacturing capabilities.

What are the emerging trends?

-> Emerging trends include foldable displays, haptic feedback integration, ultra-narrow bezel designs, and green manufacturing initiatives.

What is the projected CAGR?

-> The market is expected to grow at a CAGR of 3.4% during 2025-2033.

Touch Screen Module Market, Size, Trends, Business Strategies 2026-2033

Get Sample Report PDF for Exclusive Insights

Report Sample Includes

  • Table of Contents
  • List of Tables & Figures
  • Charts, Research Methodology, and more...
PDF Icon Download Sample Report PDF

Download Sample Report

Table of Content

Table of Contents
1 Research Methodology and Statistical Scope
1.1 Market Definition and Statistical Scope of Touch Screen Module
1.2 Key Market Segments
1.2.1 Touch Screen Module Segment by Type
1.2.2 Touch Screen Module Segment by Application
1.3 Methodology & Sources of Information
1.3.1 Research Methodology
1.3.2 Research Process
1.3.3 Market Breakdown and Data Triangulation
1.3.4 Base Year
1.3.5 Report Assumptions & Caveats
2 Touch Screen Module Market Overview
2.1 Global Market Overview
2.1.1 Global Touch Screen Module Market Size (M USD) Estimates and Forecasts (2019-2030)
2.1.2 Global Touch Screen Module Sales Estimates and Forecasts (2019-2030)
2.2 Market Segment Executive Summary
2.3 Global Market Size by Region
3 Touch Screen Module Market Competitive Landscape
3.1 Global Touch Screen Module Sales by Manufacturers (2019-2025)
3.2 Global Touch Screen Module Revenue Market Share by Manufacturers (2019-2025)
3.3 Touch Screen Module Market Share by Company Type (Tier 1, Tier 2, and Tier 3)
3.4 Global Touch Screen Module Average Price by Manufacturers (2019-2025)
3.5 Manufacturers Touch Screen Module Sales Sites, Area Served, Product Type
3.6 Touch Screen Module Market Competitive Situation and Trends
3.6.1 Touch Screen Module Market Concentration Rate
3.6.2 Global 5 and 10 Largest Touch Screen Module Players Market Share by Revenue
3.6.3 Mergers & Acquisitions, Expansion
4 Touch Screen Module Industry Chain Analysis
4.1 Touch Screen Module Industry Chain Analysis
4.2 Market Overview of Key Raw Materials
4.3 Midstream Market Analysis
4.4 Downstream Customer Analysis
5 The Development and Dynamics of Touch Screen Module Market
5.1 Key Development Trends
5.2 Driving Factors
5.3 Market Challenges
5.4 Market Restraints
5.5 Industry News
5.5.1 New Product Developments
5.5.2 Mergers & Acquisitions
5.5.3 Expansions
5.5.4 Collaboration/Supply Contracts
5.6 Industry Policies
6 Touch Screen Module Market Segmentation by Type
6.1 Evaluation Matrix of Segment Market Development Potential (Type)
6.2 Global Touch Screen Module Sales Market Share by Type (2019-2025)
6.3 Global Touch Screen Module Market Size Market Share by Type (2019-2025)
6.4 Global Touch Screen Module Price by Type (2019-2025)
7 Touch Screen Module Market Segmentation by Application
7.1 Evaluation Matrix of Segment Market Development Potential (Application)
7.2 Global Touch Screen Module Market Sales by Application (2019-2025)
7.3 Global Touch Screen Module Market Size (M USD) by Application (2019-2025)
7.4 Global Touch Screen Module Sales Growth Rate by Application (2019-2025)
8 Touch Screen Module Market Segmentation by Region
8.1 Global Touch Screen Module Sales by Region
8.1.1 Global Touch Screen Module Sales by Region
8.1.2 Global Touch Screen Module Sales Market Share by Region
8.2 North America
8.2.1 North America Touch Screen Module Sales by Country
8.2.2 U.S.
8.2.3 Canada
8.2.4 Mexico
8.3 Europe
8.3.1 Europe Touch Screen Module Sales by Country
8.3.2 Germany
8.3.3 France
8.3.4 U.K.
8.3.5 Italy
8.3.6 Russia
8.4 Asia Pacific
8.4.1 Asia Pacific Touch Screen Module Sales by Region
8.4.2 China
8.4.3 Japan
8.4.4 South Korea
8.4.5 India
8.4.6 Southeast Asia
8.5 South America
8.5.1 South America Touch Screen Module Sales by Country
8.5.2 Brazil
8.5.3 Argentina
8.5.4 Columbia
8.6 Middle East and Africa
8.6.1 Middle East and Africa Touch Screen Module Sales by Region
8.6.2 Saudi Arabia
8.6.3 UAE
8.6.4 Egypt
8.6.5 Nigeria
8.6.6 South Africa
9 Key Companies Profile
9.1 3M
9.1.1 3M Touch Screen Module Basic Information
9.1.2 3M Touch Screen Module Product Overview
9.1.3 3M Touch Screen Module Product Market Performance
9.1.4 3M Business Overview
9.1.5 3M Touch Screen Module SWOT Analysis
9.1.6 3M Recent Developments
9.2 Digitech System
9.2.1 Digitech System Touch Screen Module Basic Information
9.2.2 Digitech System Touch Screen Module Product Overview
9.2.3 Digitech System Touch Screen Module Product Market Performance
9.2.4 Digitech System Business Overview
9.2.5 Digitech System Touch Screen Module SWOT Analysis
9.2.6 Digitech System Recent Developments
9.3 LG
9.3.1 LG Touch Screen Module Basic Information
9.3.2 LG Touch Screen Module Product Overview
9.3.3 LG Touch Screen Module Product Market Performance
9.3.4 LG Touch Screen Module SWOT Analysis
9.3.5 LG Business Overview
9.3.6 LG Recent Developments
9.4 Fujitsu
9.4.1 Fujitsu Touch Screen Module Basic Information
9.4.2 Fujitsu Touch Screen Module Product Overview
9.4.3 Fujitsu Touch Screen Module Product Market Performance
9.4.4 Fujitsu Business Overview
9.4.5 Fujitsu Recent Developments
9.5 Nissha
9.5.1 Nissha Touch Screen Module Basic Information
9.5.2 Nissha Touch Screen Module Product Overview
9.5.3 Nissha Touch Screen Module Product Market Performance
9.5.4 Nissha Business Overview
9.5.5 Nissha Recent Developments
9.6 Sharp
9.6.1 Sharp Touch Screen Module Basic Information
9.6.2 Sharp Touch Screen Module Product Overview
9.6.3 Sharp Touch Screen Module Product Market Performance
9.6.4 Sharp Business Overview
9.6.5 Sharp Recent Developments
9.7 TPK
9.7.1 TPK Touch Screen Module Basic Information
9.7.2 TPK Touch Screen Module Product Overview
9.7.3 TPK Touch Screen Module Product Market Performance
9.7.4 TPK Business Overview
9.7.5 TPK Recent Developments
9.8 SHENZHEN O-FILM THCH
9.8.1 SHENZHEN O-FILM THCH Touch Screen Module Basic Information
9.8.2 SHENZHEN O-FILM THCH Touch Screen Module Product Overview
9.8.3 SHENZHEN O-FILM THCH Touch Screen Module Product Market Performance
9.8.4 SHENZHEN O-FILM THCH Business Overview
9.8.5 SHENZHEN O-FILM THCH Recent Developments
9.9 Chi Mei
9.9.1 Chi Mei Touch Screen Module Basic Information
9.9.2 Chi Mei Touch Screen Module Product Overview
9.9.3 Chi Mei Touch Screen Module Product Market Performance
9.9.4 Chi Mei Business Overview
9.9.5 Chi Mei Recent Developments
9.10 CANDO
9.10.1 CANDO Touch Screen Module Basic Information
9.10.2 CANDO Touch Screen Module Product Overview
9.10.3 CANDO Touch Screen Module Product Market Performance
9.10.4 CANDO Business Overview
9.10.5 CANDO Recent Developments
9.11 Youngfast
9.11.1 Youngfast Touch Screen Module Basic Information
9.11.2 Youngfast Touch Screen Module Product Overview
9.11.3 Youngfast Touch Screen Module Product Market Performance
9.11.4 Youngfast Business Overview
9.11.5 Youngfast Recent Developments
9.12 JTOUCH
9.12.1 JTOUCH Touch Screen Module Basic Information
9.12.2 JTOUCH Touch Screen Module Product Overview
9.12.3 JTOUCH Touch Screen Module Product Market Performance
9.12.4 JTOUCH Business Overview
9.12.5 JTOUCH Recent Developments
9.13 Guangdong Goworld
9.13.1 Guangdong Goworld Touch Screen Module Basic Information
9.13.2 Guangdong Goworld Touch Screen Module Product Overview
9.13.3 Guangdong Goworld Touch Screen Module Product Market Performance
9.13.4 Guangdong Goworld Business Overview
9.13.5 Guangdong Goworld Recent Developments
9.14 Wuhu Token Science
9.14.1 Wuhu Token Science Touch Screen Module Basic Information
9.14.2 Wuhu Token Science Touch Screen Module Product Overview
9.14.3 Wuhu Token Science Touch Screen Module Product Market Performance
9.14.4 Wuhu Token Science Business Overview
9.14.5 Wuhu Token Science Recent Developments
9.15 Shenzhen Yushun electronic
9.15.1 Shenzhen Yushun electronic Touch Screen Module Basic Information
9.15.2 Shenzhen Yushun electronic Touch Screen Module Product Overview
9.15.3 Shenzhen Yushun electronic Touch Screen Module Product Market Performance
9.15.4 Shenzhen Yushun electronic Business Overview
9.15.5 Shenzhen Yushun electronic Recent Developments
9.16 SHENZHEN LAIBAO HI-TECH
9.16.1 SHENZHEN LAIBAO HI-TECH Touch Screen Module Basic Information
9.16.2 SHENZHEN LAIBAO HI-TECH Touch Screen Module Product Overview
9.16.3 SHENZHEN LAIBAO HI-TECH Touch Screen Module Product Market Performance
9.16.4 SHENZHEN LAIBAO HI-TECH Business Overview
9.16.5 SHENZHEN LAIBAO HI-TECH Recent Developments
10 Touch Screen Module Market Forecast by Region
10.1 Global Touch Screen Module Market Size Forecast
10.2 Global Touch Screen Module Market Forecast by Region
10.2.1 North America Market Size Forecast by Country
10.2.2 Europe Touch Screen Module Market Size Forecast by Country
10.2.3 Asia Pacific Touch Screen Module Market Size Forecast by Region
10.2.4 South America Touch Screen Module Market Size Forecast by Country
10.2.5 Middle East and Africa Forecasted Consumption of Touch Screen Module by Country
11 Forecast Market by Type and by Application (2025-2030)
11.1 Global Touch Screen Module Market Forecast by Type (2025-2030)
11.1.1 Global Forecasted Sales of Touch Screen Module by Type (2025-2030)
11.1.2 Global Touch Screen Module Market Size Forecast by Type (2025-2030)
11.1.3 Global Forecasted Price of Touch Screen Module by Type (2025-2030)
11.2 Global Touch Screen Module Market Forecast by Application (2025-2030)
11.2.1 Global Touch Screen Module Sales (K Units) Forecast by Application
11.2.2 Global Touch Screen Module Market Size (M USD) Forecast by Application (2025-2030)
12 Conclusion and Key FindingsList of Tables
Table 1. Introduction of the Type
Table 2. Introduction of the Application
Table 3. Market Size (M USD) Segment Executive Summary
Table 4. Touch Screen Module Market Size Comparison by Region (M USD)
Table 5. Global Touch Screen Module Sales (K Units) by Manufacturers (2019-2025)
Table 6. Global Touch Screen Module Sales Market Share by Manufacturers (2019-2025)
Table 7. Global Touch Screen Module Revenue (M USD) by Manufacturers (2019-2025)
Table 8. Global Touch Screen Module Revenue Share by Manufacturers (2019-2025)
Table 9. Company Type (Tier 1, Tier 2, and Tier 3) & (based on the Revenue in Touch Screen Module as of 2022)
Table 10. Global Market Touch Screen Module Average Price (USD/Unit) of Key Manufacturers (2019-2025)
Table 11. Manufacturers Touch Screen Module Sales Sites and Area Served
Table 12. Manufacturers Touch Screen Module Product Type
Table 13. Global Touch Screen Module Manufacturers Market Concentration Ratio (CR5 and HHI)
Table 14. Mergers & Acquisitions, Expansion Plans
Table 15. Industry Chain Map of Touch Screen Module
Table 16. Market Overview of Key Raw Materials
Table 17. Midstream Market Analysis
Table 18. Downstream Customer Analysis
Table 19. Key Development Trends
Table 20. Driving Factors
Table 21. Touch Screen Module Market Challenges
Table 22. Global Touch Screen Module Sales by Type (K Units)
Table 23. Global Touch Screen Module Market Size by Type (M USD)
Table 24. Global Touch Screen Module Sales (K Units) by Type (2019-2025)
Table 25. Global Touch Screen Module Sales Market Share by Type (2019-2025)
Table 26. Global Touch Screen Module Market Size (M USD) by Type (2019-2025)
Table 27. Global Touch Screen Module Market Size Share by Type (2019-2025)
Table 28. Global Touch Screen Module Price (USD/Unit) by Type (2019-2025)
Table 29. Global Touch Screen Module Sales (K Units) by Application
Table 30. Global Touch Screen Module Market Size by Application
Table 31. Global Touch Screen Module Sales by Application (2019-2025) & (K Units)
Table 32. Global Touch Screen Module Sales Market Share by Application (2019-2025)
Table 33. Global Touch Screen Module Sales by Application (2019-2025) & (M USD)
Table 34. Global Touch Screen Module Market Share by Application (2019-2025)
Table 35. Global Touch Screen Module Sales Growth Rate by Application (2019-2025)
Table 36. Global Touch Screen Module Sales by Region (2019-2025) & (K Units)
Table 37. Global Touch Screen Module Sales Market Share by Region (2019-2025)
Table 38. North America Touch Screen Module Sales by Country (2019-2025) & (K Units)
Table 39. Europe Touch Screen Module Sales by Country (2019-2025) & (K Units)
Table 40. Asia Pacific Touch Screen Module Sales by Region (2019-2025) & (K Units)
Table 41. South America Touch Screen Module Sales by Country (2019-2025) & (K Units)
Table 42. Middle East and Africa Touch Screen Module Sales by Region (2019-2025) & (K Units)
Table 43. 3M Touch Screen Module Basic Information
Table 44. 3M Touch Screen Module Product Overview
Table 45. 3M Touch Screen Module Sales (K Units), Revenue (M USD), Price (USD/Unit) and Gross Margin (2019-2025)
Table 46. 3M Business Overview
Table 47. 3M Touch Screen Module SWOT Analysis
Table 48. 3M Recent Developments
Table 49. Digitech System Touch Screen Module Basic Information
Table 50. Digitech System Touch Screen Module Product Overview
Table 51. Digitech System Touch Screen Module Sales (K Units), Revenue (M USD), Price (USD/Unit) and Gross Margin (2019-2025)
Table 52. Digitech System Business Overview
Table 53. Digitech System Touch Screen Module SWOT Analysis
Table 54. Digitech System Recent Developments
Table 55. LG Touch Screen Module Basic Information
Table 56. LG Touch Screen Module Product Overview
Table 57. LG Touch Screen Module Sales (K Units), Revenue (M USD), Price (USD/Unit) and Gross Margin (2019-2025)
Table 58. LG Touch Screen Module SWOT Analysis
Table 59. LG Business Overview
Table 60. LG Recent Developments
Table 61. Fujitsu Touch Screen Module Basic Information
Table 62. Fujitsu Touch Screen Module Product Overview
Table 63. Fujitsu Touch Screen Module Sales (K Units), Revenue (M USD), Price (USD/Unit) and Gross Margin (2019-2025)
Table 64. Fujitsu Business Overview
Table 65. Fujitsu Recent Developments
Table 66. Nissha Touch Screen Module Basic Information
Table 67. Nissha Touch Screen Module Product Overview
Table 68. Nissha Touch Screen Module Sales (K Units), Revenue (M USD), Price (USD/Unit) and Gross Margin (2019-2025)
Table 69. Nissha Business Overview
Table 70. Nissha Recent Developments
Table 71. Sharp Touch Screen Module Basic Information
Table 72. Sharp Touch Screen Module Product Overview
Table 73. Sharp Touch Screen Module Sales (K Units), Revenue (M USD), Price (USD/Unit) and Gross Margin (2019-2025)
Table 74. Sharp Business Overview
Table 75. Sharp Recent Developments
Table 76. TPK Touch Screen Module Basic Information
Table 77. TPK Touch Screen Module Product Overview
Table 78. TPK Touch Screen Module Sales (K Units), Revenue (M USD), Price (USD/Unit) and Gross Margin (2019-2025)
Table 79. TPK Business Overview
Table 80. TPK Recent Developments
Table 81. SHENZHEN O-FILM THCH Touch Screen Module Basic Information
Table 82. SHENZHEN O-FILM THCH Touch Screen Module Product Overview
Table 83. SHENZHEN O-FILM THCH Touch Screen Module Sales (K Units), Revenue (M USD), Price (USD/Unit) and Gross Margin (2019-2025)
Table 84. SHENZHEN O-FILM THCH Business Overview
Table 85. SHENZHEN O-FILM THCH Recent Developments
Table 86. Chi Mei Touch Screen Module Basic Information
Table 87. Chi Mei Touch Screen Module Product Overview
Table 88. Chi Mei Touch Screen Module Sales (K Units), Revenue (M USD), Price (USD/Unit) and Gross Margin (2019-2025)
Table 89. Chi Mei Business Overview
Table 90. Chi Mei Recent Developments
Table 91. CANDO Touch Screen Module Basic Information
Table 92. CANDO Touch Screen Module Product Overview
Table 93. CANDO Touch Screen Module Sales (K Units), Revenue (M USD), Price (USD/Unit) and Gross Margin (2019-2025)
Table 94. CANDO Business Overview
Table 95. CANDO Recent Developments
Table 96. Youngfast Touch Screen Module Basic Information
Table 97. Youngfast Touch Screen Module Product Overview
Table 98. Youngfast Touch Screen Module Sales (K Units), Revenue (M USD), Price (USD/Unit) and Gross Margin (2019-2025)
Table 99. Youngfast Business Overview
Table 100. Youngfast Recent Developments
Table 101. JTOUCH Touch Screen Module Basic Information
Table 102. JTOUCH Touch Screen Module Product Overview
Table 103. JTOUCH Touch Screen Module Sales (K Units), Revenue (M USD), Price (USD/Unit) and Gross Margin (2019-2025)
Table 104. JTOUCH Business Overview
Table 105. JTOUCH Recent Developments
Table 106. Guangdong Goworld Touch Screen Module Basic Information
Table 107. Guangdong Goworld Touch Screen Module Product Overview
Table 108. Guangdong Goworld Touch Screen Module Sales (K Units), Revenue (M USD), Price (USD/Unit) and Gross Margin (2019-2025)
Table 109. Guangdong Goworld Business Overview
Table 110. Guangdong Goworld Recent Developments
Table 111. Wuhu Token Science Touch Screen Module Basic Information
Table 112. Wuhu Token Science Touch Screen Module Product Overview
Table 113. Wuhu Token Science Touch Screen Module Sales (K Units), Revenue (M USD), Price (USD/Unit) and Gross Margin (2019-2025)
Table 114. Wuhu Token Science Business Overview
Table 115. Wuhu Token Science Recent Developments
Table 116. Shenzhen Yushun electronic Touch Screen Module Basic Information
Table 117. Shenzhen Yushun electronic Touch Screen Module Product Overview
Table 118. Shenzhen Yushun electronic Touch Screen Module Sales (K Units), Revenue (M USD), Price (USD/Unit) and Gross Margin (2019-2025)
Table 119. Shenzhen Yushun electronic Business Overview
Table 120. Shenzhen Yushun electronic Recent Developments
Table 121. SHENZHEN LAIBAO HI-TECH Touch Screen Module Basic Information
Table 122. SHENZHEN LAIBAO HI-TECH Touch Screen Module Product Overview
Table 123. SHENZHEN LAIBAO HI-TECH Touch Screen Module Sales (K Units), Revenue (M USD), Price (USD/Unit) and Gross Margin (2019-2025)
Table 124. SHENZHEN LAIBAO HI-TECH Business Overview
Table 125. SHENZHEN LAIBAO HI-TECH Recent Developments
Table 126. Global Touch Screen Module Sales Forecast by Region (2025-2030) & (K Units)
Table 127. Global Touch Screen Module Market Size Forecast by Region (2025-2030) & (M USD)
Table 128. North America Touch Screen Module Sales Forecast by Country (2025-2030) & (K Units)
Table 129. North America Touch Screen Module Market Size Forecast by Country (2025-2030) & (M USD)
Table 130. Europe Touch Screen Module Sales Forecast by Country (2025-2030) & (K Units)
Table 131. Europe Touch Screen Module Market Size Forecast by Country (2025-2030) & (M USD)
Table 132. Asia Pacific Touch Screen Module Sales Forecast by Region (2025-2030) & (K Units)
Table 133. Asia Pacific Touch Screen Module Market Size Forecast by Region (2025-2030) & (M USD)
Table 134. South America Touch Screen Module Sales Forecast by Country (2025-2030) & (K Units)
Table 135. South America Touch Screen Module Market Size Forecast by Country (2025-2030) & (M USD)
Table 136. Middle East and Africa Touch Screen Module Consumption Forecast by Country (2025-2030) & (Units)
Table 137. Middle East and Africa Touch Screen Module Market Size Forecast by Country (2025-2030) & (M USD)
Table 138. Global Touch Screen Module Sales Forecast by Type (2025-2030) & (K Units)
Table 139. Global Touch Screen Module Market Size Forecast by Type (2025-2030) & (M USD)
Table 140. Global Touch Screen Module Price Forecast by Type (2025-2030) & (USD/Unit)
Table 141. Global Touch Screen Module Sales (K Units) Forecast by Application (2025-2030)
Table 142. Global Touch Screen Module Market Size Forecast by Application (2025-2030) & (M USD)
List of Figures
Figure 1. Product Picture of Touch Screen Module
Figure 2. Data Triangulation
Figure 3. Key Caveats
Figure 4. Global Touch Screen Module Market Size (M USD), 2019-2030
Figure 5. Global Touch Screen Module Market Size (M USD) (2019-2030)
Figure 6. Global Touch Screen Module Sales (K Units) & (2019-2030)
Figure 7. Evaluation Matrix of Segment Market Development Potential (Type)
Figure 8. Evaluation Matrix of Segment Market Development Potential (Application)
Figure 9. Evaluation Matrix of Regional Market Development Potential
Figure 10. Touch Screen Module Market Size by Country (M USD)
Figure 11. Touch Screen Module Sales Share by Manufacturers in 2023
Figure 12. Global Touch Screen Module Revenue Share by Manufacturers in 2023
Figure 13. Touch Screen Module Market Share by Company Type (Tier 1, Tier 2 and Tier 3): 2023
Figure 14. Global Market Touch Screen Module Average Price (USD/Unit) of Key Manufacturers in 2023
Figure 15. The Global 5 and 10 Largest Players: Market Share by Touch Screen Module Revenue in 2023
Figure 16. Evaluation Matrix of Segment Market Development Potential (Type)
Figure 17. Global Touch Screen Module Market Share by Type
Figure 18. Sales Market Share of Touch Screen Module by Type (2019-2025)
Figure 19. Sales Market Share of Touch Screen Module by Type in 2023
Figure 20. Market Size Share of Touch Screen Module by Type (2019-2025)
Figure 21. Market Size Market Share of Touch Screen Module by Type in 2023
Figure 22. Evaluation Matrix of Segment Market Development Potential (Application)
Figure 23. Global Touch Screen Module Market Share by Application
Figure 24. Global Touch Screen Module Sales Market Share by Application (2019-2025)
Figure 25. Global Touch Screen Module Sales Market Share by Application in 2023
Figure 26. Global Touch Screen Module Market Share by Application (2019-2025)
Figure 27. Global Touch Screen Module Market Share by Application in 2023
Figure 28. Global Touch Screen Module Sales Growth Rate by Application (2019-2025)
Figure 29. Global Touch Screen Module Sales Market Share by Region (2019-2025)
Figure 30. North America Touch Screen Module Sales and Growth Rate (2019-2025) & (K Units)
Figure 31. North America Touch Screen Module Sales Market Share by Country in 2023
Figure 32. U.S. Touch Screen Module Sales and Growth Rate (2019-2025) & (K Units)
Figure 33. Canada Touch Screen Module Sales (K Units) and Growth Rate (2019-2025)
Figure 34. Mexico Touch Screen Module Sales (Units) and Growth Rate (2019-2025)
Figure 35. Europe Touch Screen Module Sales and Growth Rate (2019-2025) & (K Units)
Figure 36. Europe Touch Screen Module Sales Market Share by Country in 2023
Figure 37. Germany Touch Screen Module Sales and Growth Rate (2019-2025) & (K Units)
Figure 38. France Touch Screen Module Sales and Growth Rate (2019-2025) & (K Units)
Figure 39. U.K. Touch Screen Module Sales and Growth Rate (2019-2025) & (K Units)
Figure 40. Italy Touch Screen Module Sales and Growth Rate (2019-2025) & (K Units)
Figure 41. Russia Touch Screen Module Sales and Growth Rate (2019-2025) & (K Units)
Figure 42. Asia Pacific Touch Screen Module Sales and Growth Rate (K Units)
Figure 43. Asia Pacific Touch Screen Module Sales Market Share by Region in 2023
Figure 44. China Touch Screen Module Sales and Growth Rate (2019-2025) & (K Units)
Figure 45. Japan Touch Screen Module Sales and Growth Rate (2019-2025) & (K Units)
Figure 46. South Korea Touch Screen Module Sales and Growth Rate (2019-2025) & (K Units)
Figure 47. India Touch Screen Module Sales and Growth Rate (2019-2025) & (K Units)
Figure 48. Southeast Asia Touch Screen Module Sales and Growth Rate (2019-2025) & (K Units)
Figure 49. South America Touch Screen Module Sales and Growth Rate (K Units)
Figure 50. South America Touch Screen Module Sales Market Share by Country in 2023
Figure 51. Brazil Touch Screen Module Sales and Growth Rate (2019-2025) & (K Units)
Figure 52. Argentina Touch Screen Module Sales and Growth Rate (2019-2025) & (K Units)
Figure 53. Columbia Touch Screen Module Sales and Growth Rate (2019-2025) & (K Units)
Figure 54. Middle East and Africa Touch Screen Module Sales and Growth Rate (K Units)
Figure 55. Middle East and Africa Touch Screen Module Sales Market Share by Region in 2023
Figure 56. Saudi Arabia Touch Screen Module Sales and Growth Rate (2019-2025) & (K Units)
Figure 57. UAE Touch Screen Module Sales and Growth Rate (2019-2025) & (K Units)
Figure 58. Egypt Touch Screen Module Sales and Growth Rate (2019-2025) & (K Units)
Figure 59. Nigeria Touch Screen Module Sales and Growth Rate (2019-2025) & (K Units)
Figure 60. South Africa Touch Screen Module Sales and Growth Rate (2019-2025) & (K Units)
Figure 61. Global Touch Screen Module Sales Forecast by Volume (2019-2030) & (K Units)
Figure 62. Global Touch Screen Module Market Size Forecast by Value (2019-2030) & (M USD)
Figure 63. Global Touch Screen Module Sales Market Share Forecast by Type (2025-2030)
Figure 64. Global Touch Screen Module Market Share Forecast by Type (2025-2030)
Figure 65. Global Touch Screen Module Sales Forecast by Application (2025-2030)
Figure 66. Global Touch Screen Module Market Share Forecast by Application (2025-2030)