ToF 3D Image Sensor for Consumer Market Overview
From AR (augmented reality) and VR (virtual reality) headsets to smartphones with advanced photographic and security features, ToF technology is projected to become a vital part of next-generation consumer electronics
This report provides a deep insight into the global ToF 3D Image Sensor for Consumer market covering all its essential aspects. This ranges from a macro overview of the market to micro details of the market size, competitive landscape, development trend, niche market, key market drivers and challenges, SWOT analysis, value chain analysis, etc.
The analysis helps the reader to shape the competition within the industries and strategies for the competitive environment to enhance the potential profit. Furthermore, it provides a simple framework for evaluating and accessing the position of the business organization. The report structure also focuses on the competitive landscape of the Global ToF 3D Image Sensor for Consumer Market, this report introduces in detail the market share, market performance, product situation, operation situation, etc. of the main players, which helps the readers in the industry to identify the main competitors and deeply understand the competition pattern of the market.
In a word, this report is a must-read for industry players, investors, researchers, consultants, business strategists, and all those who have any kind of stake or are planning to foray into the ToF 3D Image Sensor for Consumer market in any manner.
ToF 3D Image Sensor for Consumer Market Analysis:
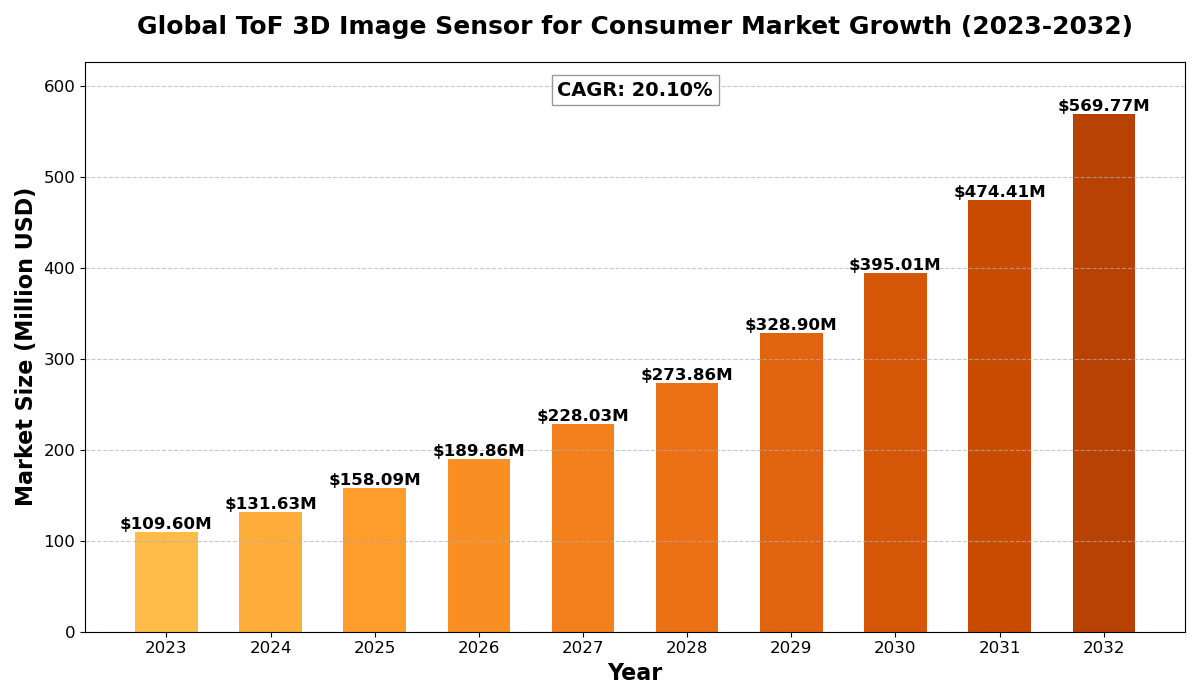
The global ToF 3D Image Sensor for Consumer Market size was estimated at USD 109.60 million in 2023 and is projected to reach USD 569.77 million by 2032, exhibiting a CAGR of 20.10% during the forecast period.
North America ToF 3D Image Sensor for Consumer market size was estimated at USD 39.25 million in 2023, at a CAGR of 17.23% during the forecast period of 2025 through 2032.
ToF 3D Image Sensor for Consumer Key Market Trends :
-
Rising Demand for AR/VR Integration
ToF sensors are becoming crucial in AR and VR applications, enhancing depth perception and improving user experiences in gaming, training, and entertainment. -
Advancements in Smartphone Camera Technology
The increasing adoption of ToF sensors in smartphones for portrait mode, 3D scanning, and facial recognition is driving market growth significantly. -
Expansion of Smart Home and Robotics Applications
ToF sensors are finding applications in home automation, domestic robots, and security systems, contributing to increased market demand. -
Growing Investments in AI and IoT Technologies
Companies are integrating ToF sensors with AI and IoT for better object recognition, gesture control, and automation across various industries. -
Development of Cost-Effective and Compact ToF Sensors
Manufacturers are focusing on reducing the cost and size of ToF sensors to make them more accessible for consumer electronics.
ToF 3D Image Sensor for Consumer Market Regional Analysis :

-
North America:
Strong demand driven by EVs, 5G infrastructure, and renewable energy, with the U.S. leading the market.
-
Europe:
Growth fueled by automotive electrification, renewable energy, and strong regulatory support, with Germany as a key player.
-
Asia-Pacific:
Dominates the market due to large-scale manufacturing in China and Japan, with growing demand from EVs, 5G, and semiconductors.
-
South America:
Emerging market, driven by renewable energy and EV adoption, with Brazil leading growth.
-
Middle East & Africa:
Gradual growth, mainly due to investments in renewable energy and EV infrastructure, with Saudi Arabia and UAE as key contributors.
ToF 3D Image Sensor for Consumer Market Segmentation :
The research report includes specific segments by region (country), manufacturers, Type, and Application. Market segmentation creates subsets of a market based on product type, end-user or application, Geographic, and other factors. By understanding the market segments, the decision-maker can leverage this targeting in the product, sales, and marketing strategies. Market segments can power your product development cycles by informing how you create product offerings for different segments.
Key Company
- Infineon Technologies
- Texas Instruments
- Analog Devices
- STMicroelectronics
- OMRON
- Nuvoton
- Brookman Technology
- AMS
- Elmos Semiconductor
- PMD Technologies
- Espros Photonics
- Orbbec
- Evisionics
- Opnous
Market Segmentation (by Type)
- Direct ToF
- Indirect TOF
Market Segmentation (by Application)
- Monitoring Systems
- Domestic Robots
- Personal Electronics
- Other
Market Drivers
-
Rise in Demand for AR & VR Devices
- The growing popularity of AR/VR applications in gaming, healthcare, and retail is fueling the demand for ToF 3D image sensors.
-
Advancements in Smartphone Technology
- Smartphone manufacturers are integrating ToF sensors for advanced photography, security, and 3D scanning, boosting market growth.
-
Increase in Smart Home and IoT Applications
- The rising adoption of smart home devices and IoT-based applications is propelling the need for ToF sensors in automation and security systems.
Market Restraints
-
High Manufacturing and Implementation Costs
- The cost of developing and integrating ToF sensors into devices remains a challenge for manufacturers.
-
Limited Consumer Awareness
- Many consumers are still unaware of the benefits and applications of ToF 3D image sensors, affecting adoption rates.
-
Competition from Alternative Technologies
- Technologies like LiDAR and structured light pose competition to ToF sensors in certain applications, impacting market share.
Market Opportunities
-
Rising Adoption in Automotive Applications
- The integration of ToF sensors in autonomous vehicles and ADAS (Advanced Driver Assistance Systems) presents new growth opportunities.
-
Growth in AI and Machine Learning Integration
- AI-driven applications in consumer electronics are creating new use cases for ToF sensors, driving market expansion.
-
Emerging Markets in Asia-Pacific
- Countries like China, Japan, and South Korea are investing in ToF technology, offering lucrative opportunities for market players.
Market Challenges
-
Technical Limitations and Accuracy Issues
- Challenges like limited range, accuracy in different lighting conditions, and power consumption need to be addressed for wider adoption.
-
Regulatory and Compliance Barriers
- Different regulations in global markets can slow down the adoption of ToF technology in consumer applications.
-
Supply Chain Disruptions
- Component shortages and supply chain issues can impact production and pricing, affecting market growth.
Key Benefits of This Market Research:
- Industry drivers, restraints, and opportunities covered in the study
- Neutral perspective on the market performance
- Recent industry trends and developments
- Competitive landscape & strategies of key players
- Potential & niche segments and regions exhibiting promising growth covered
- Historical, current, and projected market size, in terms of value
- In-depth analysis of the ToF 3D Image Sensor for Consumer Market
- Overview of the regional outlook of the ToF 3D Image Sensor for Consumer Market:
Key Reasons to Buy this Report:
- Access to date statistics compiled by our researchers. These provide you with historical and forecast data, which is analyzed to tell you why your market is set to change
- This enables you to anticipate market changes to remain ahead of your competitors
- You will be able to copy data from the Excel spreadsheet straight into your marketing plans, business presentations, or other strategic documents
- The concise analysis, clear graph, and table format will enable you to pinpoint the information you require quickly
- Provision of market value data for each segment and sub-segment
- Indicates the region and segment that is expected to witness the fastest growth as well as to dominate the market
- Provides insight into the market through Value Chain
- Market dynamics scenario, along with growth opportunities of the market in the years to come
- 6-month post-sales analyst support
Customization of the Report
In case of any queries or customization requirements, please connect with our sales team, who will ensure that your requirements are met.
FAQs
Q: What are the key driving factors and opportunities in the ToF 3D Image Sensor for Consumer Market?
A: The key driving factors include increasing adoption in smartphones, AR/VR applications, and AI-powered consumer electronics. Opportunities lie in automotive, healthcare, and smart home applications.
Q: Which region is projected to have the largest market share?
A: The Asia-Pacific region is expected to dominate the market due to strong demand for ToF sensors in smartphones, gaming, and industrial applications.
Q: Who are the top players in the global ToF 3D Image Sensor for Consumer Market?
A: Leading companies include Infineon Technologies, Texas Instruments, Analog Devices, STMicroelectronics, and AMS, among others.
Q: What are the latest technological advancements in the industry?
A: Innovations include improved accuracy in ToF sensors, miniaturization for compact devices, and AI integration for enhanced object detection and automation.
Q: What is the current size of the global ToF 3D Image Sensor for Consumer Market?
A: The market was valued at USD 109.60 million in 2023 and is projected to reach USD 569.77 million by 2032, growing at a CAGR of 20.10%.

Get Sample Report PDF for Exclusive Insights
Report Sample Includes
- Table of Contents
- List of Tables & Figures
- Charts, Research Methodology, and more...


