Terminal Blocks and Barrier Strips Market, Trends, Business Strategies 2025-2032

Terminal Blocks and Barrier Strips Market was valued at 2433 million in 2024 and is projected to reach US$ 3597 million by 2032, at a CAGR of 6.3% during the forecast period

PDF Icon Download Sample Report PDF
  • Quick Dispatch

    All Orders

  • Secure Payment

    100% Secure Payment

Price range: $1,500.00 through $4,250.00

Clear

MARKET INSIGHTS

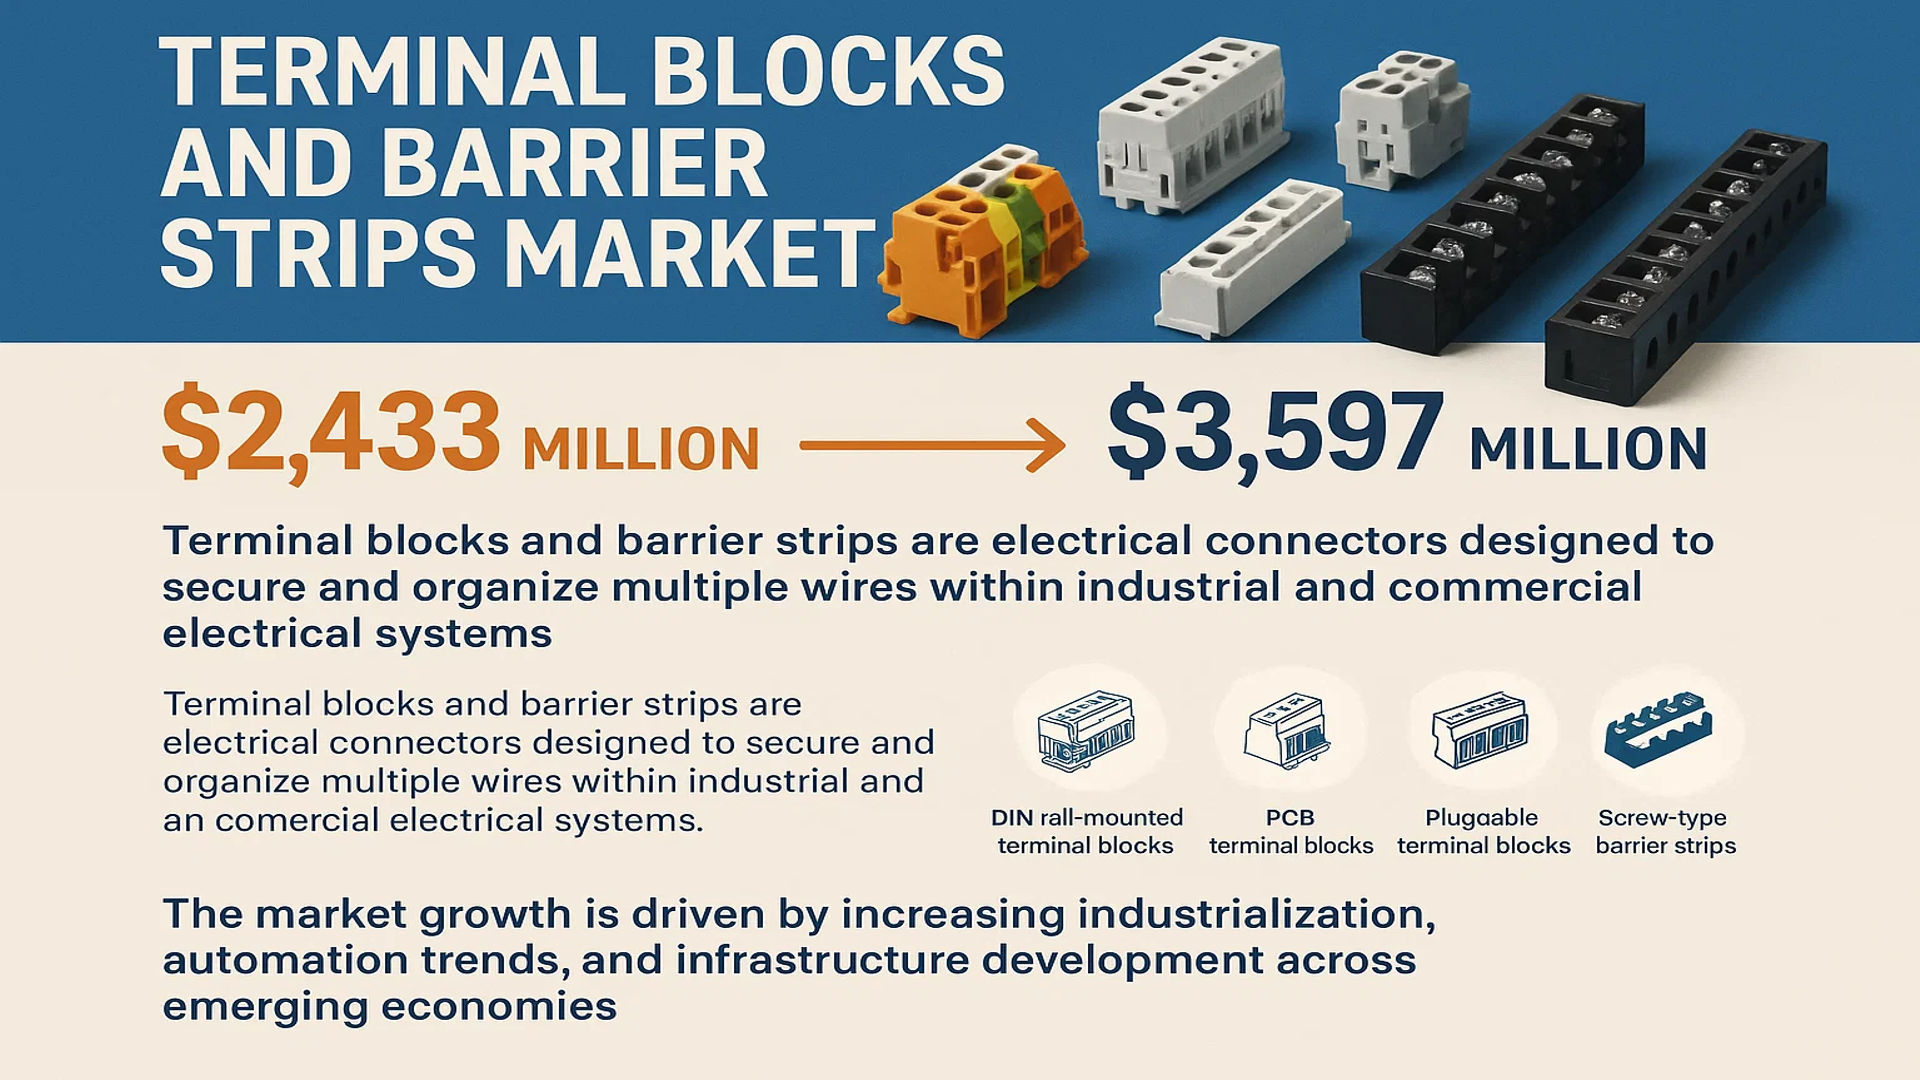
The global Terminal Blocks and Barrier Strips Market was valued at 2433 million in 2024 and is projected to reach US$ 3597 million by 2032, at a CAGR of 6.3% during the forecast period.

Terminal blocks and barrier strips are electrical connectors designed to secure and organize multiple wires within industrial and commercial electrical systems. These components provide safe and reliable connection points for wire termination, distribution, and grounding applications while preventing short circuits and electrical hazards. The product categories include DIN rail-mounted terminal blocks, PCB terminal blocks, pluggable terminal blocks, and screw-type barrier strips, among others.

The market growth is driven by increasing industrialization, automation trends, and infrastructure development across emerging economies. Rising adoption in energy distribution systems and growing demand for modular wiring solutions in manufacturing facilities are key growth drivers. However, the market faces challenges from alternative connection technologies and pricing pressures. Leading manufacturers like Phoenix Contact, WAGO, and Weidmüller are investing in innovative products with higher current ratings and space-saving designs to address evolving industry requirements.

Terminal Blocks and Barrier Strips Market

MARKET DYNAMICS

MARKET DRIVERS

Expansion of Industrial Automation to Accelerate Market Growth

The global push towards Industry 4.0 and smart manufacturing is creating substantial demand for terminal blocks and barrier strips. These components play a critical role in factory automation systems by ensuring secure electrical connections in control panels, motor drives, and PLCs. With industrial automation investments projected to maintain a growth rate exceeding 8% annually, the need for reliable electrical connectivity solutions is intensifying. Terminal blocks offer vibration-resistant connections crucial for harsh industrial environments, while barrier strips provide organized wiring solutions for complex automation systems.

Growth in Renewable Energy Infrastructure to Bolster Demand

The renewable energy sector’s rapid expansion is driving substantial demand for electrical interconnection solutions. Solar farms and wind turbine installations require thousands of terminal connections in junction boxes, combiner panels, and inverter systems. Barrier strips enable efficient parallel connections in solar array wiring, while terminal blocks are essential for safe power distribution in wind turbine control cabinets. With global renewable capacity additions increasing by over 10% annually, the associated growth in electrical interconnection needs presents a significant market opportunity.

Advancements in High-Density Connectivity Solutions

Manufacturers are innovating compact terminal block designs to meet space constraints in modern electrical enclosures. New spring-cage and push-in connection technologies simplify installation while maintaining reliability. These advancements are particularly valuable in applications like telecom cabinets and data center power distribution, where high-density connections are paramount. Leading suppliers have recently introduced terminal blocks with up to 45% space savings compared to traditional designs while maintaining equivalent current ratings.

MARKET RESTRAINTS

Competition from Wireless and Alternative Connection Technologies

While terminal blocks remain essential for many applications, the emergence of wireless control systems and advanced pluggable connectors presents competitive challenges. Some industrial networks are transitioning to wireless I/O modules, reducing the need for traditional terminal blocks in signal connections. However, power distribution applications continue to require robust terminal solutions, particularly in high-current scenarios where wireless alternatives are impractical.

Raw Material Price Volatility Impacting Manufacturing Costs

The terminal block manufacturing process depends on various metals and polymers subject to global commodity price fluctuations. Copper price variations particularly affect production costs, as it’s a primary conductor material. Some manufacturers are responding by developing alternative alloy formulations, though these must maintain the electrical and mechanical properties required for industrial applications. These material challenges are prompting reevaluation of supply chain strategies across the industry.

MARKET CHALLENGES

Compatibility Issues in Legacy System Upgrades

Industrial facilities often face challenges when integrating new terminal block technologies with existing infrastructure. Retrofitting modern high-density terminal blocks into older enclosures sometimes requires costly panel modifications. Some end-users hesitate to upgrade connection systems due to concerns about disrupting operational continuity, particularly in mission-critical applications like power generation or process control.

Increasing Safety and Certification Requirements

Stricter international safety standards are raising the bar for terminal block performance certifications. Products must now meet evolving requirements for creepage distance, flame resistance, and mechanical durability. While these standards improve system safety, they increase development cycles and testing costs for manufacturers. The complexity multiplies when serving global markets with varying regional certification requirements.

MARKET OPPORTUNITIES

Growth Potential in Emerging Economies

Rapid industrialization in developing nations presents significant opportunities for terminal block suppliers. Infrastructure development across Southeast Asia and Africa requires extensive electrical distribution systems. Local manufacturing growth also drives demand for industrial control components. Market penetration strategies must account for price sensitivity in these regions while maintaining product quality expectations.

Integration of Smart Monitoring Capabilities

The convergence of connectivity and power distribution enables new product innovations. “Smart” terminal blocks with integrated current monitoring and temperature sensing capabilities are emerging. These intelligent solutions help prevent electrical failures through predictive maintenance, appealing to facilities prioritizing operational reliability. The development of these advanced products creates differentiation opportunities in a traditionally standardized product category.

Customized Solutions for Niche Applications

Specialized industries such as marine, military, and extreme environment applications require customized terminal solutions. These segments command premium pricing for products meeting stringent environmental and reliability specifications. Manufacturers investing in application-specific R&D can capture these high-value niches while strengthening their technical capabilities for broader markets.

TERMINAL BLOCKS AND BARRIER STRIPS MARKET TRENDS

Increasing Industrial Automation Drives Demand for High-Performance Terminal Blocks

The rapid expansion of industrial automation across multiple sectors, including manufacturing, energy, and transport, is significantly boosting the demand for terminal blocks and barrier strips. These components are critical for ensuring secure and organized wiring systems in automated equipment, control panels, and machinery. In 2024, the industrial segment accounted for approximately 42% of the global terminal blocks market share. Factors such as Industry 4.0 adoption, smart factory development, and the increasing need for modular and scalable electrical connections are accelerating the market growth. Europe and North America are leading contributors due to their advanced manufacturing infrastructure, while the Asia-Pacific region is witnessing the fastest growth, propelled by expanding industrial bases in China and India.

Other Trends

Miniaturization and Space-Saving Designs

The trend toward miniaturization in electronics and electrical systems is shaping the terminal block market. Compact designs, such as pluggable and high-density terminal blocks, are increasingly preferred in applications where space constraints exist, such as automotive control units, consumer electronics, and renewable energy systems. Manufacturers are innovating to develop lightweight yet durable solutions that maintain high current-carrying capacity while reducing footprint. This shift is particularly evident in the automotive sector, where electric vehicles (EVs) necessitate efficient and space-saving wiring components to accommodate complex battery management systems.

Growing Adoption of Renewable Energy Systems

The global push toward clean energy is another major driver for the terminal blocks and barrier strips market. Renewable energy installations, including solar and wind power systems, require robust and corrosion-resistant electrical connections capable of withstanding harsh environmental conditions. Barrier strips with high ingress protection (IP) ratings are increasingly used in photovoltaic arrays, inverters, and energy storage systems. The renewable energy sector is projected to contribute over 18% to the terminal blocks market revenue by 2032, with the solar energy segment leading demand. Emerging economies in Asia and Latin America are rapidly increasing renewable capacity, creating new opportunities for terminal block suppliers.

Smart Buildings and IoT Integration

The proliferation of smart buildings and IoT (Internet of Things) technologies is revolutionizing the terminal block market. Modern building automation systems rely on intelligent terminal blocks that facilitate data transmission alongside power distribution. Features like push-in connectivity and tool-less installation are gaining traction as they reduce installation time and maintenance costs in commercial and residential buildings. The smart building market is expected to expand at a CAGR of 9.1% from 2024 to 2032, further driving innovation in terminal block designs that support digital communication protocols. North America and Europe remain dominant markets due to stringent energy efficiency regulations and high adoption of smart infrastructure.

COMPETITIVE LANDSCAPE

Key Industry Players

Global Market Leaders Innovate to Address Rising Demand for Reliable Electrical Connectivity

The global terminal blocks and barrier strips market features a combination of established multinational corporations and regional specialists competing across multiple industries. Phoenix Contact leads the market with an extensive product portfolio and strong presence across automation, energy, and infrastructure applications. The company reinforced its position in 2024 through strategic acquisitions in North America and the launch of next-generation spring-cage terminal blocks.

WAGO GmbH & Co. KG and Weidmüller Interface GmbH & Co. KG maintain robust market positions through continuous innovation in modular connection technologies. Both German manufacturers have recently expanded their barrier strip offerings with IP68-rated solutions for harsh environments, catering to growing industrial automation demands.

Meanwhile, several companies are focusing on smart connectivity solutions, recognizing the industry’s shift toward IoT-enabled electrical distribution. TE Connectivity introduced its CONNEXIS™ networked terminal blocks in 2023, while ABB Ltd. integrated sensor technology into its terminal block lineup, demonstrating how traditional components are evolving for Industry 4.0 applications.

American competitors Molex LLC and Eaton Corporation are strengthening their market positions through vertical integration strategies. Both companies have recently enhanced their manufacturing capabilities for high-voltage barrier strips, targeting renewable energy and data center markets where safety certifications are paramount.

List of Key Terminal Blocks and Barrier Strips Manufacturers

The competitive environment continues evolving with regional players expanding globally, particularly Asian manufacturers investing in R&D to challenge European dominance in high-end terminal block solutions. Recent patent filings indicate intensifying innovation across smart connectivity features and materials science, suggesting the competitive landscape will remain dynamic throughout the forecast period.

Segment Analysis:

By Type

Terminal Blocks Segment Leads Due to High Adoption in Industrial and Commercial Applications

The market is segmented based on type into:

  • Terminal Blocks
    • Subtypes: Barrier Terminal Blocks, DIN Rail Terminal Blocks, PCB Terminal Blocks, and Others
  • Barrier Strips

By Application

Industrial Segment Dominates Owing to Wide Usage in Automation and Control Systems

The market is segmented based on application into:

  • Industrial
  • Communications
  • Healthcare
  • Financial
  • Others

By Mounting Type

DIN Rail Mounting is Preferred for Its Secure and Organized Wiring Solutions

The market is segmented based on mounting type into:

  • DIN Rail Mounting
  • Panel Mounting
  • PCB Mounting
  • Others

By End User

Manufacturing Sector Leads Due to Rising Automation and Electrical Infrastructure Needs

The market is segmented based on end user into:

  • Manufacturing
  • Telecommunications
  • Energy & Power
  • Transportation
  • Others

Regional Analysis: Terminal Blocks and Barrier Strips Market

Asia-Pacific
The Asia-Pacific region dominates the global terminal blocks and barrier strips market, accounting for the largest revenue share. This growth is primarily driven by rapid industrialization, urbanization, and infrastructure development in countries like China, India, and Japan. The region benefits from strong manufacturing bases in electronics, automotive, and energy sectors – all of which are key consumers of terminal blocks. China’s ‘Made in China 2025’ initiative has particularly boosted demand for high-quality electrical components. However, price sensitivity in emerging markets remains a challenge for premium product adoption.

North America
North America represents a mature yet innovation-driven market for terminal blocks and barrier strips. Strict safety regulations (UL certification standards) and the need for reliable power distribution in industrial automation push demand for advanced connectivity solutions. The U.S. market benefits from strong industrial and commercial construction activities, with growing emphasis on modular and maintenance-friendly designs. Recent infrastructure investments in renewable energy projects are creating new opportunities for specialized terminal block applications in solar and wind power installations.

Europe
Europe maintains a steady market position characterized by technological sophistication and stringent quality requirements. German engineering excellence drives innovation in terminal block design, particularly for industrial automation applications. The region’s focus on energy efficiency and smart manufacturing (Industry 4.0) increases demand for intelligent terminal solutions with diagnostic capabilities. However, market growth faces some constraints from economic stagnation in certain countries and the high penetration of existing installed base equipment.

South America
The South American market shows moderate growth potential, primarily driven by Brazil’s industrial sector and mining activities. While the market remains price-sensitive, increasing electrification projects and efforts to upgrade aging infrastructure create opportunities for terminal block suppliers. Political and economic instability in some countries continues to impact investment decisions, causing uneven growth patterns across the region. Local manufacturers face strong competition from Asian imports in the low-to-mid range product segments.

Middle East & Africa
This emerging market benefits from large-scale infrastructure projects in Gulf Cooperation Council (GCC) countries, particularly in commercial construction and oil/gas applications. The UAE and Saudi Arabia lead in adopting advanced terminal solutions for harsh environment applications. However, markets in Africa develop more slowly due to limited industrialization and unreliable power infrastructure. The region’s growth prospects remain tied to economic diversification plans and foreign investment in energy and construction projects.

Market Leaders’ Insight
Phoenix Contact and Weidmüller continue to dominate the premium segment globally, while Asian manufacturers like CHINT and Dinkle Electronics capture significant market share in cost-sensitive regions. The competitive landscape shows increasing consolidation as major players acquire regional manufacturers to expand their product portfolios and geographic reach.

Report Scope

This market research report provides a comprehensive analysis of the global Terminal Blocks and Barrier Strips market, covering the forecast period 2024–2032. It offers detailed insights into market dynamics, technological advancements, competitive landscape, and key trends shaping the industry.

Key focus areas of the report include:

  • Market Size & Forecast: Historical data and future projections for revenue, unit shipments, and market value across major regions and segments. The global Terminal Blocks and Barrier Strips market was valued at USD 2,433 million in 2024 and is projected to reach USD 3,597 million by 2032, growing at a CAGR of 6.3%.
  • Segmentation Analysis: Detailed breakdown by product type (Terminal Blocks, Barrier Strips), application (Communications, Financial, Industrial, Healthcare, Others), and end-user industry to identify high-growth segments and investment opportunities.
  • Regional Outlook: Insights into market performance across North America, Europe, Asia-Pacific, Latin America, and the Middle East & Africa, including country-level analysis where relevant. Asia-Pacific dominates the market due to rapid industrialization, while North America and Europe remain key revenue generators.
  • Competitive Landscape: Profiles of leading market participants, including their product offerings, R&D focus, manufacturing capacity, pricing strategies, and recent developments such as mergers, acquisitions, and partnerships. Key players include Phoenix Contact, WAGO GmbH & Co. KG, Weidmüller Interface GmbH & Co. KG, TE Connectivity, and ABB Ltd.
  • Technology Trends & Innovation: Assessment of emerging technologies, including smart terminal blocks with IoT integration, high-current handling capabilities, and fire-resistant materials.
  • Market Drivers & Restraints: Evaluation of factors driving market growth, such as industrial automation and renewable energy investments, along with challenges like supply chain disruptions and raw material price volatility.
  • Stakeholder Analysis: Insights for component suppliers, OEMs, system integrators, investors, and policymakers regarding the evolving ecosystem and strategic opportunities in the electrical connectivity solutions market.

Primary and secondary research methods are employed, including interviews with industry experts, data from verified sources, and real-time market intelligence to ensure the accuracy and reliability of the insights presented.

FREQUENTLY ASKED QUESTIONS:

What is the current market size of Global Terminal Blocks and Barrier Strips Market?

-> Terminal Blocks and Barrier Strips Market was valued at 2433 million in 2024 and is projected to reach US$ 3597 million by 2032, at a CAGR of 6.3% during the forecast period.

Which key companies operate in Global Terminal Blocks and Barrier Strips Market?

-> Key players include Phoenix Contact, WAGO GmbH & Co. KG, Weidmüller Interface GmbH & Co. KG, TE Connectivity, ABB Ltd., Molex LLC, Omron Corporation, Eaton Corporation, Schneider Electric, and Altech Corporation.

What are the key growth drivers?

-> Key growth drivers include industrial automation, renewable energy projects, smart grid deployments, and increasing demand for safe electrical connectivity solutions across various industries.

Which region dominates the market?

-> Asia-Pacific is the fastest-growing region due to rapid industrialization, while Europe and North America maintain strong market positions with advanced manufacturing sectors.

What are the emerging trends?

-> Emerging trends include miniaturization of terminal blocks, smart connectivity solutions with integrated diagnostics, and development of eco-friendly materials to meet sustainability requirements.

Terminal Blocks and Barrier Strips Market, Trends, Business Strategies 2025-2032

Get Sample Report PDF for Exclusive Insights

Report Sample Includes

  • Table of Contents
  • List of Tables & Figures
  • Charts, Research Methodology, and more...
PDF Icon Download Sample Report PDF

Download Sample Report

Table of Content

1 Introduction to Research & Analysis Reports
1.1 Terminal Blocks and Barrier Strips Market Definition
1.2 Market Segments
1.2.1 Segment by Type
1.2.2 Segment by Application
1.3 Global Terminal Blocks and Barrier Strips Market Overview
1.4 Features & Benefits of This Report
1.5 Methodology & Sources of Information
1.5.1 Research Methodology
1.5.2 Research Process
1.5.3 Base Year
1.5.4 Report Assumptions & Caveats
2 Global Terminal Blocks and Barrier Strips Overall Market Size
2.1 Global Terminal Blocks and Barrier Strips Market Size: 2024 VS 2032
2.2 Global Terminal Blocks and Barrier Strips Market Size, Prospects & Forecasts: 2020-2032
2.3 Global Terminal Blocks and Barrier Strips Sales: 2020-2032
3 Company Landscape
3.1 Top Terminal Blocks and Barrier Strips Players in Global Market
3.2 Top Global Terminal Blocks and Barrier Strips Companies Ranked by Revenue
3.3 Global Terminal Blocks and Barrier Strips Revenue by Companies
3.4 Global Terminal Blocks and Barrier Strips Sales by Companies
3.5 Global Terminal Blocks and Barrier Strips Price by Manufacturer (2020-2025)
3.6 Top 3 and Top 5 Terminal Blocks and Barrier Strips Companies in Global Market, by Revenue in 2024
3.7 Global Manufacturers Terminal Blocks and Barrier Strips Product Type
3.8 Tier 1, Tier 2, and Tier 3 Terminal Blocks and Barrier Strips Players in Global Market
3.8.1 List of Global Tier 1 Terminal Blocks and Barrier Strips Companies
3.8.2 List of Global Tier 2 and Tier 3 Terminal Blocks and Barrier Strips Companies
4 Sights by Product
4.1 Overview
4.1.1 Segment by Type – Global Terminal Blocks and Barrier Strips Market Size Markets, 2024 & 2032
4.1.2 Terminal Blocks
4.1.3 Barrier Strips
4.2 Segment by Type – Global Terminal Blocks and Barrier Strips Revenue & Forecasts
4.2.1 Segment by Type – Global Terminal Blocks and Barrier Strips Revenue, 2020-2025
4.2.2 Segment by Type – Global Terminal Blocks and Barrier Strips Revenue, 2026-2032
4.2.3 Segment by Type – Global Terminal Blocks and Barrier Strips Revenue Market Share, 2020-2032
4.3 Segment by Type – Global Terminal Blocks and Barrier Strips Sales & Forecasts
4.3.1 Segment by Type – Global Terminal Blocks and Barrier Strips Sales, 2020-2025
4.3.2 Segment by Type – Global Terminal Blocks and Barrier Strips Sales, 2026-2032
4.3.3 Segment by Type – Global Terminal Blocks and Barrier Strips Sales Market Share, 2020-2032
4.4 Segment by Type – Global Terminal Blocks and Barrier Strips Price (Manufacturers Selling Prices), 2020-2032
5 Sights by Application
5.1 Overview
5.1.1 Segment by Application – Global Terminal Blocks and Barrier Strips Market Size, 2024 & 2032
5.1.2 Communications
5.1.3 Financial
5.1.4 Industrial
5.1.5 Healthcare
5.1.6 Others
5.2 Segment by Application – Global Terminal Blocks and Barrier Strips Revenue & Forecasts
5.2.1 Segment by Application – Global Terminal Blocks and Barrier Strips Revenue, 2020-2025
5.2.2 Segment by Application – Global Terminal Blocks and Barrier Strips Revenue, 2026-2032
5.2.3 Segment by Application – Global Terminal Blocks and Barrier Strips Revenue Market Share, 2020-2032
5.3 Segment by Application – Global Terminal Blocks and Barrier Strips Sales & Forecasts
5.3.1 Segment by Application – Global Terminal Blocks and Barrier Strips Sales, 2020-2025
5.3.2 Segment by Application – Global Terminal Blocks and Barrier Strips Sales, 2026-2032
5.3.3 Segment by Application – Global Terminal Blocks and Barrier Strips Sales Market Share, 2020-2032
5.4 Segment by Application – Global Terminal Blocks and Barrier Strips Price (Manufacturers Selling Prices), 2020-2032
6 Sights by Region
6.1 By Region – Global Terminal Blocks and Barrier Strips Market Size, 2024 & 2032
6.2 By Region – Global Terminal Blocks and Barrier Strips Revenue & Forecasts
6.2.1 By Region – Global Terminal Blocks and Barrier Strips Revenue, 2020-2025
6.2.2 By Region – Global Terminal Blocks and Barrier Strips Revenue, 2026-2032
6.2.3 By Region – Global Terminal Blocks and Barrier Strips Revenue Market Share, 2020-2032
6.3 By Region – Global Terminal Blocks and Barrier Strips Sales & Forecasts
6.3.1 By Region – Global Terminal Blocks and Barrier Strips Sales, 2020-2025
6.3.2 By Region – Global Terminal Blocks and Barrier Strips Sales, 2026-2032
6.3.3 By Region – Global Terminal Blocks and Barrier Strips Sales Market Share, 2020-2032
6.4 North America
6.4.1 By Country – North America Terminal Blocks and Barrier Strips Revenue, 2020-2032
6.4.2 By Country – North America Terminal Blocks and Barrier Strips Sales, 2020-2032
6.4.3 United States Terminal Blocks and Barrier Strips Market Size, 2020-2032
6.4.4 Canada Terminal Blocks and Barrier Strips Market Size, 2020-2032
6.4.5 Mexico Terminal Blocks and Barrier Strips Market Size, 2020-2032
6.5 Europe
6.5.1 By Country – Europe Terminal Blocks and Barrier Strips Revenue, 2020-2032
6.5.2 By Country – Europe Terminal Blocks and Barrier Strips Sales, 2020-2032
6.5.3 Germany Terminal Blocks and Barrier Strips Market Size, 2020-2032
6.5.4 France Terminal Blocks and Barrier Strips Market Size, 2020-2032
6.5.5 U.K. Terminal Blocks and Barrier Strips Market Size, 2020-2032
6.5.6 Italy Terminal Blocks and Barrier Strips Market Size, 2020-2032
6.5.7 Russia Terminal Blocks and Barrier Strips Market Size, 2020-2032
6.5.8 Nordic Countries Terminal Blocks and Barrier Strips Market Size, 2020-2032
6.5.9 Benelux Terminal Blocks and Barrier Strips Market Size, 2020-2032
6.6 Asia
6.6.1 By Region – Asia Terminal Blocks and Barrier Strips Revenue, 2020-2032
6.6.2 By Region – Asia Terminal Blocks and Barrier Strips Sales, 2020-2032
6.6.3 China Terminal Blocks and Barrier Strips Market Size, 2020-2032
6.6.4 Japan Terminal Blocks and Barrier Strips Market Size, 2020-2032
6.6.5 South Korea Terminal Blocks and Barrier Strips Market Size, 2020-2032
6.6.6 Southeast Asia Terminal Blocks and Barrier Strips Market Size, 2020-2032
6.6.7 India Terminal Blocks and Barrier Strips Market Size, 2020-2032
6.7 South America
6.7.1 By Country – South America Terminal Blocks and Barrier Strips Revenue, 2020-2032
6.7.2 By Country – South America Terminal Blocks and Barrier Strips Sales, 2020-2032
6.7.3 Brazil Terminal Blocks and Barrier Strips Market Size, 2020-2032
6.7.4 Argentina Terminal Blocks and Barrier Strips Market Size, 2020-2032
6.8 Middle East & Africa
6.8.1 By Country – Middle East & Africa Terminal Blocks and Barrier Strips Revenue, 2020-2032
6.8.2 By Country – Middle East & Africa Terminal Blocks and Barrier Strips Sales, 2020-2032
6.8.3 Turkey Terminal Blocks and Barrier Strips Market Size, 2020-2032
6.8.4 Israel Terminal Blocks and Barrier Strips Market Size, 2020-2032
6.8.5 Saudi Arabia Terminal Blocks and Barrier Strips Market Size, 2020-2032
6.8.6 UAE Terminal Blocks and Barrier Strips Market Size, 2020-2032
7 Manufacturers & Brands Profiles
7.1 Phoenix Contact
7.1.1 Phoenix Contact Company Summary
7.1.2 Phoenix Contact Business Overview
7.1.3 Phoenix Contact Terminal Blocks and Barrier Strips Major Product Offerings
7.1.4 Phoenix Contact Terminal Blocks and Barrier Strips Sales and Revenue in Global (2020-2025)
7.1.5 Phoenix Contact Key News & Latest Developments
7.2 WAGO GmbH & Co. KG
7.2.1 WAGO GmbH & Co. KG Company Summary
7.2.2 WAGO GmbH & Co. KG Business Overview
7.2.3 WAGO GmbH & Co. KG Terminal Blocks and Barrier Strips Major Product Offerings
7.2.4 WAGO GmbH & Co. KG Terminal Blocks and Barrier Strips Sales and Revenue in Global (2020-2025)
7.2.5 WAGO GmbH & Co. KG Key News & Latest Developments
7.3 Weidmüller Interface GmbH & Co. KG
7.3.1 Weidmüller Interface GmbH & Co. KG Company Summary
7.3.2 Weidmüller Interface GmbH & Co. KG Business Overview
7.3.3 Weidmüller Interface GmbH & Co. KG Terminal Blocks and Barrier Strips Major Product Offerings
7.3.4 Weidmüller Interface GmbH & Co. KG Terminal Blocks and Barrier Strips Sales and Revenue in Global (2020-2025)
7.3.5 Weidmüller Interface GmbH & Co. KG Key News & Latest Developments
7.4 TE Connectivity
7.4.1 TE Connectivity Company Summary
7.4.2 TE Connectivity Business Overview
7.4.3 TE Connectivity Terminal Blocks and Barrier Strips Major Product Offerings
7.4.4 TE Connectivity Terminal Blocks and Barrier Strips Sales and Revenue in Global (2020-2025)
7.4.5 TE Connectivity Key News & Latest Developments
7.5 ABB Ltd.
7.5.1 ABB Ltd. Company Summary
7.5.2 ABB Ltd. Business Overview
7.5.3 ABB Ltd. Terminal Blocks and Barrier Strips Major Product Offerings
7.5.4 ABB Ltd. Terminal Blocks and Barrier Strips Sales and Revenue in Global (2020-2025)
7.5.5 ABB Ltd. Key News & Latest Developments
7.6 Molex LLC
7.6.1 Molex LLC Company Summary
7.6.2 Molex LLC Business Overview
7.6.3 Molex LLC Terminal Blocks and Barrier Strips Major Product Offerings
7.6.4 Molex LLC Terminal Blocks and Barrier Strips Sales and Revenue in Global (2020-2025)
7.6.5 Molex LLC Key News & Latest Developments
7.7 Omron Corporation
7.7.1 Omron Corporation Company Summary
7.7.2 Omron Corporation Business Overview
7.7.3 Omron Corporation Terminal Blocks and Barrier Strips Major Product Offerings
7.7.4 Omron Corporation Terminal Blocks and Barrier Strips Sales and Revenue in Global (2020-2025)
7.7.5 Omron Corporation Key News & Latest Developments
7.8 Eaton Corporation
7.8.1 Eaton Corporation Company Summary
7.8.2 Eaton Corporation Business Overview
7.8.3 Eaton Corporation Terminal Blocks and Barrier Strips Major Product Offerings
7.8.4 Eaton Corporation Terminal Blocks and Barrier Strips Sales and Revenue in Global (2020-2025)
7.8.5 Eaton Corporation Key News & Latest Developments
7.9 Schneider Electric
7.9.1 Schneider Electric Company Summary
7.9.2 Schneider Electric Business Overview
7.9.3 Schneider Electric Terminal Blocks and Barrier Strips Major Product Offerings
7.9.4 Schneider Electric Terminal Blocks and Barrier Strips Sales and Revenue in Global (2020-2025)
7.9.5 Schneider Electric Key News & Latest Developments
7.10 Altech Corporation
7.10.1 Altech Corporation Company Summary
7.10.2 Altech Corporation Business Overview
7.10.3 Altech Corporation Terminal Blocks and Barrier Strips Major Product Offerings
7.10.4 Altech Corporation Terminal Blocks and Barrier Strips Sales and Revenue in Global (2020-2025)
7.10.5 Altech Corporation Key News & Latest Developments
8 Global Terminal Blocks and Barrier Strips Production Capacity, Analysis
8.1 Global Terminal Blocks and Barrier Strips Production Capacity, 2020-2032
8.2 Terminal Blocks and Barrier Strips Production Capacity of Key Manufacturers in Global Market
8.3 Global Terminal Blocks and Barrier Strips Production by Region
9 Key Market Trends, Opportunity, Drivers and Restraints
9.1 Market Opportunities & Trends
9.2 Market Drivers
9.3 Market Restraints
10 Terminal Blocks and Barrier Strips Supply Chain Analysis
10.1 Terminal Blocks and Barrier Strips Industry Value Chain
10.2 Terminal Blocks and Barrier Strips Upstream Market
10.3 Terminal Blocks and Barrier Strips Downstream and Clients
10.4 Marketing Channels Analysis
10.4.1 Marketing Channels
10.4.2 Terminal Blocks and Barrier Strips Distributors and Sales Agents in Global
11 Conclusion
12 Appendix
12.1 Note
12.2 Examples of Clients
12.3 DisclaimerList of Tables
Table 1. Key Players of Terminal Blocks and Barrier Strips in Global Market
Table 2. Top Terminal Blocks and Barrier Strips Players in Global Market, Ranking by Revenue (2024)
Table 3. Global Terminal Blocks and Barrier Strips Revenue by Companies, (US$, Mn), 2020-2025
Table 4. Global Terminal Blocks and Barrier Strips Revenue Share by Companies, 2020-2025
Table 5. Global Terminal Blocks and Barrier Strips Sales by Companies, (K Units), 2020-2025
Table 6. Global Terminal Blocks and Barrier Strips Sales Share by Companies, 2020-2025
Table 7. Key Manufacturers Terminal Blocks and Barrier Strips Price (2020-2025) & (US$/Unit)
Table 8. Global Manufacturers Terminal Blocks and Barrier Strips Product Type
Table 9. List of Global Tier 1 Terminal Blocks and Barrier Strips Companies, Revenue (US$, Mn) in 2024 and Market Share
Table 10. List of Global Tier 2 and Tier 3 Terminal Blocks and Barrier Strips Companies, Revenue (US$, Mn) in 2024 and Market Share
Table 11. Segment by Type – Global Terminal Blocks and Barrier Strips Revenue, (US$, Mn), 2024 & 2032
Table 12. Segment by Type – Global Terminal Blocks and Barrier Strips Revenue (US$, Mn), 2020-2025
Table 13. Segment by Type – Global Terminal Blocks and Barrier Strips Revenue (US$, Mn), 2026-2032
Table 14. Segment by Type – Global Terminal Blocks and Barrier Strips Sales (K Units), 2020-2025
Table 15. Segment by Type – Global Terminal Blocks and Barrier Strips Sales (K Units), 2026-2032
Table 16. Segment by Application – Global Terminal Blocks and Barrier Strips Revenue, (US$, Mn), 2024 & 2032
Table 17. Segment by Application – Global Terminal Blocks and Barrier Strips Revenue, (US$, Mn), 2020-2025
Table 18. Segment by Application – Global Terminal Blocks and Barrier Strips Revenue, (US$, Mn), 2026-2032
Table 19. Segment by Application – Global Terminal Blocks and Barrier Strips Sales, (K Units), 2020-2025
Table 20. Segment by Application – Global Terminal Blocks and Barrier Strips Sales, (K Units), 2026-2032
Table 21. By Region – Global Terminal Blocks and Barrier Strips Revenue, (US$, Mn), 2025-2032
Table 22. By Region – Global Terminal Blocks and Barrier Strips Revenue, (US$, Mn), 2020-2025
Table 23. By Region – Global Terminal Blocks and Barrier Strips Revenue, (US$, Mn), 2026-2032
Table 24. By Region – Global Terminal Blocks and Barrier Strips Sales, (K Units), 2020-2025
Table 25. By Region – Global Terminal Blocks and Barrier Strips Sales, (K Units), 2026-2032
Table 26. By Country – North America Terminal Blocks and Barrier Strips Revenue, (US$, Mn), 2020-2025
Table 27. By Country – North America Terminal Blocks and Barrier Strips Revenue, (US$, Mn), 2026-2032
Table 28. By Country – North America Terminal Blocks and Barrier Strips Sales, (K Units), 2020-2025
Table 29. By Country – North America Terminal Blocks and Barrier Strips Sales, (K Units), 2026-2032
Table 30. By Country – Europe Terminal Blocks and Barrier Strips Revenue, (US$, Mn), 2020-2025
Table 31. By Country – Europe Terminal Blocks and Barrier Strips Revenue, (US$, Mn), 2026-2032
Table 32. By Country – Europe Terminal Blocks and Barrier Strips Sales, (K Units), 2020-2025
Table 33. By Country – Europe Terminal Blocks and Barrier Strips Sales, (K Units), 2026-2032
Table 34. By Region – Asia Terminal Blocks and Barrier Strips Revenue, (US$, Mn), 2020-2025
Table 35. By Region – Asia Terminal Blocks and Barrier Strips Revenue, (US$, Mn), 2026-2032
Table 36. By Region – Asia Terminal Blocks and Barrier Strips Sales, (K Units), 2020-2025
Table 37. By Region – Asia Terminal Blocks and Barrier Strips Sales, (K Units), 2026-2032
Table 38. By Country – South America Terminal Blocks and Barrier Strips Revenue, (US$, Mn), 2020-2025
Table 39. By Country – South America Terminal Blocks and Barrier Strips Revenue, (US$, Mn), 2026-2032
Table 40. By Country – South America Terminal Blocks and Barrier Strips Sales, (K Units), 2020-2025
Table 41. By Country – South America Terminal Blocks and Barrier Strips Sales, (K Units), 2026-2032
Table 42. By Country – Middle East & Africa Terminal Blocks and Barrier Strips Revenue, (US$, Mn), 2020-2025
Table 43. By Country – Middle East & Africa Terminal Blocks and Barrier Strips Revenue, (US$, Mn), 2026-2032
Table 44. By Country – Middle East & Africa Terminal Blocks and Barrier Strips Sales, (K Units), 2020-2025
Table 45. By Country – Middle East & Africa Terminal Blocks and Barrier Strips Sales, (K Units), 2026-2032
Table 46. Phoenix Contact Company Summary
Table 47. Phoenix Contact Terminal Blocks and Barrier Strips Product Offerings
Table 48. Phoenix Contact Terminal Blocks and Barrier Strips Sales (K Units), Revenue (US$, Mn) and Average Price (US$/Unit) & (2020-2025)
Table 49. Phoenix Contact Key News & Latest Developments
Table 50. WAGO GmbH & Co. KG Company Summary
Table 51. WAGO GmbH & Co. KG Terminal Blocks and Barrier Strips Product Offerings
Table 52. WAGO GmbH & Co. KG Terminal Blocks and Barrier Strips Sales (K Units), Revenue (US$, Mn) and Average Price (US$/Unit) & (2020-2025)
Table 53. WAGO GmbH & Co. KG Key News & Latest Developments
Table 54. Weidmüller Interface GmbH & Co. KG Company Summary
Table 55. Weidmüller Interface GmbH & Co. KG Terminal Blocks and Barrier Strips Product Offerings
Table 56. Weidmüller Interface GmbH & Co. KG Terminal Blocks and Barrier Strips Sales (K Units), Revenue (US$, Mn) and Average Price (US$/Unit) & (2020-2025)
Table 57. Weidmüller Interface GmbH & Co. KG Key News & Latest Developments
Table 58. TE Connectivity Company Summary
Table 59. TE Connectivity Terminal Blocks and Barrier Strips Product Offerings
Table 60. TE Connectivity Terminal Blocks and Barrier Strips Sales (K Units), Revenue (US$, Mn) and Average Price (US$/Unit) & (2020-2025)
Table 61. TE Connectivity Key News & Latest Developments
Table 62. ABB Ltd. Company Summary
Table 63. ABB Ltd. Terminal Blocks and Barrier Strips Product Offerings
Table 64. ABB Ltd. Terminal Blocks and Barrier Strips Sales (K Units), Revenue (US$, Mn) and Average Price (US$/Unit) & (2020-2025)
Table 65. ABB Ltd. Key News & Latest Developments
Table 66. Molex LLC Company Summary
Table 67. Molex LLC Terminal Blocks and Barrier Strips Product Offerings
Table 68. Molex LLC Terminal Blocks and Barrier Strips Sales (K Units), Revenue (US$, Mn) and Average Price (US$/Unit) & (2020-2025)
Table 69. Molex LLC Key News & Latest Developments
Table 70. Omron Corporation Company Summary
Table 71. Omron Corporation Terminal Blocks and Barrier Strips Product Offerings
Table 72. Omron Corporation Terminal Blocks and Barrier Strips Sales (K Units), Revenue (US$, Mn) and Average Price (US$/Unit) & (2020-2025)
Table 73. Omron Corporation Key News & Latest Developments
Table 74. Eaton Corporation Company Summary
Table 75. Eaton Corporation Terminal Blocks and Barrier Strips Product Offerings
Table 76. Eaton Corporation Terminal Blocks and Barrier Strips Sales (K Units), Revenue (US$, Mn) and Average Price (US$/Unit) & (2020-2025)
Table 77. Eaton Corporation Key News & Latest Developments
Table 78. Schneider Electric Company Summary
Table 79. Schneider Electric Terminal Blocks and Barrier Strips Product Offerings
Table 80. Schneider Electric Terminal Blocks and Barrier Strips Sales (K Units), Revenue (US$, Mn) and Average Price (US$/Unit) & (2020-2025)
Table 81. Schneider Electric Key News & Latest Developments
Table 82. Altech Corporation Company Summary
Table 83. Altech Corporation Terminal Blocks and Barrier Strips Product Offerings
Table 84. Altech Corporation Terminal Blocks and Barrier Strips Sales (K Units), Revenue (US$, Mn) and Average Price (US$/Unit) & (2020-2025)
Table 85. Altech Corporation Key News & Latest Developments
Table 86. Terminal Blocks and Barrier Strips Capacity of Key Manufacturers in Global Market, 2023-2025 (K Units)
Table 87. Global Terminal Blocks and Barrier Strips Capacity Market Share of Key Manufacturers, 2023-2025
Table 88. Global Terminal Blocks and Barrier Strips Production by Region, 2020-2025 (K Units)
Table 89. Global Terminal Blocks and Barrier Strips Production by Region, 2026-2032 (K Units)
Table 90. Terminal Blocks and Barrier Strips Market Opportunities & Trends in Global Market
Table 91. Terminal Blocks and Barrier Strips Market Drivers in Global Market
Table 92. Terminal Blocks and Barrier Strips Market Restraints in Global Market
Table 93. Terminal Blocks and Barrier Strips Raw Materials
Table 94. Terminal Blocks and Barrier Strips Raw Materials Suppliers in Global Market
Table 95. Typical Terminal Blocks and Barrier Strips Downstream
Table 96. Terminal Blocks and Barrier Strips Downstream Clients in Global Market
Table 97. Terminal Blocks and Barrier Strips Distributors and Sales Agents in Global Market

List of Figures
Figure 1. Terminal Blocks and Barrier Strips Product Picture
Figure 2. Terminal Blocks and Barrier Strips Segment by Type in 2024
Figure 3. Terminal Blocks and Barrier Strips Segment by Application in 2024
Figure 4. Global Terminal Blocks and Barrier Strips Market Overview: 2024
Figure 5. Key Caveats
Figure 6. Global Terminal Blocks and Barrier Strips Market Size: 2024 VS 2032 (US$, Mn)
Figure 7. Global Terminal Blocks and Barrier Strips Revenue: 2020-2032 (US$, Mn)
Figure 8. Terminal Blocks and Barrier Strips Sales in Global Market: 2020-2032 (K Units)
Figure 9. The Top 3 and 5 Players Market Share by Terminal Blocks and Barrier Strips Revenue in 2024
Figure 10. Segment by Type – Global Terminal Blocks and Barrier Strips Revenue, (US$, Mn), 2024 & 2032
Figure 11. Segment by Type – Global Terminal Blocks and Barrier Strips Revenue Market Share, 2020-2032
Figure 12. Segment by Type – Global Terminal Blocks and Barrier Strips Sales Market Share, 2020-2032
Figure 13. Segment by Type – Global Terminal Blocks and Barrier Strips Price (US$/Unit), 2020-2032
Figure 14. Segment by Application – Global Terminal Blocks and Barrier Strips Revenue, (US$, Mn), 2024 & 2032
Figure 15. Segment by Application – Global Terminal Blocks and Barrier Strips Revenue Market Share, 2020-2032
Figure 16. Segment by Application – Global Terminal Blocks and Barrier Strips Sales Market Share, 2020-2032
Figure 17. Segment by Application -Global Terminal Blocks and Barrier Strips Price (US$/Unit), 2020-2032
Figure 18. By Region – Global Terminal Blocks and Barrier Strips Revenue, (US$, Mn), 2025 & 2032
Figure 19. By Region – Global Terminal Blocks and Barrier Strips Revenue Market Share, 2020 VS 2024 VS 2032
Figure 20. By Region – Global Terminal Blocks and Barrier Strips Revenue Market Share, 2020-2032
Figure 21. By Region – Global Terminal Blocks and Barrier Strips Sales Market Share, 2020-2032
Figure 22. By Country – North America Terminal Blocks and Barrier Strips Revenue Market Share, 2020-2032
Figure 23. By Country – North America Terminal Blocks and Barrier Strips Sales Market Share, 2020-2032
Figure 24. United States Terminal Blocks and Barrier Strips Revenue, (US$, Mn), 2020-2032
Figure 25. Canada Terminal Blocks and Barrier Strips Revenue, (US$, Mn), 2020-2032
Figure 26. Mexico Terminal Blocks and Barrier Strips Revenue, (US$, Mn), 2020-2032
Figure 27. By Country – Europe Terminal Blocks and Barrier Strips Revenue Market Share, 2020-2032
Figure 28. By Country – Europe Terminal Blocks and Barrier Strips Sales Market Share, 2020-2032
Figure 29. Germany Terminal Blocks and Barrier Strips Revenue, (US$, Mn), 2020-2032
Figure 30. France Terminal Blocks and Barrier Strips Revenue, (US$, Mn), 2020-2032
Figure 31. U.K. Terminal Blocks and Barrier Strips Revenue, (US$, Mn), 2020-2032
Figure 32. Italy Terminal Blocks and Barrier Strips Revenue, (US$, Mn), 2020-2032
Figure 33. Russia Terminal Blocks and Barrier Strips Revenue, (US$, Mn), 2020-2032
Figure 34. Nordic Countries Terminal Blocks and Barrier Strips Revenue, (US$, Mn), 2020-2032
Figure 35. Benelux Terminal Blocks and Barrier Strips Revenue, (US$, Mn), 2020-2032
Figure 36. By Region – Asia Terminal Blocks and Barrier Strips Revenue Market Share, 2020-2032
Figure 37. By Region – Asia Terminal Blocks and Barrier Strips Sales Market Share, 2020-2032
Figure 38. China Terminal Blocks and Barrier Strips Revenue, (US$, Mn), 2020-2032
Figure 39. Japan Terminal Blocks and Barrier Strips Revenue, (US$, Mn), 2020-2032
Figure 40. South Korea Terminal Blocks and Barrier Strips Revenue, (US$, Mn), 2020-2032
Figure 41. Southeast Asia Terminal Blocks and Barrier Strips Revenue, (US$, Mn), 2020-2032
Figure 42. India Terminal Blocks and Barrier Strips Revenue, (US$, Mn), 2020-2032
Figure 43. By Country – South America Terminal Blocks and Barrier Strips Revenue Market Share, 2020-2032
Figure 44. By Country – South America Terminal Blocks and Barrier Strips Sales, Market Share, 2020-2032
Figure 45. Brazil Terminal Blocks and Barrier Strips Revenue, (US$, Mn), 2020-2032
Figure 46. Argentina Terminal Blocks and Barrier Strips Revenue, (US$, Mn), 2020-2032
Figure 47. By Country – Middle East & Africa Terminal Blocks and Barrier Strips Revenue, Market Share, 2020-2032
Figure 48. By Country – Middle East & Africa Terminal Blocks and Barrier Strips Sales, Market Share, 2020-2032
Figure 49. Turkey Terminal Blocks and Barrier Strips Revenue, (US$, Mn), 2020-2032
Figure 50. Israel Terminal Blocks and Barrier Strips Revenue, (US$, Mn), 2020-2032
Figure 51. Saudi Arabia Terminal Blocks and Barrier Strips Revenue, (US$, Mn), 2020-2032
Figure 52. UAE Terminal Blocks and Barrier Strips Revenue, (US$, Mn), 2020-2032
Figure 53. Global Terminal Blocks and Barrier Strips Production Capacity (K Units), 2020-2032
Figure 54. The Percentage of Production Terminal Blocks and Barrier Strips by Region, 2024 VS 2032
Figure 55. Terminal Blocks and Barrier Strips Industry Value Chain
Figure 56. Marketing Channels