
Key Statistics
Key Takeaways
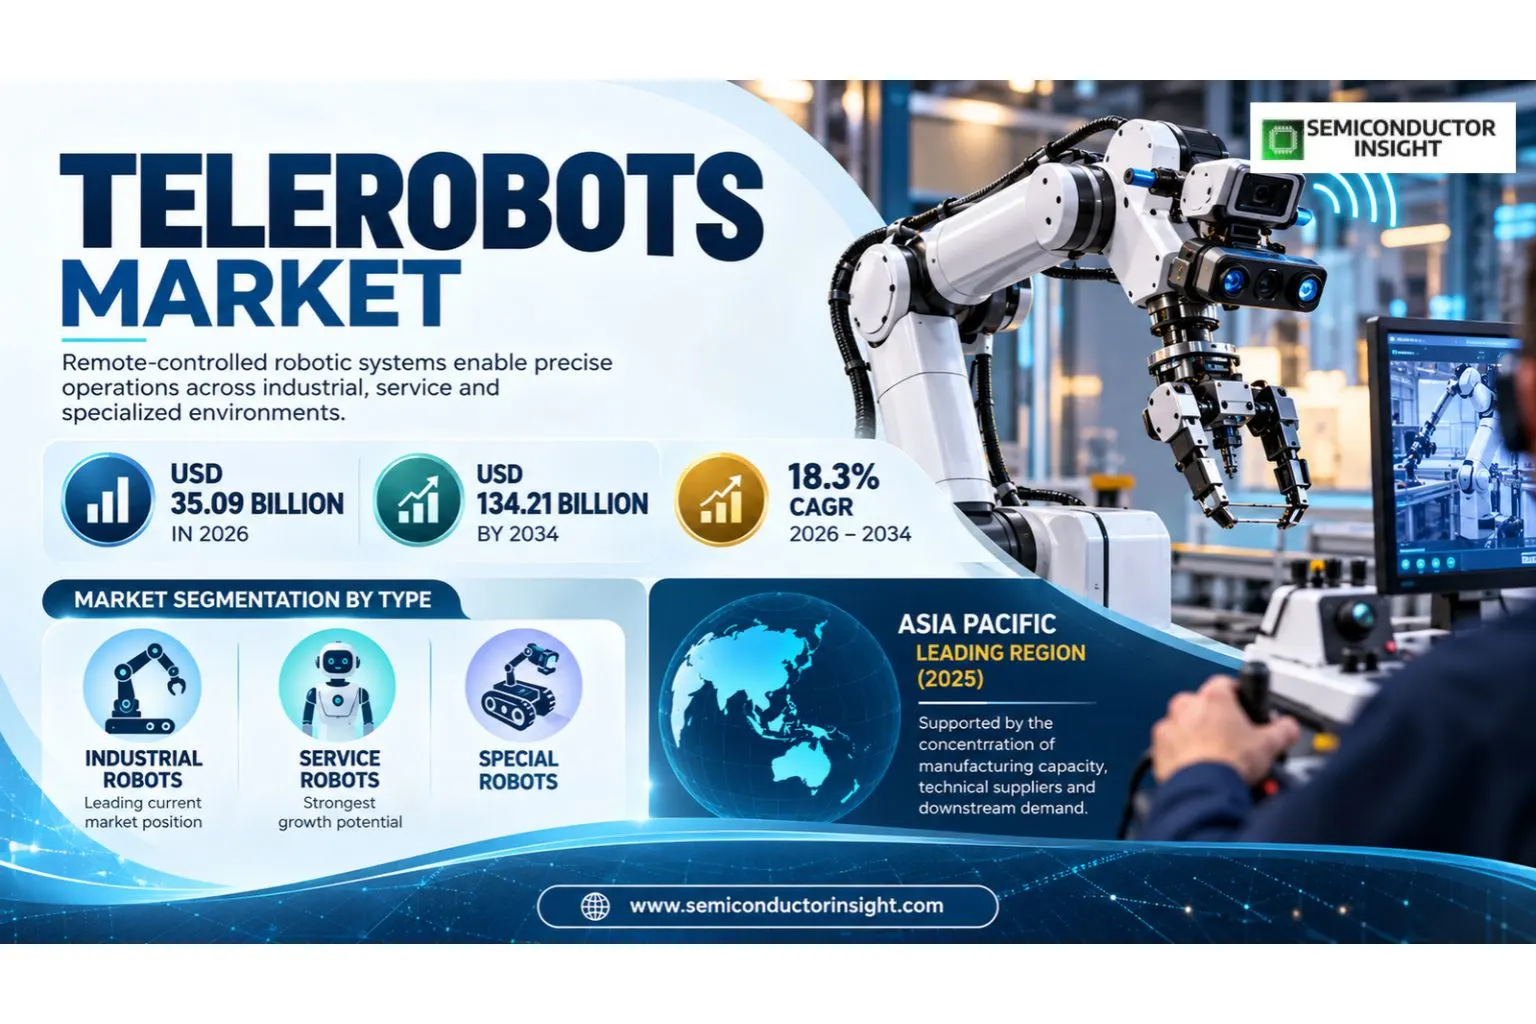
- Telerobots market is estimated at USD 35.09 billion in 2026 and is projected to reach USD 134.21 billion by 2034, representing a 18.3% CAGR over 2026–2034.
- Industrial Robots holds the strongest current type position, while Service Robots is gaining strategic importance as buyers prioritize higher performance, integration and lifecycle value.
- Industry forms the largest application base, while Healthcare offers one of the strongest incremental demand pools as end users redesign systems around automation, bandwidth, reliability or higher functional density.
- Asia Pacific holds the leading regional position in 2025 because manufacturing concentration, supply-chain depth and end-user investment create the strongest commercial pull for qualified suppliers.
- The principal growth forces are factory automation and remote supervision, hazardous-environment task substitution, lower-latency communications and better machine vision; the most important adoption constraints are network latency and communications reliability, high integration and operator-training cost.
- Competitive advantage is shifting toward suppliers that combine core product performance with application engineering, qualification support, production consistency, software or system integration and responsive regional service.
Telerobots Market Overview
Telerobots market is estimated at USD 35.09 billion in 2026 and is projected to reach USD 134.21 billion by 2034, expanding at a 18.3% CAGR during 2026–2034. Asia Pacific holds the leading regional position in 2025, supported by the concentration of manufacturing capacity, technical suppliers and downstream demand.
Telerobots is best understood as a system-level market in which product specifications matter only when they translate into repeatable commercial outcomes. Demand is created when customers need higher performance, more automation, tighter control, greater reliability or a lower total operating cost. The category therefore spans hardware, embedded control, application-specific engineering and qualification activity. Across the forecast period, value creation is expected to move toward products that become more deeply integrated into the customer workflow rather than remaining interchangeable standalone components.
The market’s near-term direction is shaped by factory automation and remote supervision, hazardous-environment task substitution, lower-latency communications and better machine vision, labor constraints in manufacturing and service operations. These forces expand the addressable installed base and also increase the value of each qualified design. Buyers are becoming more disciplined about uptime, thermal behavior, software compatibility, yield impact, field support and supply assurance. That purchasing logic benefits suppliers with strong engineering depth and customer-specific validation while making it harder for new entrants to win share through price alone.
At the same time, network latency and communications reliability, high integration and operator-training cost, cybersecurity and functional-safety requirements, regulatory complexity in medical and defense applications limit adoption in parts of the market. The result is not a uniform growth curve: premium configurations and mission-critical applications can expand much faster than mature or price-sensitive use cases. Suppliers that segment customers by technical need, qualification intensity and lifecycle value are likely to capture more attractive margins than companies using a broad catalogue strategy without application specialization.
Segment Analysis: By Type
By type, the market is segmented into Industrial Robots, Service Robots, Special Robots. Industrial Robots holds the leading current position, while Service Robots has the strongest structural growth case as system architectures become more demanding and customers accept higher-value configurations that improve performance, integration or reliability.
| Type | Market position and demand characteristics |
|---|---|
| Industrial Robots | Industrial Robots addresses a distinct technical and commercial requirement within the Telerobots market. Purchasing decisions depend on performance consistency, system qualification, integration effort, lifecycle support and total installed economics rather than on a single specification. It is the largest type today. Suppliers that can demonstrate repeatable production results, application engineering and stable delivery are positioned to defend pricing, while less differentiated offerings face greater substitution and procurement pressure. |
| Service Robots | Service Robots addresses a distinct technical and commercial requirement within the Telerobots market. Purchasing decisions depend on performance consistency, system qualification, integration effort, lifecycle support and total installed economics rather than on a single specification. It has the strongest growth profile. Suppliers that can demonstrate repeatable production results, application engineering and stable delivery are positioned to defend pricing, while less differentiated offerings face greater substitution and procurement pressure. |
| Special Robots | Special Robots addresses a distinct technical and commercial requirement within the Telerobots market. Purchasing decisions depend on performance consistency, system qualification, integration effort, lifecycle support and total installed economics rather than on a single specification. It serves specialized requirements. Suppliers that can demonstrate repeatable production results, application engineering and stable delivery are positioned to defend pricing, while less differentiated offerings face greater substitution and procurement pressure. |
Type selection increasingly reflects total system economics. Customers compare qualification effort, service requirements, expected life, operating efficiency and the cost of failure alongside unit price. That is why Service Robots can gain share even when its upfront cost is higher: it is adopted where performance or integration benefits create measurable downstream value. Mature types remain relevant where installed-base compatibility, simplicity and procurement familiarity carry more weight than feature expansion.
Segment Analysis: By Application
By application, the market includes Industry, Service Industry, Healthcare, Defense & Aerospace, Others. Industry represents the largest current demand base, while Healthcare offers the strongest incremental opportunity as investment shifts toward higher-performance, more automated and data-intensive operating environments.
| Application | Demand characteristics |
|---|---|
| Industry | Industry addresses a distinct technical and commercial requirement within the Telerobots market. Purchasing decisions depend on performance consistency, system qualification, integration effort, lifecycle support and total installed economics rather than on a single specification. It anchors the current installed base. Suppliers that can demonstrate repeatable production results, application engineering and stable delivery are positioned to defend pricing, while less differentiated offerings face greater substitution and procurement pressure. |
| Service Industry | Service Industry addresses a distinct technical and commercial requirement within the Telerobots market. Purchasing decisions depend on performance consistency, system qualification, integration effort, lifecycle support and total installed economics rather than on a single specification. Demand is specification-led. Suppliers that can demonstrate repeatable production results, application engineering and stable delivery are positioned to defend pricing, while less differentiated offerings face greater substitution and procurement pressure. |
| Healthcare | Healthcare addresses a distinct technical and commercial requirement within the Telerobots market. Purchasing decisions depend on performance consistency, system qualification, integration effort, lifecycle support and total installed economics rather than on a single specification. It is a high-growth application. Suppliers that can demonstrate repeatable production results, application engineering and stable delivery are positioned to defend pricing, while less differentiated offerings face greater substitution and procurement pressure. |
| Defense & Aerospace | Defense & Aerospace addresses a distinct technical and commercial requirement within the Telerobots market. Purchasing decisions depend on performance consistency, system qualification, integration effort, lifecycle support and total installed economics rather than on a single specification. Demand is specification-led. Suppliers that can demonstrate repeatable production results, application engineering and stable delivery are positioned to defend pricing, while less differentiated offerings face greater substitution and procurement pressure. |
| Others | Others addresses a distinct technical and commercial requirement within the Telerobots market. Purchasing decisions depend on performance consistency, system qualification, integration effort, lifecycle support and total installed economics rather than on a single specification. Demand is specification-led. Suppliers that can demonstrate repeatable production results, application engineering and stable delivery are positioned to defend pricing, while less differentiated offerings face greater substitution and procurement pressure. |
By Control Type
By Control Type provides an additional view of purchasing behavior because the technical configuration changes with end-user architecture, production scale and qualification requirements. The relevant subsegments are Joystick-Controlled, Software-Controlled, AI-Enabled Autonomous, Haptic Feedback Systems. These categories help separate high-value design wins from mature replacement demand and make the commercial opportunity more transparent than a type-and-application view alone.
| Control Type | Commercial interpretation |
|---|---|
| Joystick-Controlled | Joystick-Controlled addresses a distinct technical and commercial requirement within the Telerobots market. Purchasing decisions depend on performance consistency, system qualification, integration effort, lifecycle support and total installed economics rather than on a single specification. Suppliers that can demonstrate repeatable production results, application engineering and stable delivery are positioned to defend pricing, while less differentiated offerings face greater substitution and procurement pressure. |
| Software-Controlled | Software-Controlled addresses a distinct technical and commercial requirement within the Telerobots market. Purchasing decisions depend on performance consistency, system qualification, integration effort, lifecycle support and total installed economics rather than on a single specification. Suppliers that can demonstrate repeatable production results, application engineering and stable delivery are positioned to defend pricing, while less differentiated offerings face greater substitution and procurement pressure. |
| AI-Enabled Autonomous | AI-Enabled Autonomous addresses a distinct technical and commercial requirement within the Telerobots market. Purchasing decisions depend on performance consistency, system qualification, integration effort, lifecycle support and total installed economics rather than on a single specification. Suppliers that can demonstrate repeatable production results, application engineering and stable delivery are positioned to defend pricing, while less differentiated offerings face greater substitution and procurement pressure. |
| Haptic Feedback Systems | Haptic Feedback Systems addresses a distinct technical and commercial requirement within the Telerobots market. Purchasing decisions depend on performance consistency, system qualification, integration effort, lifecycle support and total installed economics rather than on a single specification. Suppliers that can demonstrate repeatable production results, application engineering and stable delivery are positioned to defend pricing, while less differentiated offerings face greater substitution and procurement pressure. |
By End User
By End User provides an additional view of purchasing behavior because the technical configuration changes with end-user architecture, production scale and qualification requirements. The relevant subsegments are Automotive Manufacturing, Electronics & Semiconductor, Healthcare Institutions, Logistics & Warehousing, Others. These categories help separate high-value design wins from mature replacement demand and make the commercial opportunity more transparent than a type-and-application view alone.
| End User | Commercial interpretation |
|---|---|
| Automotive Manufacturing | Automotive Manufacturing addresses a distinct technical and commercial requirement within the Telerobots market. Purchasing decisions depend on performance consistency, system qualification, integration effort, lifecycle support and total installed economics rather than on a single specification. Suppliers that can demonstrate repeatable production results, application engineering and stable delivery are positioned to defend pricing, while less differentiated offerings face greater substitution and procurement pressure. |
| Electronics & Semiconductor | Electronics & Semiconductor addresses a distinct technical and commercial requirement within the Telerobots market. Purchasing decisions depend on performance consistency, system qualification, integration effort, lifecycle support and total installed economics rather than on a single specification. Suppliers that can demonstrate repeatable production results, application engineering and stable delivery are positioned to defend pricing, while less differentiated offerings face greater substitution and procurement pressure. |
| Healthcare Institutions | Healthcare Institutions addresses a distinct technical and commercial requirement within the Telerobots market. Purchasing decisions depend on performance consistency, system qualification, integration effort, lifecycle support and total installed economics rather than on a single specification. Suppliers that can demonstrate repeatable production results, application engineering and stable delivery are positioned to defend pricing, while less differentiated offerings face greater substitution and procurement pressure. |
| Logistics & Warehousing | Logistics & Warehousing addresses a distinct technical and commercial requirement within the Telerobots market. Purchasing decisions depend on performance consistency, system qualification, integration effort, lifecycle support and total installed economics rather than on a single specification. Suppliers that can demonstrate repeatable production results, application engineering and stable delivery are positioned to defend pricing, while less differentiated offerings face greater substitution and procurement pressure. |
| Others | Others addresses a distinct technical and commercial requirement within the Telerobots market. Purchasing decisions depend on performance consistency, system qualification, integration effort, lifecycle support and total installed economics rather than on a single specification. Suppliers that can demonstrate repeatable production results, application engineering and stable delivery are positioned to defend pricing, while less differentiated offerings face greater substitution and procurement pressure. |
Regional Analysis
Asia Pacific leads the market in 2025 because the region combines manufacturing scale, dense supplier ecosystems and a large share of downstream system assembly. North America remains important for technology development and premium applications, Europe emphasizes quality, regulation and advanced manufacturing, while South America and the Middle East & Africa are more project- and import-led.
Regional demand should not be interpreted as a single global trend scaled by population. Each region buys for different reasons: some are driven by manufacturing concentration, others by data-center or industrial investment, regulatory qualification, defense spending, automotive programs or local infrastructure. Suppliers therefore need region-specific channel, service and certification strategies. A product that wins in Asia on supply continuity and manufacturing integration may require a very different value proposition in North America or Europe.
| Region | Position | Demand profile | Commercial logic |
|---|---|---|---|
| Asia Pacific | Largest | Manufacturing-led | China, Japan, South Korea, Taiwan and Southeast Asia concentrate production and supply-chain capability. |
| North America | High-value | Technology and end-user investment | The United States drives premium demand through data centers, aerospace, industrial automation, semiconductors and advanced electronics. |
| Europe | Established | Quality and regulation-led | Germany, France, Italy and the Nordic region support demand through automotive, industrial, telecom and research ecosystems. |
| South America | Developing | Import and project-led | Brazil and regional industrial hubs create selective demand, with distributor support and landed cost remaining important. |
| Middle East & Africa | Emerging | Infrastructure and project-led | Digital infrastructure, energy, defense and smart-city investments create targeted demand but local production depth is limited. |
Detailed Regional Market Analysis
Competitive Landscape
The competitive landscape combines large diversified technology groups with specialists that have deep domain expertise. Leading suppliers include FANUC Corporation, ABB Ltd., KUKA AG, Yaskawa Electric Corporation, Nachi-Fujikoshi Corp., Kawasaki Heavy Industries, with additional niche and regional companies competing on application fit. Competitive advantage is strongest where a supplier can pair core product performance with qualification data, field support, software or process know-how and a credible long-term supply roadmap.
Customers increasingly treat supplier selection as a risk-management decision. Qualification cost, change-control discipline, service response, lifecycle availability and engineering collaboration can outweigh modest unit-price differences. This favors incumbents with installed bases and validated product generations, but it also creates openings for specialists that solve an emerging problem better than broad-line competitors. The fastest share shifts are therefore likely in new architectures, not in mature replacement categories with entrenched specifications.
Pricing power is highest where the product directly protects yield, uptime, data integrity, energy efficiency or safety. In those applications, the cost of a failure or delayed qualification is much greater than the component or equipment price. More commoditized configurations remain exposed to procurement pressure and regional competition. Suppliers can defend margin by bundling technical support, software, calibration, service agreements or design-in assistance that makes the offering harder to substitute.
| Company | Competitive role |
|---|---|
| FANUC Corporation | FANUC Corporation addresses a distinct technical and commercial requirement within the Telerobots market. Purchasing decisions depend on performance consistency, system qualification, integration effort, lifecycle support and total installed economics rather than on a single specification. Competitive differentiation depends on portfolio depth and customer qualification. Suppliers that can demonstrate repeatable production results, application engineering and stable delivery are positioned to defend pricing, while less differentiated offerings face greater substitution and procurement pressure. |
| ABB Ltd. | ABB Ltd. addresses a distinct technical and commercial requirement within the Telerobots market. Purchasing decisions depend on performance consistency, system qualification, integration effort, lifecycle support and total installed economics rather than on a single specification. Competitive differentiation depends on portfolio depth and customer qualification. Suppliers that can demonstrate repeatable production results, application engineering and stable delivery are positioned to defend pricing, while less differentiated offerings face greater substitution and procurement pressure. |
| KUKA AG | KUKA AG addresses a distinct technical and commercial requirement within the Telerobots market. Purchasing decisions depend on performance consistency, system qualification, integration effort, lifecycle support and total installed economics rather than on a single specification. Competitive differentiation depends on portfolio depth and customer qualification. Suppliers that can demonstrate repeatable production results, application engineering and stable delivery are positioned to defend pricing, while less differentiated offerings face greater substitution and procurement pressure. |
| Yaskawa Electric Corporation | Yaskawa Electric Corporation addresses a distinct technical and commercial requirement within the Telerobots market. Purchasing decisions depend on performance consistency, system qualification, integration effort, lifecycle support and total installed economics rather than on a single specification. Competitive differentiation depends on portfolio depth and customer qualification. Suppliers that can demonstrate repeatable production results, application engineering and stable delivery are positioned to defend pricing, while less differentiated offerings face greater substitution and procurement pressure. |
| Nachi-Fujikoshi Corp. | Nachi-Fujikoshi Corp. addresses a distinct technical and commercial requirement within the Telerobots market. Purchasing decisions depend on performance consistency, system qualification, integration effort, lifecycle support and total installed economics rather than on a single specification. Competitive differentiation depends on portfolio depth and customer qualification. Suppliers that can demonstrate repeatable production results, application engineering and stable delivery are positioned to defend pricing, while less differentiated offerings face greater substitution and procurement pressure. |
| Kawasaki Heavy Industries | Kawasaki Heavy Industries addresses a distinct technical and commercial requirement within the Telerobots market. Purchasing decisions depend on performance consistency, system qualification, integration effort, lifecycle support and total installed economics rather than on a single specification. Competitive differentiation depends on portfolio depth and customer qualification. Suppliers that can demonstrate repeatable production results, application engineering and stable delivery are positioned to defend pricing, while less differentiated offerings face greater substitution and procurement pressure. |
| Comau S.p.A. | Comau S.p.A. addresses a distinct technical and commercial requirement within the Telerobots market. Purchasing decisions depend on performance consistency, system qualification, integration effort, lifecycle support and total installed economics rather than on a single specification. Competitive differentiation depends on portfolio depth and customer qualification. Suppliers that can demonstrate repeatable production results, application engineering and stable delivery are positioned to defend pricing, while less differentiated offerings face greater substitution and procurement pressure. |
| Seiko Epson Corporation | Seiko Epson Corporation addresses a distinct technical and commercial requirement within the Telerobots market. Purchasing decisions depend on performance consistency, system qualification, integration effort, lifecycle support and total installed economics rather than on a single specification. Competitive differentiation depends on portfolio depth and customer qualification. Suppliers that can demonstrate repeatable production results, application engineering and stable delivery are positioned to defend pricing, while less differentiated offerings face greater substitution and procurement pressure. |
| Stäubli International AG | Stäubli International AG addresses a distinct technical and commercial requirement within the Telerobots market. Purchasing decisions depend on performance consistency, system qualification, integration effort, lifecycle support and total installed economics rather than on a single specification. Competitive differentiation depends on portfolio depth and customer qualification. Suppliers that can demonstrate repeatable production results, application engineering and stable delivery are positioned to defend pricing, while less differentiated offerings face greater substitution and procurement pressure. |
| DENSO Corporation | DENSO Corporation addresses a distinct technical and commercial requirement within the Telerobots market. Purchasing decisions depend on performance consistency, system qualification, integration effort, lifecycle support and total installed economics rather than on a single specification. Competitive differentiation depends on portfolio depth and customer qualification. Suppliers that can demonstrate repeatable production results, application engineering and stable delivery are positioned to defend pricing, while less differentiated offerings face greater substitution and procurement pressure. |
| Universal Robots A/S | Universal Robots A/S addresses a distinct technical and commercial requirement within the Telerobots market. Purchasing decisions depend on performance consistency, system qualification, integration effort, lifecycle support and total installed economics rather than on a single specification. Competitive differentiation depends on portfolio depth and customer qualification. Suppliers that can demonstrate repeatable production results, application engineering and stable delivery are positioned to defend pricing, while less differentiated offerings face greater substitution and procurement pressure. |
| Hyundai Robotics | Hyundai Robotics addresses a distinct technical and commercial requirement within the Telerobots market. Purchasing decisions depend on performance consistency, system qualification, integration effort, lifecycle support and total installed economics rather than on a single specification. Competitive differentiation depends on portfolio depth and customer qualification. Suppliers that can demonstrate repeatable production results, application engineering and stable delivery are positioned to defend pricing, while less differentiated offerings face greater substitution and procurement pressure. |
Production Capacity Analysis
Production capacity for Telerobots is concentrated in specialized manufacturing ecosystems where precision process control, qualified upstream materials and trained technical labor are available. Capacity cannot be evaluated only by installed floor space or nominal equipment count because usable output depends on yield, product mix, qualification status and the proportion of production reserved for strategic customers. This makes debottlenecking and process learning as important as greenfield expansion.
The main supply-side constraints are linked to high integration and operator-training cost, cybersecurity and functional-safety requirements, regulatory complexity in medical and defense applications. Capacity additions require more than capital expenditure: they also require customer validation, process stability and sometimes new tooling or packaging. For buyers, this means supply risk can remain elevated even after a supplier announces expansion. Long-term agreements, dual qualification and closer design collaboration are increasingly used to protect availability for high-value platforms.
Market Dynamics
Market dynamics are defined by the interaction between factory automation and remote supervision, hazardous-environment task substitution, lower-latency communications and better machine vision, labor constraints in manufacturing and service operations and countervailing pressures including network latency and communications reliability, high integration and operator-training cost, cybersecurity and functional-safety requirements, regulatory complexity in medical and defense applications. The net effect is a market that rewards technically differentiated, qualified products more than undifferentiated volume. Growth is strongest when a technology transition creates a new performance requirement that cannot be met economically by the previous architecture.
Market Drivers
| Driver | Impact | Commercial effect |
|---|---|---|
| factory automation and remote supervision | High | Factory automation and remote supervision expands the addressable installed base or raises the value of qualified technology per system. |
| hazardous-environment task substitution | High | Hazardous-environment task substitution expands the addressable installed base or raises the value of qualified technology per system. |
| lower-latency communications and better machine vision | Medium | Lower-latency communications and better machine vision expands the addressable installed base or raises the value of qualified technology per system. |
| labor constraints in manufacturing and service operations | Medium | Labor constraints in manufacturing and service operations expands the addressable installed base or raises the value of qualified technology per system. |
Factory Automation And Remote Supervision
Factory automation and remote supervision is a structural growth driver because it changes what end users require from system design, not merely how many units they purchase. When performance, capacity, bandwidth, reliability or automation requirements rise, older configurations may no longer meet production economics. This creates new design-in opportunities, raises qualification activity and can support higher average selling values for suppliers that solve the resulting engineering constraint.
Hazardous-Environment Task Substitution
Hazardous-environment task substitution is a structural growth driver because it changes what end users require from system design, not merely how many units they purchase. When performance, capacity, bandwidth, reliability or automation requirements rise, older configurations may no longer meet production economics. This creates new design-in opportunities, raises qualification activity and can support higher average selling values for suppliers that solve the resulting engineering constraint.
Lower-Latency Communications And Better Machine Vision
Lower-latency communications and better machine vision is a structural growth driver because it changes what end users require from system design, not merely how many units they purchase. When performance, capacity, bandwidth, reliability or automation requirements rise, older configurations may no longer meet production economics. This creates new design-in opportunities, raises qualification activity and can support higher average selling values for suppliers that solve the resulting engineering constraint.
Labor Constraints In Manufacturing And Service Operations
Labor constraints in manufacturing and service operations is a structural growth driver because it changes what end users require from system design, not merely how many units they purchase. When performance, capacity, bandwidth, reliability or automation requirements rise, older configurations may no longer meet production economics. This creates new design-in opportunities, raises qualification activity and can support higher average selling values for suppliers that solve the resulting engineering constraint.
Market Restraints
| Restraint | Impact | Commercial effect |
|---|---|---|
| network latency and communications reliability | High | Network latency and communications reliability can extend qualification cycles, reduce addressable customers or increase total cost of ownership. |
| high integration and operator-training cost | High | High integration and operator-training cost can extend qualification cycles, reduce addressable customers or increase total cost of ownership. |
| cybersecurity and functional-safety requirements | Medium | Cybersecurity and functional-safety requirements can extend qualification cycles, reduce addressable customers or increase total cost of ownership. |
| regulatory complexity in medical and defense applications | Medium | Regulatory complexity in medical and defense applications can extend qualification cycles, reduce addressable customers or increase total cost of ownership. |
Network Latency And Communications Reliability
Network latency and communications reliability restrains market growth when the economic or engineering burden exceeds the incremental value delivered by the new solution. The impact is strongest among smaller buyers, mature applications and regions where technical support is limited. Suppliers can reduce this barrier through standardized designs, stronger reference platforms, local service, better diagnostics, flexible commercial models and clearer proof of lifecycle savings.
High Integration And Operator-Training Cost
High integration and operator-training cost restrains market growth when the economic or engineering burden exceeds the incremental value delivered by the new solution. The impact is strongest among smaller buyers, mature applications and regions where technical support is limited. Suppliers can reduce this barrier through standardized designs, stronger reference platforms, local service, better diagnostics, flexible commercial models and clearer proof of lifecycle savings.
Cybersecurity And Functional-Safety Requirements
Cybersecurity and functional-safety requirements restrains market growth when the economic or engineering burden exceeds the incremental value delivered by the new solution. The impact is strongest among smaller buyers, mature applications and regions where technical support is limited. Suppliers can reduce this barrier through standardized designs, stronger reference platforms, local service, better diagnostics, flexible commercial models and clearer proof of lifecycle savings.
Regulatory Complexity In Medical And Defense Applications
Regulatory complexity in medical and defense applications restrains market growth when the economic or engineering burden exceeds the incremental value delivered by the new solution. The impact is strongest among smaller buyers, mature applications and regions where technical support is limited. Suppliers can reduce this barrier through standardized designs, stronger reference platforms, local service, better diagnostics, flexible commercial models and clearer proof of lifecycle savings.
Market Opportunities
Teleoperation For Lunar And Space Infrastructure
Teleoperation for lunar and space infrastructure represents an attractive opportunity because it combines a growing end-use need with a technical requirement that favors qualified, higher-value products. The most likely beneficiaries are suppliers able to engage early in customer design cycles, validate performance under production conditions and support regional scaling. The commercial implication is a larger share of design-driven revenue and a reduced dependence on price-only competition.
Remote Inspection In Energy And Hazardous Industries
Remote inspection in energy and hazardous industries represents an attractive opportunity because it combines a growing end-use need with a technical requirement that favors qualified, higher-value products. The most likely beneficiaries are suppliers able to engage early in customer design cycles, validate performance under production conditions and support regional scaling. The commercial implication is a larger share of design-driven revenue and a reduced dependence on price-only competition.
Medical And Care Telepresence Robots
Medical and care telepresence robots represents an attractive opportunity because it combines a growing end-use need with a technical requirement that favors qualified, higher-value products. The most likely beneficiaries are suppliers able to engage early in customer design cycles, validate performance under production conditions and support regional scaling. The commercial implication is a larger share of design-driven revenue and a reduced dependence on price-only competition.
Ai-Assisted Shared Autonomy For One-To-Many Robot Supervision
Ai-assisted shared autonomy for one-to-many robot supervision represents an attractive opportunity because it combines a growing end-use need with a technical requirement that favors qualified, higher-value products. The most likely beneficiaries are suppliers able to engage early in customer design cycles, validate performance under production conditions and support regional scaling. The commercial implication is a larger share of design-driven revenue and a reduced dependence on price-only competition.
Supply Chain Analysis
Raw materials and specialty inputs
Raw materials and specialty inputs captures value through a different combination of process control, intellectual property, qualification and scale. Bottlenecks are most important where materials are specialized, tolerances are tight or customer approval is lengthy. Inventory held at the wrong stage does not necessarily solve shortages because final products may be customer-specific. This creates incentives for better demand visibility, dual sourcing and closer coordination between upstream suppliers and system integrators.
Precision manufacturing and processing
Precision manufacturing and processing captures value through a different combination of process control, intellectual property, qualification and scale. Bottlenecks are most important where materials are specialized, tolerances are tight or customer approval is lengthy. Inventory held at the wrong stage does not necessarily solve shortages because final products may be customer-specific. This creates incentives for better demand visibility, dual sourcing and closer coordination between upstream suppliers and system integrators.
Module or system integration
Module or system integration captures value through a different combination of process control, intellectual property, qualification and scale. Bottlenecks are most important where materials are specialized, tolerances are tight or customer approval is lengthy. Inventory held at the wrong stage does not necessarily solve shortages because final products may be customer-specific. This creates incentives for better demand visibility, dual sourcing and closer coordination between upstream suppliers and system integrators.
OEM / end-user deployment
OEM / end-user deployment captures value through a different combination of process control, intellectual property, qualification and scale. Bottlenecks are most important where materials are specialized, tolerances are tight or customer approval is lengthy. Inventory held at the wrong stage does not necessarily solve shortages because final products may be customer-specific. This creates incentives for better demand visibility, dual sourcing and closer coordination between upstream suppliers and system integrators.
Recent Developments
Recent developments show that the market is being shaped by concrete product ramps, capacity decisions and platform transitions rather than by generic digitization alone. These events matter because they change qualification pipelines, supplier bargaining power and the mix of products that customers require. The strongest signal is the movement of demand toward applications where performance, data integrity, reliability or capacity has a measurable economic value.
Report Scope & Segmentation
| Attribute | Coverage |
|---|---|
| Report title | Telerobots Market Size, Share & Industry Analysis, By Type (Industrial Robots, Service Robots, Special Robots), By Application (Industry, Service Industry, Healthcare, Defense & Aerospace, Others), By Control Type (Joystick-Controlled, Software-Controlled, AI-Enabled Autonomous, Haptic Feedback Systems), By End User (Automotive Manufacturing, Electronics & Semiconductor, Healthcare Institutions, Logistics & Warehousing, Others), and Regional Forecast, 2026-2034 |
| Base year | 2025 |
| Estimated year | 2026 |
| Forecast period | 2026–2034 |
| 2025 market size | USD 29.67 billion |
| 2026 market size | USD 35.09 billion |
| 2034 market size | USD 134.21 billion |
| CAGR (2026–2034) | 18.3% |
| By Type | Industrial Robots, Service Robots, Special Robots |
| By Application | Industry, Service Industry, Healthcare, Defense & Aerospace, Others |
| By Control Type | Joystick-Controlled, Software-Controlled, AI-Enabled Autonomous, Haptic Feedback Systems |
| By End User | Automotive Manufacturing, Electronics & Semiconductor, Healthcare Institutions, Logistics & Warehousing, Others |
| Regions | North America, Europe, Asia Pacific, South America, Middle East & Africa |
| Companies | FANUC Corporation, ABB Ltd., KUKA AG, Yaskawa Electric Corporation, Nachi-Fujikoshi Corp., Kawasaki Heavy Industries, Comau S.p.A., Seiko Epson Corporation, Stäubli International AG, DENSO Corporation, Universal Robots A/S, Hyundai Robotics |
Frequently Asked Questions
What is the current size of the Telerobots market?
The global Telerobots market is estimated at USD 35.09 billion in 2026 and is projected to reach USD 134.21 billion by 2034, representing a 18.3% CAGR during 2026–2034. The 2025 base-year market size is USD 29.67 billion. Growth is supported by factory automation and remote supervision, hazardous-environment task substitution.
Which region leads the Telerobots market?
Asia Pacific holds the leading regional position in 2025 because manufacturing capacity, technical supply chains and downstream demand are concentrated there. North America and Europe remain important for high-value applications, while other regions are more project-led and rely more heavily on imports, distributors and global OEM platforms.
Which type leads the Telerobots market?
Industrial Robots holds the strongest current type position, while Service Robots has the stronger structural growth case. Customers increasingly evaluate type choices on total installed economics, qualification risk, integration and lifecycle value rather than on upfront hardware cost alone.
Which application is largest for Telerobots?
Industry forms the largest current application base, while Healthcare offers one of the strongest incremental opportunities. Demand expands when the product becomes essential to higher performance, automation, capacity, reliability or compliance within the end-user system.
What are the main market growth drivers?
The main drivers are factory automation and remote supervision, hazardous-environment task substitution, lower-latency communications and better machine vision, labor constraints in manufacturing and service operations. Together they increase the number of addressable installations, raise technical requirements and support higher-value configurations. Their effect is strongest where customers can quantify improvements in productivity, capacity, energy efficiency, reliability or system performance.
What are the main restraints?
The principal restraints are network latency and communications reliability, high integration and operator-training cost, cybersecurity and functional-safety requirements, regulatory complexity in medical and defense applications. These issues can extend qualification cycles, increase total ownership cost or slow adoption among smaller customers. Suppliers mitigate them through standardization, application engineering, software, local service and stronger supply assurance.
Who are the key companies in the Telerobots market?
Key companies include FANUC Corporation, ABB Ltd., KUKA AG, Yaskawa Electric Corporation, Nachi-Fujikoshi Corp., Kawasaki Heavy Industries, Comau S.p.A., Seiko Epson Corporation. Competitive position varies by product architecture, geography and customer qualification. Buyers typically prioritize proven performance, lifecycle support, change-control discipline and supply reliability in addition to price.
Which technology trends are most important?
The most important technology trends are linked to factory automation and remote supervision, hazardous-environment task substitution, lower-latency communications and better machine vision. Product value is moving toward deeper integration, more monitoring and software support, greater automation and architectures that reduce total system complexity while improving repeatability and reliability.
Where are the strongest new opportunities?
New opportunities are concentrated in teleoperation for lunar and space infrastructure, remote inspection in energy and hazardous industries, medical and care telepresence robots, AI-assisted shared autonomy for one-to-many robot supervision. These areas reward suppliers that participate early in platform design, validate performance in production conditions and scale capacity alongside customer qualification rather than entering after specifications have already been locked.
What is the market outlook through 2034?
The Telerobots market is projected to reach USD 134.21 billion by 2034 from USD 35.09 billion in 2026, a 18.3% CAGR. Growth should remain uneven by segment, with the strongest performance in applications that combine a structural technology shift with measurable economic value for the end user.
Research Sources & Evidence Base
View research sources used for this overview.
- International Federation of Robotics. World Robotics 2026 industrial robot installations and operational stock. Supporting evidence for technology, regional demand, capacity, product architecture or market development.
- International Federation of Robotics. World Robotics 2025 regional robot deployment statistics. Supporting evidence for technology, regional demand, capacity, product architecture or market development.
- NASA. CADRE multi-robot lunar technology demonstration. Supporting evidence for technology, regional demand, capacity, product architecture or market development.
- NASA Technical Reports Server. Lunar Terrain Vehicle remote teleoperation studies. Supporting evidence for technology, regional demand, capacity, product architecture or market development.
Get Sample Report PDF for Exclusive Insights
Report Sample Includes
- Table of Contents
- List of Tables & Figures
- Charts, Research Methodology, and more...
 Download Sample Report PDF


