MARKET INSIGHTS
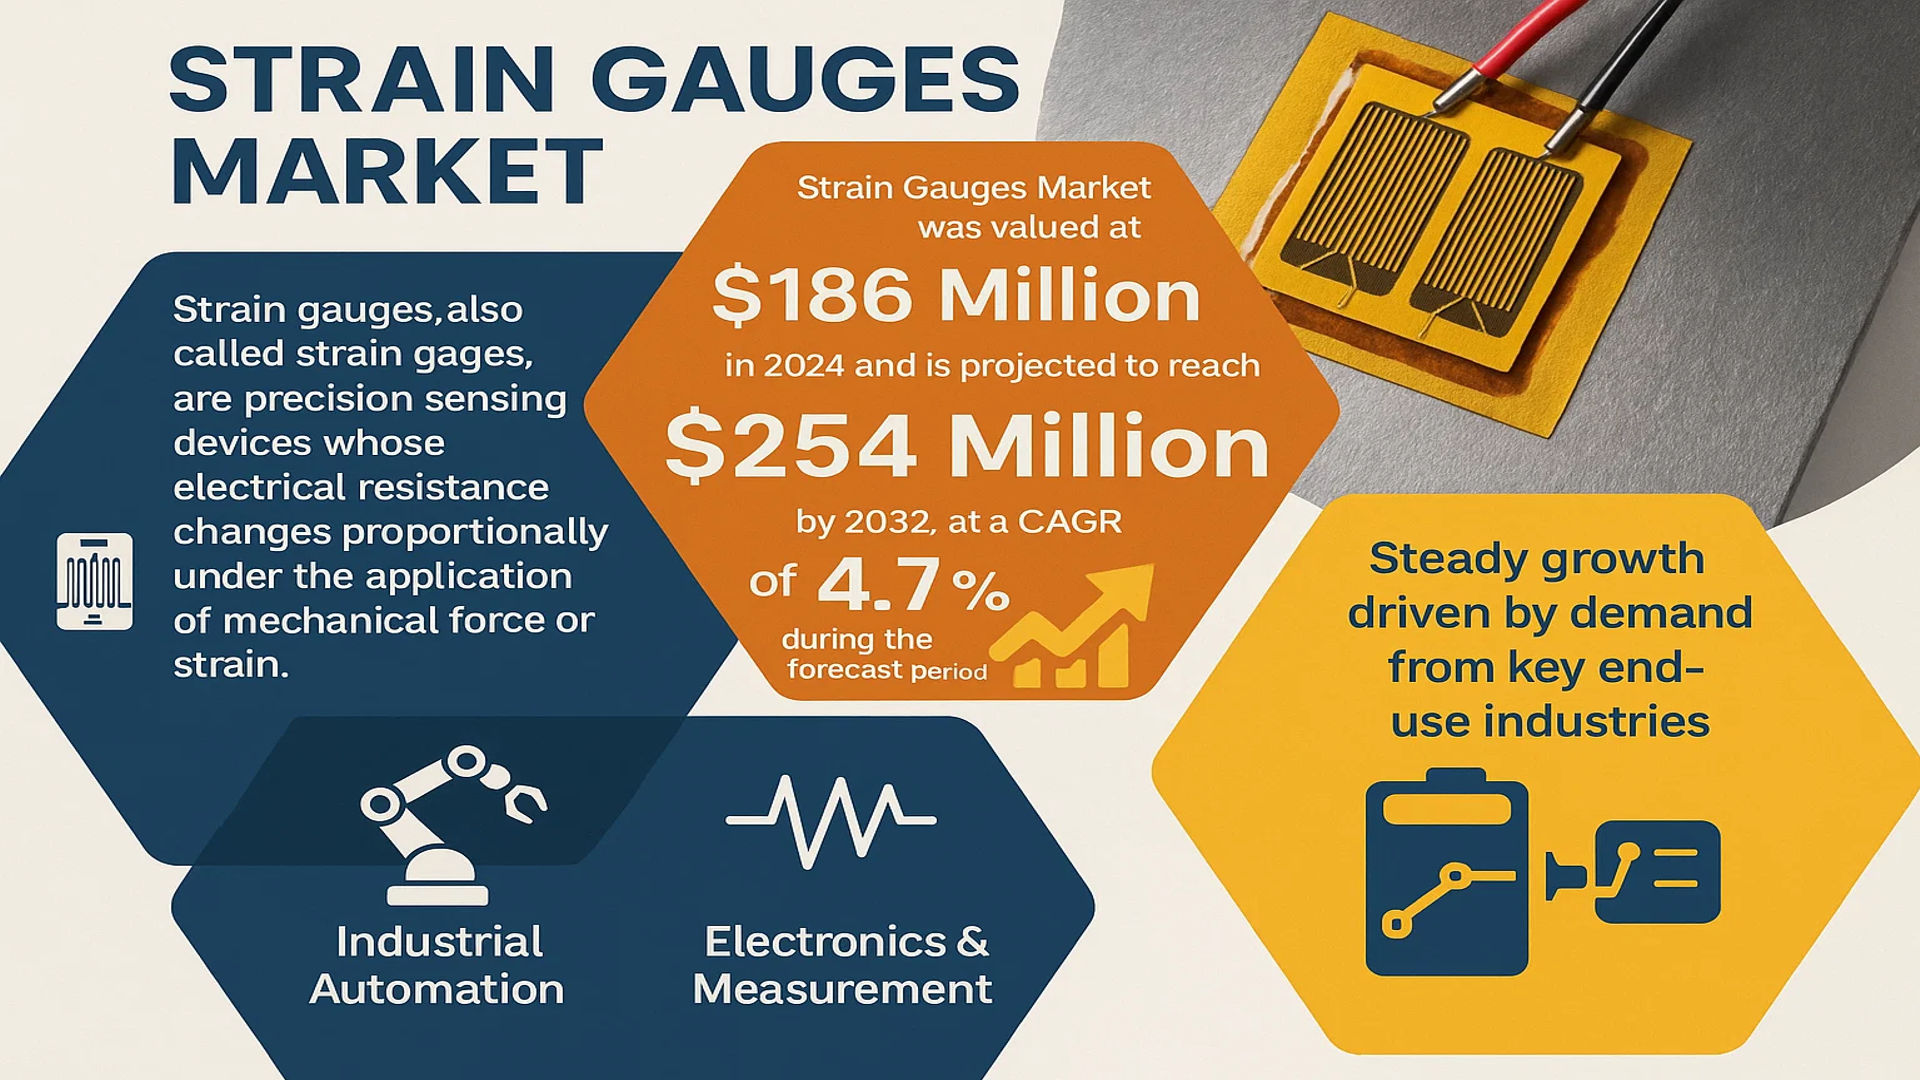
The global Strain Gauges Market was valued at 186 million in 2024 and is projected to reach US$ 254 million by 2032, at a CAGR of 4.7% during the forecast period.
Strain gauges, also called strain gages, are precision sensing devices whose electrical resistance changes proportionally under the application of mechanical force or strain. These fundamental components are critical for converting mechanical deformation into measurable electrical signals, enabling the accurate quantification of parameters such as force, stress, pressure, displacement, and acceleration across countless applications.
The market’s steady growth is underpinned by robust demand from key end-use industries, particularly industrial automation and electronics & measurement, which collectively command a significant market share. Furthermore, technological advancements leading to the development of more precise, durable, and miniaturized gauges are expanding their application scope. The market is also highly consolidated, with the top five manufacturers—including VPG, HBM, and Zemic—holding a combined market share exceeding 70%, indicating a competitive landscape dominated by established players with extensive technical expertise and product portfolios.
MARKET DYNAMICS
MARKET DRIVERS
Expansion of Industrial Automation and IoT Integration to Propel Market Growth
The global strain gauges market is experiencing robust growth driven by the rapid expansion of industrial automation and the integration of Internet of Things (IoT) technologies. Strain gauges are critical components in automated systems for real-time monitoring of structural integrity, force measurement, and predictive maintenance. The industrial automation market is projected to exceed 450 billion dollars by 2030, creating substantial demand for precision measurement devices. In manufacturing sectors, strain gauges enable continuous monitoring of machinery, reducing downtime by up to 30% and improving operational efficiency. The automotive industry alone utilizes approximately 25 million strain gauges annually for quality testing and safety validation. Furthermore, smart factory initiatives worldwide are incorporating strain measurement systems that contribute to the industry 4.0 transformation, where connected sensors provide data for optimizing production processes and preventing equipment failures.
Infrastructure Development and Structural Health Monitoring to Accelerate Adoption
Global infrastructure development projects and increasing focus on structural health monitoring are significantly driving strain gauge demand. The construction industry accounts for over 35% of strain gauge applications, with bridge monitoring systems representing one of the fastest-growing segments. Governments worldwide are investing heavily in infrastructure rehabilitation, with the global construction market expected to reach 15.2 trillion dollars by 2030. Strain gauges provide essential data for assessing structural integrity in bridges, buildings, and dams, helping prevent catastrophic failures. Recent advancements include wireless strain monitoring systems that can detect micro-strains as low as 1 με, enabling early warning of structural weaknesses. The Asia-Pacific region, particularly China and India, leads in infrastructure investments, accounting for approximately 40% of global construction expenditure, thereby driving substantial strain gauge consumption in these markets.
Advancements in Aerospace and Defense Applications to Fuel Market Expansion
The aerospace and defense sector represents a high-growth segment for strain gauges, driven by increasing aircraft production and stringent safety requirements. Commercial aircraft manufacturers are incorporating an average of 2,000-3,000 strain gauges per aircraft for structural testing and health monitoring. The global aerospace composite market, which relies heavily on strain measurement for material validation, is growing at approximately 8% annually. Defense applications include weapons testing, vehicle structural integrity monitoring, and satellite component validation. Recent developments include high-temperature strain gauges capable of operating at temperatures exceeding 1000°C, enabling applications in jet engines and hypersonic vehicle testing. With global defense spending reaching record levels exceeding 2.2 trillion dollars annually, the demand for precision measurement technologies continues to accelerate, positioning strain gauges as critical components in national security infrastructure.
MARKET RESTRAINTS
High Initial Investment and Technical Complexity to Hinder Market Penetration
Despite growing demand, the strain gauges market faces significant restraints due to high initial investment requirements and technical complexity. Precision strain measurement systems require substantial capital expenditure, with advanced installation and calibration costs often exceeding 50% of the total system price. The need for specialized installation techniques, including surface preparation, adhesive selection, and temperature compensation, creates barriers for small and medium enterprises. Additionally, the requirement for signal conditioning equipment and data acquisition systems adds considerable expense, with complete measurement setups frequently costing between 10,000 and 100,000 dollars depending on application complexity. This financial barrier particularly affects price-sensitive markets in developing regions, where budget constraints limit adoption despite growing infrastructure needs.
Environmental Sensitivity and Calibration Challenges to Limit Reliability
Strain gauges exhibit significant sensitivity to environmental factors including temperature variations, humidity, and electromagnetic interference, creating reliability challenges in harsh operating conditions. Temperature compensation remains particularly problematic, with even advanced gauges experiencing measurement errors up to 5% in extreme temperature fluctuations. Industrial environments often subject strain gauges to vibrations, chemical exposure, and mechanical shocks that can reduce operational lifespan by up to 40%. The calibration process requires specialized equipment and expertise, with regular recalibration needed every 6-12 months depending on application criticality. These technical challenges necessitate continuous maintenance and monitoring, increasing total cost of ownership and creating adoption barriers in industries where measurement reliability is paramount.
Competition from Alternative Technologies to Constrain Market Growth
The strain gauges market faces increasing competition from emerging sensing technologies including fiber optic sensors, piezoelectric sensors, and vision-based measurement systems. Fiber optic sensors offer advantages in harsh environments, with the global market growing at approximately 12% annually compared to 4.7% for strain gauges. Wireless sensor networks and computer vision systems are increasingly replacing traditional strain measurement in applications where non-contact measurement is preferred. The automotive industry, traditionally a major strain gauge consumer, is transitioning toward optical measurement techniques for crash testing and component validation. While strain gauges maintain advantages in precision and established standards, technological evolution continues to create competitive pressure, particularly in price-sensitive applications where alternative technologies offer lower total cost of ownership.
MARKET CHALLENGES
Technical Expertise Shortage and Skill Gap to Impede Market Development
The strain gauges industry faces significant challenges due to a growing shortage of technical expertise and specialized skills. Proper installation and calibration require trained professionals with understanding of materials science, electrical engineering, and measurement principles. The global engineering talent gap exceeds 40,000 qualified professionals annually in measurement and instrumentation fields. Retirement of experienced technicians combined with insufficient educational programs creates knowledge transfer challenges. Installation errors account for approximately 30% of measurement inaccuracies in field applications, highlighting the critical need for skilled personnel. The complexity of modern measurement systems, which often integrate with digital twins and AI analytics platforms, further exacerbates the skills shortage, potentially limiting market growth despite increasing technological demand.
Other Challenges
Standardization and Compatibility Issues
The lack of global standardization creates interoperability challenges between different manufacturers’ systems. While international standards exist, implementation variations cause compatibility issues that increase integration costs by up to 25%. The absence of universal communication protocols particularly affects IoT integration, where data from different sensor types must be aggregated and analyzed. This challenge becomes more pronounced as industries move toward digital transformation, requiring seamless data exchange between legacy systems and modern platforms.
Miniaturization and Performance Trade-offs
The trend toward smaller electronic devices creates design challenges for strain gauge manufacturers. Miniaturization often compromises measurement accuracy and durability, with micro strain gauges experiencing reduced fatigue life and increased sensitivity to installation errors. The consumer electronics market demands increasingly smaller sensors while maintaining high precision, creating engineering challenges that affect product development cycles and production costs. Balancing size reduction with performance requirements remains an ongoing challenge across multiple application segments.
MARKET OPPORTUNITIES
Emerging Applications in Renewable Energy to Create New Growth Frontiers
The global transition toward renewable energy presents substantial opportunities for strain gauge applications. Wind turbine monitoring represents a particularly promising segment, with each modern turbine requiring approximately 50-100 strain gauges for blade integrity monitoring and structural health assessment. The global wind energy market is projected to grow at 9% annually, potentially creating demand for over 5 million additional strain gauges annually by 2030. Solar farm structural monitoring and hydroelectric dam safety systems also offer growth potential. Recent innovations include self-powered wireless strain gauges that harvest energy from vibration, enabling long-term monitoring in remote locations without maintenance. These developments align with global sustainability initiatives and create new market segments beyond traditional industrial applications.
Integration with Artificial Intelligence and Predictive Analytics to Enable Value Creation
The integration of strain measurement data with artificial intelligence and predictive analytics platforms creates significant value-added opportunities. AI-enhanced strain analysis can predict structural failures with over 95% accuracy, transforming maintenance from scheduled to condition-based approaches. The predictive maintenance market is growing at 25% annually, creating substantial demand for intelligent sensing solutions. Cloud-based analytics platforms enable real-time structural health monitoring across multiple sites, with data from thousands of strain gauges processed simultaneously. This technological convergence allows manufacturers to offer complete monitoring solutions rather than individual components, increasing revenue per customer and creating recurring service revenue streams. The ability to provide actionable insights rather than raw data represents a fundamental shift in value proposition and business model innovation.
Advanced Material Development and Nanotechnology Applications to Open New Markets
Advances in material science and nanotechnology present exciting opportunities for strain gauge innovation. Graphene-based strain sensors offer sensitivity improvements of up to 100 times compared to traditional foil gauges, enabling applications in medical devices and wearable technology. The flexible electronics market, projected to exceed 50 billion dollars by 2030, requires stretchable strain sensors for health monitoring and human-machine interfaces. Nanotechnology enables development of strain gauges with thicknesses measured in nanometers, suitable for micro-electromechanical systems (MEMS) and advanced composite materials. These technological advancements create opportunities in emerging sectors including biomedical engineering, soft robotics, and smart textiles, potentially expanding the addressable market beyond traditional industrial applications into consumer and healthcare segments.
STRAIN GAUGES MARKET TRENDS
Integration with IoT and Smart Sensor Networks Emerges as a Dominant Trend
The proliferation of the Internet of Things (IoT) and the demand for real-time structural health monitoring are fundamentally reshaping the strain gauges market. These devices are increasingly being integrated into smart sensor networks that provide continuous data on stress, vibration, and load in critical infrastructure such as bridges, wind turbines, and industrial machinery. This shift towards predictive maintenance, driven by the need to enhance operational safety and reduce downtime, is creating substantial demand for advanced strain measurement solutions. The global market for structural health monitoring is projected to grow significantly, further accelerating the adoption of these connected sensing systems. Furthermore, advancements in wireless strain gauge technology are eliminating the need for complex wiring, enabling easier deployment in remote or difficult-to-access locations and reducing installation costs by an estimated 15-20%.
Other Trends
Miniaturization and Enhanced Material Science
The relentless drive towards miniaturization across electronics and aerospace applications is pushing the development of smaller, more precise, and robust strain gauges. Manufacturers are innovating with new materials, including advanced polyimide carriers and proprietary alloys, to improve gauge factor stability, temperature compensation, and long-term reliability under harsh operating conditions. This is particularly critical for applications in the electric vehicle sector, where battery pack integrity monitoring requires highly sensitive and durable sensors capable of withstanding significant thermal cycling. The stress analysis type segment, which commands over 60% of the market, is a primary beneficiary of these material science innovations, enabling more accurate finite element analysis and product testing.
Automation and Robotics Driving Industrial Demand
The rapid expansion of industrial automation and robotics is a powerful catalyst for market growth. Strain gauges are essential components in robotic arms and automated systems, providing critical force and torque feedback that ensures precision, safety, and efficiency in manufacturing processes. As industries worldwide invest heavily in Industry 4.0 initiatives, the requirement for high-accuracy sensors in collaborative robots (cobots) and automated guided vehicles (AGVs) is surging. This trend is most pronounced in the Asia-Pacific region, which is both the largest manufacturing hub and the largest market for strain gauges, accounting for a dominant share of global consumption. The growth of this application segment is directly tied to increased manufacturing output and the adoption of smart factory technologies.
COMPETITIVE LANDSCAPE
Key Industry Players
Leading Players Focus on Technological Innovation and Global Expansion
The global strain gauges market exhibits a semi-consolidated structure, characterized by the presence of several established international players alongside numerous regional and specialized manufacturers. The market’s top five companies collectively command a significant share, estimated at over 70% of the global revenue, underscoring the concentrated nature of the high-end segment. This dominance is primarily driven by extensive R&D capabilities, robust patent portfolios, and long-standing relationships with key industrial end-users in sectors like aerospace, automotive, and heavy machinery.
VPG (Vishay Precision Group) and HBM (Hottinger Brüel & Kjær) are universally recognized as market leaders. VPG’s prominence is anchored in its comprehensive product range, including its proprietary Constantan alloy gauges and advanced sensor solutions, catering to precision measurement applications. HBM maintains a formidable position, particularly in Europe, due to its high-accuracy transducers and testing equipment, which are industry standards for research and development applications. Their growth is further propelled by strategic acquisitions and continuous innovation in wireless and digital strain sensing technologies.
Meanwhile, Chinese manufacturers like Zemic and Yiling have rapidly expanded their global footprint, leveraging cost-competitive production and a strong domestic market, which accounts for over 25% of global consumption. These companies are increasingly focusing on enhancing product quality and obtaining international certifications to compete more effectively in Western markets. Their aggressive pricing strategies and expanding distribution networks are key factors intensifying competition globally.
Other notable players, including KYOWA (Japan) and Omega Engineering (part of Spectris plc), are strengthening their market positions through specialized product offerings and technical expertise. KYOWA is renowned for its miniaturized gauges for electronics and medical devices, while Omega leverages its strong brand recognition and vast distribution network in North America. These companies are actively investing in developing new application-specific solutions, particularly for emerging fields like renewable energy structural monitoring and smart infrastructure, to capture growth in niche segments.
List of Key Strain Gauges Companies Profiled
- VPG (Vishay Precision Group, Inc.) (U.S.)
- HBM (Hottinger Brüel & Kjær) (Germany)
- Zemic Europe B.V. (Netherlands / China)
- Yiling (China)
- KYOWA ELECTRONIC INSTRUMENTS Co., Ltd. (Japan)
- Omega Engineering, Inc. (U.S.)
- NMB Technologies Corporation (Japan)
- TML (Tokyo Measuring Instruments Lab.) (Japan)
- Piezo-Metrics, Inc. (U.S.)
Segment Analysis:
By Type
Stress Analysis Type Segment Dominates the Market Due to Pervasive Use in Structural Health Monitoring and Material Testing
The market is segmented based on type into:
- Stress Analysis Type
- Subtypes: Foil Strain Gauges, Wire Strain Gauges, and others
- Transducer Type
- Subtypes: Load Cells, Pressure Transducers, Torque Sensors, and others
- Other (for Special Applications)
- Subtypes: High-Temperature Gauges, Cryogenic Gauges, and others
By Application
Electronics and Measurement Segment Leads Due to Critical Role in Precision Instrumentation and Sensor Systems
The market is segmented based on application into:
- Electronics and Measurement
- Construction
- Industrial
- Other
By End User
Manufacturing Sector Represents the Largest End User Segment Driven by Automation and Quality Control Needs
The market is segmented based on end user into:
- Aerospace and Defense
- Automotive
- Manufacturing
- Energy and Utilities
- Research and Academia
Regional Analysis: Strain Gauges Market
Asia-Pacific
The Asia-Pacific region dominates the global strain gauges market, accounting for over 40% of total consumption, with China alone representing more than 25% of global demand. This leadership position is driven by massive manufacturing output, extensive infrastructure development, and rapid industrial automation. China’s “Made in China 2025” initiative continues to fuel advanced manufacturing and precision measurement requirements. Meanwhile, Japan and South Korea maintain strong demand for high-accuracy strain gauges in automotive testing, robotics, and electronics manufacturing. The region’s growth is further accelerated by increasing investments in smart infrastructure projects and the expansion of renewable energy installations requiring structural health monitoring. However, price sensitivity remains a significant market characteristic, with local manufacturers like Zemic and Yiling capturing substantial market share through cost-competitive offerings.
Europe
Europe represents a mature yet technologically advanced market for strain gauges, characterized by stringent quality standards and emphasis on precision engineering. The region’s strong automotive and aerospace sectors, particularly in Germany, France, and the UK, drive demand for high-performance strain measurement solutions. European manufacturers like HBM (Germany) lead in innovation, particularly in developing advanced transducer-type strain gauges for research and development applications. The EU’s focus on industrial automation and Industry 4.0 initiatives continues to create opportunities for integrated measurement solutions. Additionally, infrastructure monitoring projects across the region, including bridge and railway structural assessments, sustain steady demand for stress analysis type strain gauges. Environmental regulations and quality certifications ensure that products meet high reliability standards, though this also increases production costs compared to Asian manufacturers.
North America
North America maintains a sophisticated strain gauges market driven by technological innovation and substantial research and development activities. The United States accounts for the majority of regional demand, supported by strong aerospace, defense, and automotive sectors requiring precision measurement solutions. Companies like VPG (Vishay Precision Group) and Omega Engineering are key players providing advanced strain gauge technologies. The region shows growing adoption in emerging applications such as renewable energy structural monitoring and biomedical engineering. Recent infrastructure investment programs have also increased demand for construction monitoring applications. While manufacturing costs are higher than in Asia, North American products are recognized for their quality and reliability, particularly in critical measurement applications where precision cannot be compromised.
South America
The South American strain gauges market is developing, with Brazil and Argentina representing the primary demand centers. The market is characterized by growing industrial automation and infrastructure development projects, though economic volatility sometimes affects investment patterns. Mining and agricultural equipment manufacturing drive most demand for strain measurement solutions, particularly in load cell applications. The region shows potential for growth in structural health monitoring as infrastructure ages and requires assessment. However, market development is constrained by limited local manufacturing capabilities and reliance on imported products, which increases costs and limits accessibility for some end-users. Price sensitivity remains high, and customers often prioritize cost over advanced features.
Middle East & Africa
This region represents an emerging market for strain gauges, with growth primarily driven by infrastructure development and industrial projects. Countries like Israel, Turkey, and the UAE show increasing adoption in construction and oil & gas applications. The market is characterized by demand for durable strain gauges capable of withstanding harsh environmental conditions. While the market remains relatively small compared to other regions, ongoing infrastructure investments and industrial diversification efforts present growth opportunities. The lack of local manufacturing means most products are imported, affecting pricing and availability. Educational and research institutions are gradually increasing their adoption of strain measurement technologies, suggesting long-term market development potential.
Report Scope
This market research report provides a comprehensive analysis of the global and regional Strain Gauges markets, covering the forecast period 2025–2032. It offers detailed insights into market dynamics, technological advancements, competitive landscape, and key trends shaping the industry.
Key focus areas of the report include:
- Market Size & Forecast: Historical data and future projections for revenue, unit shipments, and market value across major regions and segments.
- Segmentation Analysis: Detailed breakdown by product type, technology, application, and end-user industry to identify high-growth segments and investment opportunities.
- Regional Outlook: Insights into market performance across North America, Europe, Asia-Pacific, Latin America, and the Middle East & Africa, including country-level analysis where relevant.
- Competitive Landscape: Profiles of leading market participants, including their product offerings, R&D focus, manufacturing capacity, pricing strategies, and recent developments such as mergers, acquisitions, and partnerships.
- Technology Trends & Innovation: Assessment of emerging technologies, integration of AI/IoT, semiconductor design trends, fabrication techniques, and evolving industry standards.
- Market Drivers & Restraints: Evaluation of factors driving market growth along with challenges, supply chain constraints, regulatory issues, and market-entry barriers.
- Stakeholder Analysis: Insights for component suppliers, OEMs, system integrators, investors, and policymakers regarding the evolving ecosystem and strategic opportunities.
Primary and secondary research methods are employed, including interviews with industry experts, data from verified sources, and real-time market intelligence to ensure the accuracy and reliability of the insights presented.
FREQUENTLY ASKED QUESTIONS:
What is the current market size of Global Strain Gauges Market?
->Strain Gauges Market was valued at 186 million in 2024 and is projected to reach US$ 254 million by 2032, at a CAGR of 4.7% during the forecast period.
Which key companies operate in Global Strain Gauges Market?
-> Key players include VPG, HBM, Zemic, Yiling, and HYCSYQ, among others. The top five manufacturers collectively hold over 70% of the global market share.
What are the key growth drivers?
-> Key growth drivers include increasing demand from the electronics and measurement sector, industrial automation, infrastructure development, and advancements in sensor technology.
Which region dominates the market?
-> China is the largest market with over 25% share, followed by Europe and North America, which together account for over 40% of the global market.
What are the emerging trends?
-> Emerging trends include miniaturization of sensors, integration with IoT for real-time monitoring, development of wireless strain gauges, and increased use in structural health monitoring systems.

Get Sample Report PDF for Exclusive Insights
Report Sample Includes
- Table of Contents
- List of Tables & Figures
- Charts, Research Methodology, and more...


