Strain Gauge for Force Sensors Market, Trends, Business Strategies 2026-2034

Global Strain Gauge for Force Sensors market was valued at USD 132 million in 2025 and is projected to reach USD 222 million by 2032, at a CAGR of 7.9% during the forecast period

PDF Icon Download Sample Report PDF
  • Quick Dispatch

    All Orders

  • Secure Payment

    100% Secure Payment

Price range: $1,500.00 through $4,250.00

Clear

Strain Gauge for Force Sensors Market Insights

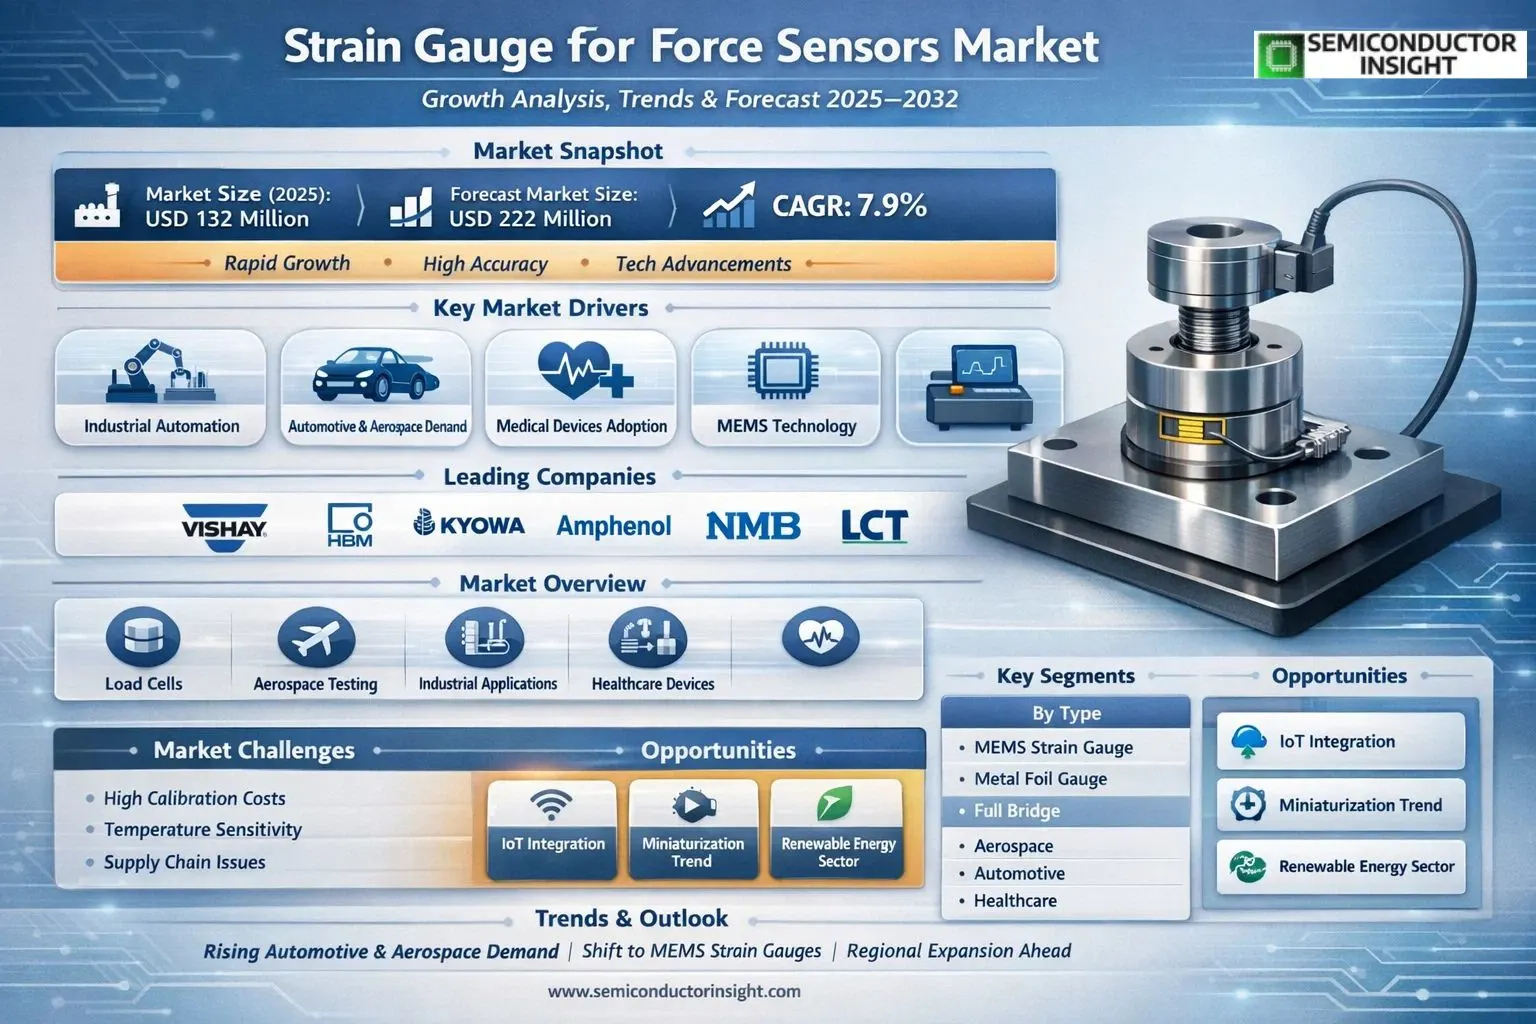
Global Strain Gauge for Force Sensors market size was valued at USD 132 million in 2025. The market is projected to reach USD 222 million by 2032, exhibiting a CAGR of 7.9% during the forecast period.

Strain Gauge for Force Sensors is a sensing element used to measure force by detecting minute deformations or strain in a material. It works by converting mechanical deformation caused by applied force into an electrical signal, which can then be measured and analyzed. These sensors are essential in applications requiring precise force detection, such as load cells and pressure transducers.

The market is experiencing steady growth due to several factors, including surging demand in automotive testing, aerospace structural monitoring, and industrial automation. Furthermore, advancements in micro-electro-mechanical systems (MEMS) technology enhance sensitivity and miniaturization, driving broader adoption. While challenges like high precision calibration persist, key players continue to innovate. For instance, companies are focusing on durable foil and silicon-based gauges for harsh environments. VISHAY, HBM, KYOWA, Amphenol, NMB, LCT, Omega, TML, BCM, and Piezo-Metrics are some of the key players operating in the market with diverse portfolios tailored to various industries.

 Strain Gauge for Force Sensors Market 2

MARKET DRIVERS

Advancements in Industrial Automation

Strain Gauge for Force Sensors Market is propelled by the rapid expansion of industrial automation, where precision force measurement is essential for robotics and machinery. With global automation investments reaching approximately $200 billion annually, demand for reliable strain gauge-based sensors has surged, enabling accurate load monitoring in manufacturing processes.

Growth in Automotive and Aerospace Sectors

In the automotive industry, strain gauges integrated into force sensors support advanced driver-assistance systems (ADAS) and electric vehicle (EV) development, contributing to a market segment valued at over 35% of total share. Aerospace applications further drive growth through structural health monitoring, where lightweight yet durable sensors ensure safety and performance under extreme conditions.

Healthcare and Medical Devices Boost Adoption

Emerging medical technologies, such as robotic surgery and prosthetics, rely on strain gauge force sensors for haptic feedback, fostering innovation and expanding market penetration in healthcare.

MARKET CHALLENGES

High Manufacturing Costs and Complexity

Strain Gauge for Force Sensors Market faces hurdles from intricate fabrication processes involving semiconductor materials, leading to production costs that can exceed 20% higher than alternative sensing technologies. This complexity hampers scalability for small to medium enterprises seeking cost-effective solutions.

Other Challenges

Temperature Sensitivity and Calibration Issues

Environmental variations pose significant challenges, as strain gauges exhibit drift rates up to 0.1% per degree Celsius, necessitating frequent recalibration and increasing operational downtime in harsh industrial settings.Supply chain disruptions, particularly for rare earth materials used in foil gauges, have intensified vulnerabilities, with lead times extending by 30-50% in recent years.

MARKET RESTRAINTS

Competition from Alternative Technologies

Intense rivalry from piezoelectric and optical force sensors restrains Strain Gauge for Force Sensors Market, as these alternatives offer superior dynamic response times, capturing over 25% of high-frequency applications traditionally held by strain gauges.Regulatory standards for sensor accuracy in safety-critical industries, such as automotive and aerospace, impose stringent testing requirements, slowing market entry and elevating compliance costs by up to 15% for new products.Market saturation in mature regions like North America and Europe limits growth potential, with penetration rates already exceeding 60%, shifting focus to less developed areas with infrastructural gaps.

MARKET OPPORTUNITIES

Integration with IoT and Industry 4.0

Strain Gauge for Force Sensors Market holds substantial promise through IoT integration, enabling real-time data analytics in smart factories projected to grow at a 12% CAGR through 2030. Wireless strain gauge modules facilitate predictive maintenance, reducing downtime by 20-30%.Miniaturization trends open doors in consumer electronics and wearables, where compact force sensors enhance user interfaces in devices like fitness trackers and gaming controllers.Expansion into renewable energy sectors, including wind turbine monitoring and structural testing for solar installations, presents untapped potential, with investments forecasted to drive 8-10% annual market uplift.

Strain Gauge for Force Sensors Market Trends

Rising Demand in Automotive and Aerospace Applications

Strain Gauge for Force Sensors Market is experiencing robust growth driven by expanding applications in automotive and aerospace sectors, where precise force measurement is critical for safety and performance. Automotive manufacturers integrate these sensors into advanced driver-assistance systems (ADAS) and electric vehicle battery management, requiring gauges that detect subtle strains under dynamic loads. Similarly, aerospace applications demand high-reliability strain gauges for structural health monitoring in aircraft components, ensuring compliance with stringent regulatory standards. This trend reflects broader industry shifts toward lightweight materials and enhanced precision, positioning strain gauges as essential components in next-generation vehicles and aircraft.

Other Trends

Shift Toward MEMS Silicon Strain Gauges

MEMS silicon strain gauges are gaining traction over traditional metal foil types due to their compact size, higher sensitivity, and compatibility with integrated electronics, particularly in industrial automation and consumer electronics. This evolution supports miniaturization trends, enabling deployment in robotics and medical devices where space constraints are paramount. Industry surveys indicate manufacturers prioritizing MEMS development to meet demands for faster response times and improved temperature stability, fostering innovation across product lines.

Regional Expansion and Competitive Dynamics

Asia-Pacific regions, including China and Japan, are pivotal in Strain Gauge for Force Sensors Market expansion, fueled by rapid industrialization and automotive production surges, while North America maintains leadership through aerospace innovations. Key players such as VISHAY, HBM, KYOWA, Amphenol, and NMB dominate with focused R&D strategies, mergers, and customized solutions to address regional needs. Competitive pressures are intensifying as suppliers respond to challenges like supply chain disruptions and raw material fluctuations, emphasizing durable designs and quality certifications. Overall, these dynamics underscore a market poised for sustained evolution through technological integration and diversified applications.

COMPETITIVE LANDSCAPE

Key Industry Players

Top Manufacturers in Strain Gauge for Force Sensors Market

Strain Gauge for Force Sensors Market is dominated by a few established leaders, with Vishay Precision Group (VISHAY), HBM (Hottinger Baldwin Messtechnik), and KYOWA Electronic Instruments emerging as the top players. These companies collectively hold a substantial market share, estimated at over 40% of global revenue in 2025, reflecting an oligopolistic structure where innovation in precision sensing and material technology drives competitive advantage. Vishay leads with its advanced foil strain gauge technologies, widely adopted in automotive and aerospace applications, while HBM excels in high-accuracy measurement solutions for industrial testing. The market’s growth, projected from $132 million in 2025 to $222 million by 2032 at a 7.9% CAGR, underscores the importance of these incumbents in setting standards for MEMS silicon and metal foil strain gauges.

Beyond the frontrunners, niche players like Amphenol, NMB Technologies, LCT Transducers, and Omega Engineering contribute significantly through specialized offerings in force measurement for industrial and other sectors. Companies such as Tokyo Measuring Instruments Lab (TML), BCM Sensor Technologies, and Piezo-Metrics focus on customized solutions, capturing segments like aerospace and automotive where reliability under extreme conditions is paramount. Emerging regional contenders from Asia, including Zhonghang Electronic Measuring Instruments and Xiamen Loadcell Technology, are gaining traction via cost-effective manufacturing, intensifying competition and fostering innovation in applications across North America, Europe, and Asia-Pacific markets.

List of Key Strain Gauge for Force Sensors Companies Profiled

  • VISHAY
  • HBM
  • KYOWA
  • Amphenol
  • NMB
  • LCT
  • Omega
  • TML
  • BCM
  • Piezo-Metrics
  • Zhonghang Electronic Measuring Instruments
  • Xiamen Loadcell Technology
  • Zhejiang Huangyan Testing Instrument Factory
  • Shandong Jinzhong Technology Group
  • Guangdong South China Sea Electronic Measuring Technology

Segment Analysis:

Segment Category Sub-Segments Key Insights
By Type
  • MEMS Silicon Strain Gauge
  • Metal Foil Strain Gauge
Metal Foil Strain Gauge

  • Established technology offering superior durability and long-term stability in demanding force measurement environments.
  • Versatile application across diverse force ranges with excellent fatigue resistance, making it ideal for continuous operation.
  • Cost-effective production enables widespread adoption in high-volume sensor manufacturing.
  • Precise strain detection with minimal hysteresis supports accurate force transduction in precision instruments.
By Application
  • Aerospace
  • Automotive
  • Industrial
  • Others
Automotive

  • Dominant due to critical role in vehicle safety systems, suspension testing, and powertrain optimization.
  • Increasing integration in electric vehicles for battery management and braking systems enhances demand.
  • Robust performance under vibration and harsh conditions aligns with automotive durability requirements.
  • Supports advancements in autonomous driving through reliable force feedback mechanisms.
By End User
  • Original Equipment Manufacturers (OEMs)
  • Testing Laboratories
  • Research Institutions
  • Others
Original Equipment Manufacturers (OEMs)

  • Leads as OEMs require high-volume, customized strain gauges for integrated force sensors in machinery.
  • Focus on seamless integration and performance consistency drives preference for reliable suppliers.
  • Scalable solutions support mass production needs in competitive manufacturing landscapes.
  • Emphasis on quality assurance and traceability meets stringent OEM certification standards.
By Configuration
  • Quarter Bridge
  • Half Bridge
  • Full Bridge
Full Bridge

  • Preferred for superior signal output and noise rejection in precise force sensing applications.
  • Enhanced temperature compensation ensures stable performance across environmental variations.
  • Optimal for high-accuracy requirements in dynamic load scenarios like robotics and presses.
  • Simplifies signal conditioning circuitry, facilitating easier integration into sensor designs.
By Resistance
  • 120 Ohm
  • 350 Ohm
  • 1000 Ohm
350 Ohm

  • Balances sensitivity and self-heating effects, ideal for battery-powered portable force sensors.
  • Standard in industry for compatibility with existing amplification and data acquisition systems.
  • Offers reliable performance in medium-strain environments common in industrial monitoring.
  • Versatile for both static and dynamic force measurements with minimal power consumption.

Regional Analysis: Strain Gauge for Force Sensors Market

Asia-Pacific

Asia-Pacific commands a pivotal position in Strain Gauge for Force Sensors Market, driven by expansive manufacturing ecosystems and diverse industrial applications. China emerges as a production powerhouse, leveraging cost-effective fabrication and massive scale to meet global demands, while Japan sets benchmarks in high-precision strain gauges for advanced force sensing. South Korea and India bolster this with robust electronics and automotive sectors, integrating these sensors into electric vehicle testing and structural monitoring systems. The region’s industrial automation surge, fueled by robotics and smart factories, heightens reliance on accurate force measurement for operational efficiency. Aerospace and renewable energy sectors further embed strain gauge technologies in load-bearing components and wind turbine monitoring. Rapid urbanization spurs infrastructure projects demanding durable sensors for construction equipment. Despite supply chain volatilities and regulatory harmonization needs, ongoing R&D investments and strategic partnerships foster innovation, positioning Asia-Pacific as the growth engine for Strain Gauge for Force Sensors Market through enhanced customization and integration capabilities.

Asia-Pacific Manufacturing Dominance
The region excels in scaling production of strain gauges for force sensors, with clusters in Shenzhen and Tokyo driving efficiency. Low-cost materials and skilled labor support high-volume output for automotive and consumer goods, enabling competitive pricing and quick market responsiveness in Strain Gauge for Force Sensors Market.
Automotive Sector Surge
Asia-Pacific’s automotive boom integrates strain gauges into braking systems, suspension testing, and EV battery monitoring. Japanese precision and Chinese assembly prowess ensure reliable force detection, supporting the shift toward autonomous vehicles and lightweight materials in this dynamic market segment.
Industrial Automation Trends
Robotics and factory automation in South Korea and China demand ultra-sensitive force sensors for precise gripping and assembly. Strain gauge advancements enhance feedback loops, reducing errors and boosting productivity across electronics and heavy machinery applications.
Innovation and Export Hubs
R&D centers in Singapore and Taiwan pioneer foil and semiconductor strain gauges, exporting to global markets. Collaborations with international firms accelerate adoption in aerospace, fortifying Asia-Pacific’s role as an innovation leader in Strain Gauge for Force Sensors Market.

North America
North America sustains a sophisticated Strain Gauge for Force Sensors Market, anchored by aerospace and defense leadership. The United States spearheads high-performance applications in aircraft load testing and missile guidance, where precision outweighs cost. Canada’s resource sector employs rugged sensors for mining equipment and oil rigs, enduring harsh conditions. Medical device innovations, including robotic surgery tools, integrate advanced strain gauges for tactile feedback. Strong IP frameworks and university-industry ties drive material science breakthroughs, like wireless strain sensing. While mature, the market evolves through sustainability-focused upgrades in automotive testing and renewable energy monitoring, balancing import dependencies with domestic customization to maintain technological edge.

Europe
Europe’s Strain Gauge for Force Sensors Market thrives on precision engineering heritage, particularly in Germany and Switzerland. Automotive giants utilize these sensors for emissions testing and crash simulations, aligning with stringent safety norms. Aerospace firms in France and the UK embed them in satellite components and UAVs for vibration analysis. Industrial machinery in Italy demands durable force measurement for quality control. EU-funded initiatives promote smart manufacturing, enhancing sensor integration in IoT platforms. Challenges like energy costs spur efficiency innovations, positioning Europe as a hub for customized, high-reliability solutions amid cross-border collaborations.

South America
South America’s Strain Gauge for Force Sensors Market gains momentum from resource extraction and agriculture mechanization. Brazil leads with sensors in heavy mining trucks for overload prevention and soil compaction monitoring in precision farming. Argentina’s automotive assembly lines adopt them for quality assurance. Infrastructure projects in infrastructure projects across Chile and Peru integrate force sensors for bridge and dam safety. Emerging local fabrication reduces import reliance, while tech transfers from global players foster growth. Economic volatilities challenge expansion, yet rising industrial investments signal untapped potential in this evolving landscape.

Middle East & Africa
The Middle East & Africa Strain Gauge for Force Sensors Market is propelled by oil & gas and construction booms. Saudi Arabia and UAE deploy sensors in drilling rigs and pipeline integrity checks for pressure management. South Africa’s mining operations rely on them for conveyor and hoist safety. Infrastructure megaprojects across the region, from skyscrapers to desalination plants, incorporate force monitoring. Limited local production drives imports, but diversification efforts into renewables introduce wind and solar applications. Skill development and partnerships enhance adoption, laying foundations for sustained regional market maturation.

Report Scope

This market research report provides a comprehensive analysis of Strain Gauge for Force Sensors Market, covering the forecast period 2025–2032. It offers detailed insights into market dynamics, technological advancements, competitive landscape, and key trends shaping the industry.

Key focus areas of the report include:

  • Market Overview: The report begins with an overview outlining its current market scenario, key growth indicators, and industry transformation drivers. It discusses macroeconomic factors, demand–supply balance, regulatory landscape, and the strategic role of strain gauges in powering advancements across industries such as aerospace, automotive, industrial, and others.
  • Market Size & Forecast: Historical data and future projections for revenue, unit shipments, and market value across major regions and segments.
  • Segmentation Analysis: Detailed breakdown by product type, technology, application, and end-user industry to identify high-growth segments and investment opportunities.
  • Regional Insights: Insights into market performance across North America, Europe, Asia, South America, Middle East & Africa, including country-level analysis where relevant.
  • Competitive Landscape: Profiles of leading market participants, including their product offerings, R&D focus, manufacturing capacity, pricing strategies, and recent developments such as mergers, acquisitions, and partnerships.
  • Technology Trends & Innovation: Assessment of emerging technologies, MEMS silicon strain gauges, metal foil gauges, fabrication techniques, and evolving industry standards.
  • Market Drivers & Restraints: Evaluation of factors driving market growth along with challenges, supply chain constraints, regulatory issues, and market-entry barriers.
  • Stakeholder Insights: Insights for component suppliers, OEMs, system integrators, investors, and policymakers regarding the evolving ecosystem and strategic opportunities.

Primary and secondary research methods are employed, including interviews with industry experts, data from verified sources, and real-time market intelligence to ensure the accuracy and reliability of the insights presented.

FREQUENTLY ASKED QUESTIONS:

What is the current market size of Strain Gauge for Force Sensors Market?

-> Global Strain Gauge for Force Sensors market was valued at USD 132 million in 2025 and is projected to reach USD 222 million by 2032, at a CAGR of 7.9% during the forecast period.

Which key companies operate in Strain Gauge for Force Sensors Market?

-> Key players include VISHAY, HBM, KYOWA, Amphenol, NMB, LCT, Omega, TML, BCM, Piezo-Metrics, among others.

What are the key growth drivers?

-> Key growth drivers include demand for precise force measurement in aerospace, automotive, industrial applications, industry trends, technological advancements.

Which region dominates the market?

-> Asia, particularly China, and North America dominate the market.

What are the emerging trends?

-> Emerging trends include MEMS Silicon Strain Gauge segment growth, metal foil strain gauges, integration in various applications.

Strain Gauge for Force Sensors Market, Trends, Business Strategies 2026-2034

Get Sample Report PDF for Exclusive Insights

Report Sample Includes

  • Table of Contents
  • List of Tables & Figures
  • Charts, Research Methodology, and more...
PDF Icon Download Sample Report PDF
SKU: bde007fbba38
Category:
License Type

Corporate License, Excel License, PDF and Excel Databook License

Download Sample Report

Table of Content

1 Introduction to Research & Analysis Reports
1.1 Strain Gauge for Force Sensors Market Definition
1.2 Market Segments
1.2.1 Segment by Type
1.2.2 Segment by Application
1.3 Global Strain Gauge for Force Sensors Market Overview
1.4 Features & Benefits of This Report
1.5 Methodology & Sources of Information
1.5.1 Research Methodology
1.5.2 Research Process
1.5.3 Base Year
1.5.4 Report Assumptions & Caveats
2 Global Strain Gauge for Force Sensors Overall Market Size
2.1 Global Strain Gauge for Force Sensors Market Size: 2025 VS 2032
2.2 Global Strain Gauge for Force Sensors Market Size, Prospects & Forecasts: 2021-2032
2.3 Global Strain Gauge for Force Sensors Sales: 2021-2032
3 Company Landscape
3.1 Top Strain Gauge for Force Sensors Players in Global Market
3.2 Top Global Strain Gauge for Force Sensors Companies Ranked by Revenue
3.3 Global Strain Gauge for Force Sensors Revenue by Companies
3.4 Global Strain Gauge for Force Sensors Sales by Companies
3.5 Global Strain Gauge for Force Sensors Price by Manufacturer (2021-2026)
3.6 Top 3 and Top 5 Strain Gauge for Force Sensors Companies in Global Market, by Revenue in 2025
3.7 Global Manufacturers Strain Gauge for Force Sensors Product Type
3.8 Tier 1, Tier 2, and Tier 3 Strain Gauge for Force Sensors Players in Global Market
3.8.1 List of Global Tier 1 Strain Gauge for Force Sensors Companies
3.8.2 List of Global Tier 2 and Tier 3 Strain Gauge for Force Sensors Companies
4 Sights by Type
4.1 Overview
4.1.1 Segment by Type – Global Strain Gauge for Force Sensors Market Size Markets, 2025 & 2032
4.1.2 MENS Silicon Strain Gauge
4.1.3 Metal Foil Strain Gauge
4.2 Segment by Type – Global Strain Gauge for Force Sensors Revenue & Forecasts
4.2.1 Segment by Type – Global Strain Gauge for Force Sensors Revenue, 2021-2026
4.2.2 Segment by Type – Global Strain Gauge for Force Sensors Revenue, 2027-2032
4.2.3 Segment by Type – Global Strain Gauge for Force Sensors Revenue Market Share, 2021-2032
4.3 Segment by Type – Global Strain Gauge for Force Sensors Sales & Forecasts
4.3.1 Segment by Type – Global Strain Gauge for Force Sensors Sales, 2021-2026
4.3.2 Segment by Type – Global Strain Gauge for Force Sensors Sales, 2027-2032
4.3.3 Segment by Type – Global Strain Gauge for Force Sensors Sales Market Share, 2021-2032
4.4 Segment by Type – Global Strain Gauge for Force Sensors Price (Manufacturers Selling Prices), 2021-2032
5 Sights by Application
5.1 Overview
5.1.1 Segment by Application – Global Strain Gauge for Force Sensors Market Size, 2025 & 2032
5.1.2 Aerospace
5.1.3 Automotive
5.1.4 Industrial
5.1.5 Others
5.2 Segment by Application – Global Strain Gauge for Force Sensors Revenue & Forecasts
5.2.1 Segment by Application – Global Strain Gauge for Force Sensors Revenue, 2021-2026
5.2.2 Segment by Application – Global Strain Gauge for Force Sensors Revenue, 2027-2032
5.2.3 Segment by Application – Global Strain Gauge for Force Sensors Revenue Market Share, 2021-2032
5.3 Segment by Application – Global Strain Gauge for Force Sensors Sales & Forecasts
5.3.1 Segment by Application – Global Strain Gauge for Force Sensors Sales, 2021-2026
5.3.2 Segment by Application – Global Strain Gauge for Force Sensors Sales, 2027-2032
5.3.3 Segment by Application – Global Strain Gauge for Force Sensors Sales Market Share, 2021-2032
5.4 Segment by Application – Global Strain Gauge for Force Sensors Price (Manufacturers Selling Prices), 2021-2032
6 Sights Region
6.1 By Region – Global Strain Gauge for Force Sensors Market Size, 2025 & 2032
6.2 By Region – Global Strain Gauge for Force Sensors Revenue & Forecasts
6.2.1 By Region – Global Strain Gauge for Force Sensors Revenue, 2021-2026
6.2.2 By Region – Global Strain Gauge for Force Sensors Revenue, 2027-2032
6.2.3 By Region – Global Strain Gauge for Force Sensors Revenue Market Share, 2021-2032
6.3 By Region – Global Strain Gauge for Force Sensors Sales & Forecasts
6.3.1 By Region – Global Strain Gauge for Force Sensors Sales, 2021-2026
6.3.2 By Region – Global Strain Gauge for Force Sensors Sales, 2027-2032
6.3.3 By Region – Global Strain Gauge for Force Sensors Sales Market Share, 2021-2032
6.4 North America
6.4.1 By Country – North America Strain Gauge for Force Sensors Revenue, 2021-2032
6.4.2 By Country – North America Strain Gauge for Force Sensors Sales, 2021-2032
6.4.3 United States Strain Gauge for Force Sensors Market Size, 2021-2032
6.4.4 Canada Strain Gauge for Force Sensors Market Size, 2021-2032
6.4.5 Mexico Strain Gauge for Force Sensors Market Size, 2021-2032
6.5 Europe
6.5.1 By Country – Europe Strain Gauge for Force Sensors Revenue, 2021-2032
6.5.2 By Country – Europe Strain Gauge for Force Sensors Sales, 2021-2032
6.5.3 Germany Strain Gauge for Force Sensors Market Size, 2021-2032
6.5.4 France Strain Gauge for Force Sensors Market Size, 2021-2032
6.5.5 U.K. Strain Gauge for Force Sensors Market Size, 2021-2032
6.5.6 Italy Strain Gauge for Force Sensors Market Size, 2021-2032
6.5.7 Russia Strain Gauge for Force Sensors Market Size, 2021-2032
6.5.8 Nordic Countries Strain Gauge for Force Sensors Market Size, 2021-2032
6.5.9 Benelux Strain Gauge for Force Sensors Market Size, 2021-2032
6.6 Asia
6.6.1 By Region – Asia Strain Gauge for Force Sensors Revenue, 2021-2032
6.6.2 By Region – Asia Strain Gauge for Force Sensors Sales, 2021-2032
6.6.3 China Strain Gauge for Force Sensors Market Size, 2021-2032
6.6.4 Japan Strain Gauge for Force Sensors Market Size, 2021-2032
6.6.5 South Korea Strain Gauge for Force Sensors Market Size, 2021-2032
6.6.6 Southeast Asia Strain Gauge for Force Sensors Market Size, 2021-2032
6.6.7 India Strain Gauge for Force Sensors Market Size, 2021-2032
6.7 South America
6.7.1 By Country – South America Strain Gauge for Force Sensors Revenue, 2021-2032
6.7.2 By Country – South America Strain Gauge for Force Sensors Sales, 2021-2032
6.7.3 Brazil Strain Gauge for Force Sensors Market Size, 2021-2032
6.7.4 Argentina Strain Gauge for Force Sensors Market Size, 2021-2032
6.8 Middle East & Africa
6.8.1 By Country – Middle East & Africa Strain Gauge for Force Sensors Revenue, 2021-2032
6.8.2 By Country – Middle East & Africa Strain Gauge for Force Sensors Sales, 2021-2032
6.8.3 Turkey Strain Gauge for Force Sensors Market Size, 2021-2032
6.8.4 Israel Strain Gauge for Force Sensors Market Size, 2021-2032
6.8.5 Saudi Arabia Strain Gauge for Force Sensors Market Size, 2021-2032
6.8.6 UAE Strain Gauge for Force Sensors Market Size, 2021-2032
7 Manufacturers & Brands Profiles
7.1 VISHAY
7.1.1 VISHAY Company Summary
7.1.2 VISHAY Business Overview
7.1.3 VISHAY Strain Gauge for Force Sensors Major Product Offerings
7.1.4 VISHAY Strain Gauge for Force Sensors Sales and Revenue in Global (2021-2026)
7.1.5 VISHAY Key News & Latest Developments
7.2 HBM
7.2.1 HBM Company Summary
7.2.2 HBM Business Overview
7.2.3 HBM Strain Gauge for Force Sensors Major Product Offerings
7.2.4 HBM Strain Gauge for Force Sensors Sales and Revenue in Global (2021-2026)
7.2.5 HBM Key News & Latest Developments
7.3 KYOWA
7.3.1 KYOWA Company Summary
7.3.2 KYOWA Business Overview
7.3.3 KYOWA Strain Gauge for Force Sensors Major Product Offerings
7.3.4 KYOWA Strain Gauge for Force Sensors Sales and Revenue in Global (2021-2026)
7.3.5 KYOWA Key News & Latest Developments
7.4 Amphenol
7.4.1 Amphenol Company Summary
7.4.2 Amphenol Business Overview
7.4.3 Amphenol Strain Gauge for Force Sensors Major Product Offerings
7.4.4 Amphenol Strain Gauge for Force Sensors Sales and Revenue in Global (2021-2026)
7.4.5 Amphenol Key News & Latest Developments
7.5 NMB
7.5.1 NMB Company Summary
7.5.2 NMB Business Overview
7.5.3 NMB Strain Gauge for Force Sensors Major Product Offerings
7.5.4 NMB Strain Gauge for Force Sensors Sales and Revenue in Global (2021-2026)
7.5.5 NMB Key News & Latest Developments
7.6 LCT
7.6.1 LCT Company Summary
7.6.2 LCT Business Overview
7.6.3 LCT Strain Gauge for Force Sensors Major Product Offerings
7.6.4 LCT Strain Gauge for Force Sensors Sales and Revenue in Global (2021-2026)
7.6.5 LCT Key News & Latest Developments
7.7 Omega
7.7.1 Omega Company Summary
7.7.2 Omega Business Overview
7.7.3 Omega Strain Gauge for Force Sensors Major Product Offerings
7.7.4 Omega Strain Gauge for Force Sensors Sales and Revenue in Global (2021-2026)
7.7.5 Omega Key News & Latest Developments
7.8 TML
7.8.1 TML Company Summary
7.8.2 TML Business Overview
7.8.3 TML Strain Gauge for Force Sensors Major Product Offerings
7.8.4 TML Strain Gauge for Force Sensors Sales and Revenue in Global (2021-2026)
7.8.5 TML Key News & Latest Developments
7.9 BCM
7.9.1 BCM Company Summary
7.9.2 BCM Business Overview
7.9.3 BCM Strain Gauge for Force Sensors Major Product Offerings
7.9.4 BCM Strain Gauge for Force Sensors Sales and Revenue in Global (2021-2026)
7.9.5 BCM Key News & Latest Developments
7.10 Piezo-Metrics
7.10.1 Piezo-Metrics Company Summary
7.10.2 Piezo-Metrics Business Overview
7.10.3 Piezo-Metrics Strain Gauge for Force Sensors Major Product Offerings
7.10.4 Piezo-Metrics Strain Gauge for Force Sensors Sales and Revenue in Global (2021-2026)
7.10.5 Piezo-Metrics Key News & Latest Developments
7.11 Zhonghang Electronic Measuring Instruments
7.11.1 Zhonghang Electronic Measuring Instruments Company Summary
7.11.2 Zhonghang Electronic Measuring Instruments Business Overview
7.11.3 Zhonghang Electronic Measuring Instruments Strain Gauge for Force Sensors Major Product Offerings
7.11.4 Zhonghang Electronic Measuring Instruments Strain Gauge for Force Sensors Sales and Revenue in Global (2021-2026)
7.11.5 Zhonghang Electronic Measuring Instruments Key News & Latest Developments
7.12 Xiamen Loadcell Technology
7.12.1 Xiamen Loadcell Technology Company Summary
7.12.2 Xiamen Loadcell Technology Business Overview
7.12.3 Xiamen Loadcell Technology Strain Gauge for Force Sensors Major Product Offerings
7.12.4 Xiamen Loadcell Technology Strain Gauge for Force Sensors Sales and Revenue in Global (2021-2026)
7.12.5 Xiamen Loadcell Technology Key News & Latest Developments
7.13 Zhejiang Huangyan Testing Instrument Factory
7.13.1 Zhejiang Huangyan Testing Instrument Factory Company Summary
7.13.2 Zhejiang Huangyan Testing Instrument Factory Business Overview
7.13.3 Zhejiang Huangyan Testing Instrument Factory Strain Gauge for Force Sensors Major Product Offerings
7.13.4 Zhejiang Huangyan Testing Instrument Factory Strain Gauge for Force Sensors Sales and Revenue in Global (2021-2026)
7.13.5 Zhejiang Huangyan Testing Instrument Factory Key News & Latest Developments
7.14 Shandong Jinzhong Technology Group
7.14.1 Shandong Jinzhong Technology Group Company Summary
7.14.2 Shandong Jinzhong Technology Group Business Overview
7.14.3 Shandong Jinzhong Technology Group Strain Gauge for Force Sensors Major Product Offerings
7.14.4 Shandong Jinzhong Technology Group Strain Gauge for Force Sensors Sales and Revenue in Global (2021-2026)
7.14.5 Shandong Jinzhong Technology Group Key News & Latest Developments
7.15 Guangdong South China Sea Electronic Measuring Technology
7.15.1 Guangdong South China Sea Electronic Measuring Technology Company Summary
7.15.2 Guangdong South China Sea Electronic Measuring Technology Business Overview
7.15.3 Guangdong South China Sea Electronic Measuring Technology Strain Gauge for Force Sensors Major Product Offerings
7.15.4 Guangdong South China Sea Electronic Measuring Technology Strain Gauge for Force Sensors Sales and Revenue in Global (2021-2026)
7.15.5 Guangdong South China Sea Electronic Measuring Technology Key News & Latest Developments
7.16 Changzhou Chuanli Weighing Technology
7.16.1 Changzhou Chuanli Weighing Technology Company Summary
7.16.2 Changzhou Chuanli Weighing Technology Business Overview
7.16.3 Changzhou Chuanli Weighing Technology Strain Gauge for Force Sensors Major Product Offerings
7.16.4 Changzhou Chuanli Weighing Technology Strain Gauge for Force Sensors Sales and Revenue in Global (2021-2026)
7.16.5 Changzhou Chuanli Weighing Technology Key News & Latest Developments
7.17 Hanzhong Jingce Electric Appliance
7.17.1 Hanzhong Jingce Electric Appliance Company Summary
7.17.2 Hanzhong Jingce Electric Appliance Business Overview
7.17.3 Hanzhong Jingce Electric Appliance Strain Gauge for Force Sensors Major Product Offerings
7.17.4 Hanzhong Jingce Electric Appliance Strain Gauge for Force Sensors Sales and Revenue in Global (2021-2026)
7.17.5 Hanzhong Jingce Electric Appliance Key News & Latest Developments
7.18 Haomeifeng Electronics
7.18.1 Haomeifeng Electronics Company Summary
7.18.2 Haomeifeng Electronics Business Overview
7.18.3 Haomeifeng Electronics Strain Gauge for Force Sensors Major Product Offerings
7.18.4 Haomeifeng Electronics Strain Gauge for Force Sensors Sales and Revenue in Global (2021-2026)
7.18.5 Haomeifeng Electronics Key News & Latest Developments
8 Global Strain Gauge for Force Sensors Production Capacity, Analysis
8.1 Global Strain Gauge for Force Sensors Production Capacity, 2021-2032
8.2 Strain Gauge for Force Sensors Production Capacity of Key Manufacturers in Global Market
8.3 Global Strain Gauge for Force Sensors Production by Region
9 Key Market Trends, Opportunity, Drivers and Restraints
9.1 Market Opportunities & Trends
9.2 Market Drivers
9.3 Market Restraints
10 Strain Gauge for Force Sensors Supply Chain Analysis
10.1 Strain Gauge for Force Sensors Industry Value Chain
10.2 Strain Gauge for Force Sensors Upstream Market
10.3 Strain Gauge for Force Sensors Downstream and Clients
10.4 Marketing Channels Analysis
10.4.1 Marketing Channels
10.4.2 Strain Gauge for Force Sensors Distributors and Sales Agents in Global
11 Conclusion
12 Appendix
12.1 Note
12.2 Examples of Clients
12.3 DisclaimerList of Tables
Table 1. Key Players of Strain Gauge for Force Sensors in Global Market
Table 2. Top Strain Gauge for Force Sensors Players in Global Market, Ranking by Revenue (2025)
Table 3. Global Strain Gauge for Force Sensors Revenue by Companies, (US$, Mn), 2021-2026
Table 4. Global Strain Gauge for Force Sensors Revenue Share by Companies, 2021-2026
Table 5. Global Strain Gauge for Force Sensors Sales by Companies, (K Units), 2021-2026
Table 6. Global Strain Gauge for Force Sensors Sales Share by Companies, 2021-2026
Table 7. Key Manufacturers Strain Gauge for Force Sensors Price (2021-2026) & (US$/Unit)
Table 8. Global Manufacturers Strain Gauge for Force Sensors Product Type
Table 9. List of Global Tier 1 Strain Gauge for Force Sensors Companies, Revenue (US$, Mn) in 2025 and Market Share
Table 10. List of Global Tier 2 and Tier 3 Strain Gauge for Force Sensors Companies, Revenue (US$, Mn) in 2025 and Market Share
Table 11. Segment by Type – Global Strain Gauge for Force Sensors Revenue, (US$, Mn), 2025 & 2032
Table 12. Segment by Type – Global Strain Gauge for Force Sensors Revenue (US$, Mn), 2021-2026
Table 13. Segment by Type – Global Strain Gauge for Force Sensors Revenue (US$, Mn), 2027-2032
Table 14. Segment by Type – Global Strain Gauge for Force Sensors Sales (K Units), 2021-2026
Table 15. Segment by Type – Global Strain Gauge for Force Sensors Sales (K Units), 2027-2032
Table 16. Segment by Application – Global Strain Gauge for Force Sensors Revenue, (US$, Mn), 2025 & 2032
Table 17. Segment by Application – Global Strain Gauge for Force Sensors Revenue, (US$, Mn), 2021-2026
Table 18. Segment by Application – Global Strain Gauge for Force Sensors Revenue, (US$, Mn), 2027-2032
Table 19. Segment by Application – Global Strain Gauge for Force Sensors Sales, (K Units), 2021-2026
Table 20. Segment by Application – Global Strain Gauge for Force Sensors Sales, (K Units), 2027-2032
Table 21. By Region – Global Strain Gauge for Force Sensors Revenue, (US$, Mn), 2025 & 2032
Table 22. By Region – Global Strain Gauge for Force Sensors Revenue, (US$, Mn), 2021-2026
Table 23. By Region – Global Strain Gauge for Force Sensors Revenue, (US$, Mn), 2027-2032
Table 24. By Region – Global Strain Gauge for Force Sensors Sales, (K Units), 2021-2026
Table 25. By Region – Global Strain Gauge for Force Sensors Sales, (K Units), 2027-2032
Table 26. By Country – North America Strain Gauge for Force Sensors Revenue, (US$, Mn), 2021-2026
Table 27. By Country – North America Strain Gauge for Force Sensors Revenue, (US$, Mn), 2027-2032
Table 28. By Country – North America Strain Gauge for Force Sensors Sales, (K Units), 2021-2026
Table 29. By Country – North America Strain Gauge for Force Sensors Sales, (K Units), 2027-2032
Table 30. By Country – Europe Strain Gauge for Force Sensors Revenue, (US$, Mn), 2021-2026
Table 31. By Country – Europe Strain Gauge for Force Sensors Revenue, (US$, Mn), 2027-2032
Table 32. By Country – Europe Strain Gauge for Force Sensors Sales, (K Units), 2021-2026
Table 33. By Country – Europe Strain Gauge for Force Sensors Sales, (K Units), 2027-2032
Table 34. By Region – Asia Strain Gauge for Force Sensors Revenue, (US$, Mn), 2021-2026
Table 35. By Region – Asia Strain Gauge for Force Sensors Revenue, (US$, Mn), 2027-2032
Table 36. By Region – Asia Strain Gauge for Force Sensors Sales, (K Units), 2021-2026
Table 37. By Region – Asia Strain Gauge for Force Sensors Sales, (K Units), 2027-2032
Table 38. By Country – South America Strain Gauge for Force Sensors Revenue, (US$, Mn), 2021-2026
Table 39. By Country – South America Strain Gauge for Force Sensors Revenue, (US$, Mn), 2027-2032
Table 40. By Country – South America Strain Gauge for Force Sensors Sales, (K Units), 2021-2026
Table 41. By Country – South America Strain Gauge for Force Sensors Sales, (K Units), 2027-2032
Table 42. By Country – Middle East & Africa Strain Gauge for Force Sensors Revenue, (US$, Mn), 2021-2026
Table 43. By Country – Middle East & Africa Strain Gauge for Force Sensors Revenue, (US$, Mn), 2027-2032
Table 44. By Country – Middle East & Africa Strain Gauge for Force Sensors Sales, (K Units), 2021-2026
Table 45. By Country – Middle East & Africa Strain Gauge for Force Sensors Sales, (K Units), 2027-2032
Table 46. VISHAY Company Summary
Table 47. VISHAY Strain Gauge for Force Sensors Product Offerings
Table 48. VISHAY Strain Gauge for Force Sensors Sales (K Units), Revenue (US$, Mn) and Average Price (US$/Unit) & (2021-2026)
Table 49. VISHAY Key News & Latest Developments
Table 50. HBM Company Summary
Table 51. HBM Strain Gauge for Force Sensors Product Offerings
Table 52. HBM Strain Gauge for Force Sensors Sales (K Units), Revenue (US$, Mn) and Average Price (US$/Unit) & (2021-2026)
Table 53. HBM Key News & Latest Developments
Table 54. KYOWA Company Summary
Table 55. KYOWA Strain Gauge for Force Sensors Product Offerings
Table 56. KYOWA Strain Gauge for Force Sensors Sales (K Units), Revenue (US$, Mn) and Average Price (US$/Unit) & (2021-2026)
Table 57. KYOWA Key News & Latest Developments
Table 58. Amphenol Company Summary
Table 59. Amphenol Strain Gauge for Force Sensors Product Offerings
Table 60. Amphenol Strain Gauge for Force Sensors Sales (K Units), Revenue (US$, Mn) and Average Price (US$/Unit) & (2021-2026)
Table 61. Amphenol Key News & Latest Developments
Table 62. NMB Company Summary
Table 63. NMB Strain Gauge for Force Sensors Product Offerings
Table 64. NMB Strain Gauge for Force Sensors Sales (K Units), Revenue (US$, Mn) and Average Price (US$/Unit) & (2021-2026)
Table 65. NMB Key News & Latest Developments
Table 66. LCT Company Summary
Table 67. LCT Strain Gauge for Force Sensors Product Offerings
Table 68. LCT Strain Gauge for Force Sensors Sales (K Units), Revenue (US$, Mn) and Average Price (US$/Unit) & (2021-2026)
Table 69. LCT Key News & Latest Developments
Table 70. Omega Company Summary
Table 71. Omega Strain Gauge for Force Sensors Product Offerings
Table 72. Omega Strain Gauge for Force Sensors Sales (K Units), Revenue (US$, Mn) and Average Price (US$/Unit) & (2021-2026)
Table 73. Omega Key News & Latest Developments
Table 74. TML Company Summary
Table 75. TML Strain Gauge for Force Sensors Product Offerings
Table 76. TML Strain Gauge for Force Sensors Sales (K Units), Revenue (US$, Mn) and Average Price (US$/Unit) & (2021-2026)
Table 77. TML Key News & Latest Developments
Table 78. BCM Company Summary
Table 79. BCM Strain Gauge for Force Sensors Product Offerings
Table 80. BCM Strain Gauge for Force Sensors Sales (K Units), Revenue (US$, Mn) and Average Price (US$/Unit) & (2021-2026)
Table 81. BCM Key News & Latest Developments
Table 82. Piezo-Metrics Company Summary
Table 83. Piezo-Metrics Strain Gauge for Force Sensors Product Offerings
Table 84. Piezo-Metrics Strain Gauge for Force Sensors Sales (K Units), Revenue (US$, Mn) and Average Price (US$/Unit) & (2021-2026)
Table 85. Piezo-Metrics Key News & Latest Developments
Table 86. Zhonghang Electronic Measuring Instruments Company Summary
Table 87. Zhonghang Electronic Measuring Instruments Strain Gauge for Force Sensors Product Offerings
Table 88. Zhonghang Electronic Measuring Instruments Strain Gauge for Force Sensors Sales (K Units), Revenue (US$, Mn) and Average Price (US$/Unit) & (2021-2026)
Table 89. Zhonghang Electronic Measuring Instruments Key News & Latest Developments
Table 90. Xiamen Loadcell Technology Company Summary
Table 91. Xiamen Loadcell Technology Strain Gauge for Force Sensors Product Offerings
Table 92. Xiamen Loadcell Technology Strain Gauge for Force Sensors Sales (K Units), Revenue (US$, Mn) and Average Price (US$/Unit) & (2021-2026)
Table 93. Xiamen Loadcell Technology Key News & Latest Developments
Table 94. Zhejiang Huangyan Testing Instrument Factory Company Summary
Table 95. Zhejiang Huangyan Testing Instrument Factory Strain Gauge for Force Sensors Product Offerings
Table 96. Zhejiang Huangyan Testing Instrument Factory Strain Gauge for Force Sensors Sales (K Units), Revenue (US$, Mn) and Average Price (US$/Unit) & (2021-2026)
Table 97. Zhejiang Huangyan Testing Instrument Factory Key News & Latest Developments
Table 98. Shandong Jinzhong Technology Group Company Summary
Table 99. Shandong Jinzhong Technology Group Strain Gauge for Force Sensors Product Offerings
Table 100. Shandong Jinzhong Technology Group Strain Gauge for Force Sensors Sales (K Units), Revenue (US$, Mn) and Average Price (US$/Unit) & (2021-2026)
Table 101. Shandong Jinzhong Technology Group Key News & Latest Developments
Table 102. Guangdong South China Sea Electronic Measuring Technology Company Summary
Table 103. Guangdong South China Sea Electronic Measuring Technology Strain Gauge for Force Sensors Product Offerings
Table 104. Guangdong South China Sea Electronic Measuring Technology Strain Gauge for Force Sensors Sales (K Units), Revenue (US$, Mn) and Average Price (US$/Unit) & (2021-2026)
Table 105. Guangdong South China Sea Electronic Measuring Technology Key News & Latest Developments
Table 106. Changzhou Chuanli Weighing Technology Company Summary
Table 107. Changzhou Chuanli Weighing Technology Strain Gauge for Force Sensors Product Offerings
Table 108. Changzhou Chuanli Weighing Technology Strain Gauge for Force Sensors Sales (K Units), Revenue (US$, Mn) and Average Price (US$/Unit) & (2021-2026)
Table 109. Changzhou Chuanli Weighing Technology Key News & Latest Developments
Table 110. Hanzhong Jingce Electric Appliance Company Summary
Table 111. Hanzhong Jingce Electric Appliance Strain Gauge for Force Sensors Product Offerings
Table 112. Hanzhong Jingce Electric Appliance Strain Gauge for Force Sensors Sales (K Units), Revenue (US$, Mn) and Average Price (US$/Unit) & (2021-2026)
Table 113. Hanzhong Jingce Electric Appliance Key News & Latest Developments
Table 114. Haomeifeng Electronics Company Summary
Table 115. Haomeifeng Electronics Strain Gauge for Force Sensors Product Offerings
Table 116. Haomeifeng Electronics Strain Gauge for Force Sensors Sales (K Units), Revenue (US$, Mn) and Average Price (US$/Unit) & (2021-2026)
Table 117. Haomeifeng Electronics Key News & Latest Developments
Table 118. Strain Gauge for Force Sensors Capacity of Key Manufacturers in Global Market, 2024-2026 (K Units)
Table 119. Global Strain Gauge for Force Sensors Capacity Market Share of Key Manufacturers, 2024-2026
Table 120. Global Strain Gauge for Force Sensors Production by Region, 2021-2026 (K Units)
Table 121. Global Strain Gauge for Force Sensors Production by Region, 2027-2032 (K Units)
Table 122. Strain Gauge for Force Sensors Market Opportunities & Trends in Global Market
Table 123. Strain Gauge for Force Sensors Market Drivers in Global Market
Table 124. Strain Gauge for Force Sensors Market Restraints in Global Market
Table 125. Strain Gauge for Force Sensors Raw Materials
Table 126. Strain Gauge for Force Sensors Raw Materials Suppliers in Global Market
Table 127. Typical Strain Gauge for Force Sensors Downstream
Table 128. Strain Gauge for Force Sensors Downstream Clients in Global Market
Table 129. Strain Gauge for Force Sensors Distributors and Sales Agents in Global Market

List of Figures
Figure 1. Strain Gauge for Force Sensors Product Picture
Figure 2. Strain Gauge for Force Sensors Segment by Type in 2025
Figure 3. Strain Gauge for Force Sensors Segment by Application in 2025
Figure 4. Global Strain Gauge for Force Sensors Market Overview: 2025
Figure 5. Key Caveats
Figure 6. Global Strain Gauge for Force Sensors Market Size: 2025 VS 2032 (US$, Mn)
Figure 7. Global Strain Gauge for Force Sensors Revenue: 2021-2032 (US$, Mn)
Figure 8. Strain Gauge for Force Sensors Sales in Global Market: 2021-2032 (K Units)
Figure 9. The Top 3 and 5 Players Market Share by Strain Gauge for Force Sensors Revenue in 2025
Figure 10. Segment by Type – Global Strain Gauge for Force Sensors Revenue, (US$, Mn), 2025 & 2032
Figure 11. Segment by Type – Global Strain Gauge for Force Sensors Revenue Market Share, 2021-2032
Figure 12. Segment by Type – Global Strain Gauge for Force Sensors Sales Market Share, 2021-2032
Figure 13. Segment by Type – Global Strain Gauge for Force Sensors Price (US$/Unit), 2021-2032
Figure 14. Segment by Application – Global Strain Gauge for Force Sensors Revenue, (US$, Mn), 2025 & 2032
Figure 15. Segment by Application – Global Strain Gauge for Force Sensors Revenue Market Share, 2021-2032
Figure 16. Segment by Application – Global Strain Gauge for Force Sensors Sales Market Share, 2021-2032
Figure 17. Segment by Application -Global Strain Gauge for Force Sensors Price (US$/Unit), 2021-2032
Figure 18. By Region – Global Strain Gauge for Force Sensors Revenue, (US$, Mn), 2025 & 2032
Figure 19. By Region – Global Strain Gauge for Force Sensors Revenue Market Share, 2021 VS 2025 VS 2032
Figure 20. By Region – Global Strain Gauge for Force Sensors Revenue Market Share, 2021-2032
Figure 21. By Region – Global Strain Gauge for Force Sensors Sales Market Share, 2021-2032
Figure 22. By Country – North America Strain Gauge for Force Sensors Revenue Market Share, 2021-2032
Figure 23. By Country – North America Strain Gauge for Force Sensors Sales Market Share, 2021-2032
Figure 24. United States Strain Gauge for Force Sensors Revenue, (US$, Mn), 2021-2032
Figure 25. Canada Strain Gauge for Force Sensors Revenue, (US$, Mn), 2021-2032
Figure 26. Mexico Strain Gauge for Force Sensors Revenue, (US$, Mn), 2021-2032
Figure 27. By Country – Europe Strain Gauge for Force Sensors Revenue Market Share, 2021-2032
Figure 28. By Country – Europe Strain Gauge for Force Sensors Sales Market Share, 2021-2032
Figure 29. Germany Strain Gauge for Force Sensors Revenue, (US$, Mn), 2021-2032
Figure 30. France Strain Gauge for Force Sensors Revenue, (US$, Mn), 2021-2032
Figure 31. U.K. Strain Gauge for Force Sensors Revenue, (US$, Mn), 2021-2032
Figure 32. Italy Strain Gauge for Force Sensors Revenue, (US$, Mn), 2021-2032
Figure 33. Russia Strain Gauge for Force Sensors Revenue, (US$, Mn), 2021-2032
Figure 34. Nordic Countries Strain Gauge for Force Sensors Revenue, (US$, Mn), 2021-2032
Figure 35. Benelux Strain Gauge for Force Sensors Revenue, (US$, Mn), 2021-2032
Figure 36. By Region – Asia Strain Gauge for Force Sensors Revenue Market Share, 2021-2032
Figure 37. By Region – Asia Strain Gauge for Force Sensors Sales Market Share, 2021-2032
Figure 38. China Strain Gauge for Force Sensors Revenue, (US$, Mn), 2021-2032
Figure 39. Japan Strain Gauge for Force Sensors Revenue, (US$, Mn), 2021-2032
Figure 40. South Korea Strain Gauge for Force Sensors Revenue, (US$, Mn), 2021-2032
Figure 41. Southeast Asia Strain Gauge for Force Sensors Revenue, (US$, Mn), 2021-2032
Figure 42. India Strain Gauge for Force Sensors Revenue, (US$, Mn), 2021-2032
Figure 43. By Country – South America Strain Gauge for Force Sensors Revenue Market Share, 2021-2032
Figure 44. By Country – South America Strain Gauge for Force Sensors Sales, Market Share, 2021-2032
Figure 45. Brazil Strain Gauge for Force Sensors Revenue, (US$, Mn), 2021-2032
Figure 46. Argentina Strain Gauge for Force Sensors Revenue, (US$, Mn), 2021-2032
Figure 47. By Country – Middle East & Africa Strain Gauge for Force Sensors Revenue, Market Share, 2021-2032
Figure 48. By Country – Middle East & Africa Strain Gauge for Force Sensors Sales, Market Share, 2021-2032
Figure 49. Turkey Strain Gauge for Force Sensors Revenue, (US$, Mn), 2021-2032
Figure 50. Israel Strain Gauge for Force Sensors Revenue, (US$, Mn), 2021-2032
Figure 51. Saudi Arabia Strain Gauge for Force Sensors Revenue, (US$, Mn), 2021-2032
Figure 52. UAE Strain Gauge for Force Sensors Revenue, (US$, Mn), 2021-2032
Figure 53. Global Strain Gauge for Force Sensors Production Capacity (K Units), 2021-2032
Figure 54. The Percentage of Production Strain Gauge for Force Sensors by Region, 2025 VS 2032
Figure 55. Strain Gauge for Force Sensors Industry Value Chain
Figure 56. Marketing Channels