Spectro-Densitometer Market Insights
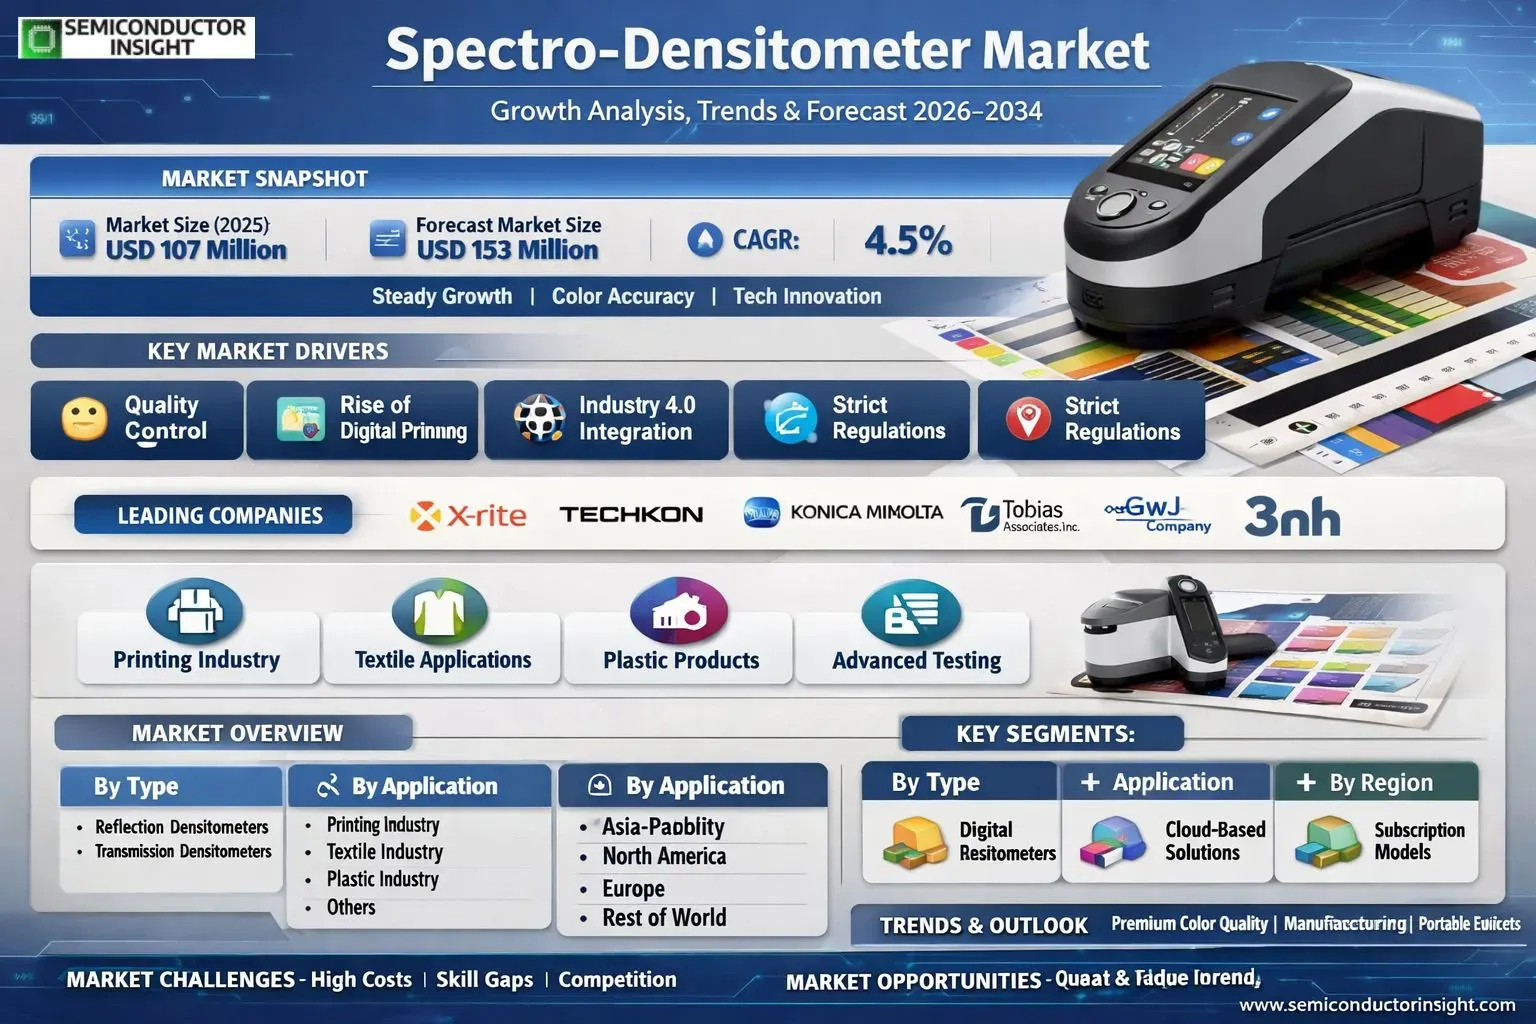
Global Spectro-Densitometer market size was valued at USD 107 million in 2025. The market is projected to grow from USD 112 million in 2026 to USD 153 million by 2034, exhibiting a CAGR of 4.5% during the forecast period.
A Spectro-Densitometer is an advanced measurement device used primarily in the printing industry to measure both optical density and color characteristics of printed materials. This instrument combines the functionality of a densitometer and a spectrophotometer, enabling it to provide detailed, precise color measurements along with density data. It is typically used to monitor and control color reproduction and ensure consistency in print quality, particularly for processes like offset printing, flexographic printing, and digital printing.
The market is experiencing steady growth due to several factors, including stringent quality control requirements in commercial packaging and labeling, alongside the rising adoption of digital printing technologies globally. However, the high cost of advanced spectro-densitometers can be a restraint for small-scale printers. Initiatives by key players are also expected to fuel market growth through product innovation focused on portability and software integration. For instance, leading manufacturers like X-Rite (now part of Danaher), Konica Minolta Sensing Americas, Inc., and Techkon GmbH continuously develop new models with enhanced connectivity for Industry 4.0 workflows. These companies operate in the market with a wide range of portfolios catering to diverse application needs across industries such as textiles and plastics beyond traditional printing.
MARKET DRIVERS
Demand for Color Consistency in High-Value Printing
Global Spectro-Densitometer Market is primarily driven by the rigorous quality control demands within commercial packaging and publishing. Industries such as luxury goods, pharmaceuticals, and food & beverage require absolute color consistency and brand integrity, necessitating precise spectral measurement. Advanced spectro-densitometers provide objective, numerical data for color matching and density, replacing subjective visual inspection and minimizing waste. This push for standardization in color management workflows directly fuels market expansion.
Integration with Industry 4.0 and Smart Manufacturing
The adoption of automation and data-driven processes is a significant catalyst. Modern spectro-densitometers feature connectivity options for seamless integration into networked printing presses and inline quality control systems. This allows for real-time monitoring and automatic ink adjustments, driving efficiency and reducing manual intervention. The trend towards smart factories in the packaging and labels sector is compelling investments in advanced measurement tools, significantly benefiting Spectro-Densitometer Market.
➤ The evolution toward process color and expanded gamut printing, exceeding standard CMYK, has made sophisticated spectral analysis indispensable for accurate characterization and reproduction.
Furthermore, increasingly stringent environmental and safety regulations, especially in food-contact packaging, mandate precise ink film thickness and opacity measurements to ensure compliance. Spectro-densitometers are critical instruments for verifying these parameters, adding a regulatory compliance driver to their technical utility.
MARKET CHALLENGES
High Initial Cost and ROI Justification
A primary challenge in Spectro-Densitometer Market is the significant capital investment required for high-end, certified devices. For small to mid-sized print shops, the cost of precision benchtop or handheld spectro-densitometers, along with necessary software and calibration tools, can be prohibitive. Convincing these potential customers of the long-term return on investment through reduced ink waste and fewer rejected jobs requires substantial demonstration and education.
Other Challenges
Rapid Technological Obsolescence and Skill Gaps
The pace of innovation in spectral technology and software integration can lead to concerns about equipment becoming outdated. Concurrently, operating these sophisticated instruments and interpreting their complex data requires trained personnel. The market faces a dual challenge of ensuring continuous technological upgrades while also addressing the skills gap in the workforce, which can hinder optimal utilization.
Competition from Alternative Color Measurement Tools
While spectro-densitometers offer comprehensive data, the market faces competition from lower-cost, dedicated densitometers and simpler colorimeters for basic applications. For operations where only basic density or spot color is measured, the full functionality of a spectro-densitometer may be deemed unnecessary, limiting market penetration in certain segments.
MARKET RESTRAINTS
Economic Sensitivity of the Core Printing Industry
Spectro-Densitometer Market is intrinsically linked to the capital expenditure cycles of Global printing and packaging industry, which is highly sensitive to broader economic fluctuations. During periods of economic contraction or uncertainty, print shops and converters often delay investments in new capital equipment, including high-end measurement and quality control instruments. This cyclical dependency poses a significant restraint on consistent year-over-year market growth.
MARKET OPPORTUNITIES
Expansion into Digital and Textile Printing Segments
The rapid growth of digital printing, particularly for packaging and signage, presents a major growth avenue for Spectro-Densitometer Market. Digital presses require frequent calibration and profiling to maintain color consistency across substrates. Similarly, the textile and apparel industry’s need for accurate color matching from design to production creates a significant opportunity for portable and automated spectro-densitometer solutions tailored to these new verticals.
Development of Cloud-Based Color Management Solutions
There is a growing opportunity to shift from standalone devices to integrated, cloud-connected ecosystems. Manufacturers in Spectro-Densitometer Market can develop platforms where measurement data is automatically uploaded, analyzed, and shared across global supply chains. This facilitates standardized color communication between brands, designers, and printers, creating a compelling value proposition centered on collaboration and traceability beyond simple measurement.
Rise of Subscription and Service-Based Models
To address the challenge of high upfront costs, vendors have an opportunity to offer spectro-densitometers through subscription or leasing models, bundled with software updates, calibration services, and technical support. This “hardware-as-a-service” approach lowers the entry barrier for smaller businesses and creates a recurring revenue stream, transforming the market’s commercial dynamics.
Key Global Spectro-Densitometer Market Trends
Increasing Demand for Premium Color Quality Control in Key Sectors
The primary demand driver for Spectro-Densitometer Market is the rigorous color quality assurance required across several demanding industries. In the printing sector, the adoption of multi-color and process printing workflows relies heavily on these combined measurement tools to maintain brand consistency, particularly in packaging and commercial printing. Beyond printing, industries such as textiles and plastics are increasingly integrating spectro-densitometers into their quality control processes. This trend is driven by the need for precise color matching of pigments and dyes across different production batches and materials, reducing waste and ensuring final product uniformity.
Other Trends
Technological Integration and Data Connectivity
Modern spectro-densitometer instruments are trending towards greater software integration and connectivity. New models are designed to seamlessly interface with color management software and cloud-based platforms, enabling real-time data analysis and remote process monitoring. This facilitates closed-loop color control systems, allowing for automated adjustments in digital and flexographic printing presses. The development of portable and handheld units further expands their utility for on-site inspections, contributing to the overall growth of Spectro-Densitometer Market by increasing accessibility across various production stages.
Competitive Landscape and Strategic Consolidation
Global Spectro-Densitometer market features established players such as X-Rite, Konica Minolta, and Techkon, which hold a significant combined revenue share. Market competition is fostering a trend focused on product innovation, including enhanced measurement accuracy and user-friendly interfaces. Furthermore, strategic activities including mergers and acquisitions are observed within the industry as companies aim to broaden their product portfolios and strengthen their geographic presence. This environment pushes continuous improvement in device capabilities, directly influencing the market’s technological trajectory.
COMPETITIVE LANDSCAPE
Key Industry Players
An Advanced Instrument Market Guided by Precision and Global Manufacturing Expertise
Spectro-Densitometer Market is moderately consolidated, with leadership held by established names in color measurement and industrial instrumentation. X-Rite, now part of Danaher Corporation’s Pantone and Esko businesses, is a dominant global force, offering integrated solutions that combine its deep color science heritage with robust hardware. Konica Minolta Sensing provides significant competition with its portfolio known for high precision and connectivity in industrial color management. The market’s competitive dynamics are driven by continuous innovation in multi-angle measurement, cloud-based data management, and device integration to support advanced printing techniques and quality control workflows across the printing, packaging, and industrial coatings sectors.
Beyond the top-tier players, numerous specialized and regional manufacturers hold significant niches. Techkon is widely recognized for its durable and high-performance benchtop and handheld devices tailored for the graphic arts industry. Established instrument companies like Tobias Associates and GWJ Company serve specific high-precision segments with specialized units. Chinese manufacturers such as 3nh and other regional players are increasingly influential, offering cost-effective solutions that are expanding market access, particularly in Asia’s fast-growing printing and textile industries. This tiered structure results in a competitive environment where technical superiority, application-specific support, and global supply chain efficiency are critical for market share.
List of Key Spectro-Densitometer Companies Profiled
- X-Rite (A Danaher Company)
- Konica Minolta Sensing Americas, Inc.
- Techkon USA
- Tobias Associates, Inc.
- GWJ Company
- FAG (Fischer-Technik GmbH & Co.)
- 3nh Technologies Co., Ltd.
- Barbieri Electronic S.R.L.
- BYK-Gardner GmbH
- Eltromat GmbH
- Graphic Technology Inc.
- Chroma Meter (Adaptive Spectrum Technologies)
- Xylem Analytics (Formerly Part of OI Analytical)
- PANTONE LLC (Danaher)
- Datacolor Inc.
Segment Analysis:
| Segment Category | Sub-Segments | Key Insights |
| By Type |
|
Reflection Densitometer represents the dominant segment, largely due to its prevalent application and primary alignment with the core market demand for analyzing opaque printed materials. This device is integral for quality control in printing across magazines, packaging, and commercial materials, enabling stringent adherence to brand color standards. Furthermore, its essential integration within press-side operations for real-time, non-destructive quality checks solidifies its indispensable role in high-volume print production environments. |
| By Application |
|
Printing Industry is the foundational application domain, serving as the primary driver for technological adoption and innovation. This leadership stems from the critical need for precise color management and consistency in high-stakes commercial, packaging, and publishing workflows, directly impacting brand integrity and customer satisfaction. The transition toward complex digital print workflows and short-run customization further amplifies the reliance on advanced spectro-densitometers to ensure seamless color transition and repeatability across diverse print jobs and substrates. |
| By End User |
|
Print Houses & Packaging Converters constitute the dominant end-user cluster, leveraging these instruments for end-to-end process control from prepress to final output. Their operational dependence is driven by the necessity to minimize waste, reduce costly press downtime for color adjustments, and comply with stringent client specifications for global brands. The increasing complexity of packaging designs, including the use of specialty inks and various substrates, mandates these users to invest in sophisticated measurement tools to maintain competitive advantage and operational efficiency. |
| By Technology Integration |
|
Portable/Handheld Devices are experiencing significant traction due to their versatility and user-centric design, which facilitates use across multiple points in the production chain, from the press floor to the finishing department. This segment’s growth is propelled by the industry’s shift toward more agile and decentralized quality assessment, allowing for immediate corrective action and supporting lean manufacturing principles. Their ability to provide lab-grade accuracy in a mobile format empowers technicians to perform reliable audits without disrupting the continuous flow of production. |
| By Distribution Channel |
|
Authorized Distributors & Resellers form the leading channel, crucial for reaching a broad and fragmented customer base that values localized technical support, training, and after-sales service. These partners provide essential value-added services, such as on-site demonstrations, calibration support, and integration consulting, which are critical for the adoption of complex measurement technology. The trust and long-term relationships built through this channel facilitate upselling to advanced solutions and ensure ongoing customer support in a market where product efficacy is closely tied to expert application and maintenance. |
Regional Analysis: Spectro-Densitometer Market
North America
North America’s market is heavily influenced by strict regulatory standards in packaging and manufacturing, mandating precise color and print density control. This regulatory environment necessitates the use of high-accuracy spectro-densitometer equipment to ensure brand consistency and compliance, particularly in food, pharmaceutical, and consumer goods sectors, creating a stable and high-value demand segment.
The region’s push towards advanced and automated manufacturing processes fuels the adoption of inline spectro-densitometer systems. These systems are integral to smart factory setups, enabling real-time color monitoring and correction, which minimizes waste, optimizes throughput, and ensures zero-defect production lines in printing and industrial coating applications.
A concentration of leading global manufacturers and specialized software developers in North America fosters a robust innovation cycle. This ecosystem drives the development of next-generation spectro-densitometer solutions with enhanced connectivity, data analytics capabilities, and user-friendly interfaces, tailored to solve complex color management challenges for end-users.
The presence of a large and sophisticated commercial printing and publishing industry, alongside premium packaging converters, sustains demand for high-end spectro-densitometer units. These users require unparalleled measurement accuracy to maintain color consistency for brand-critical materials, catalogs, and luxury packaging, supporting the market for advanced benchtop and portable models.
Europe
Europe represents a sophisticated and mature market for spectro-densitometer technologies, characterized by a strong emphasis on sustainability, precision engineering, and adherence to international quality standards. The region’s well-established packaging industry, particularly in Germany, Italy, and the UK, is a primary driver, with a focus on high-quality flexographic and offset printing for consumer goods. Environmental regulations promoting recyclable materials and efficient ink usage are pushing manufacturers to adopt precise measurement tools to optimize processes and reduce waste. Additionally, Europe’s automotive and industrial coatings sectors demand rigorous color quality control, further stimulating Spectro-Densitometer Market. Collaborative research initiatives between academic institutions and industry players continue to foster innovations in spectral analysis and software integration.
Asia-Pacific
The Asia-Pacific region is the fastest-growing market for spectro-densitometer equipment, fueled by rapid industrialization, expanding manufacturing bases, and rising quality consciousness. Countries like China, Japan, and India are seeing significant growth in packaging, textiles, and printing industries. The shift from basic densitometers to more advanced spectro-densitometer systems is evident as manufacturers seek to improve export product quality and meet international brand specifications. Government initiatives supporting domestic manufacturing and technological upgrading are creating favorable conditions for market expansion. However, the market remains price-sensitive, with varying levels of technology adoption between established industrial hubs and emerging production centers.
South America
Spectro-Densitometer Market in South America is developing, with growth centered in key economies like Brazil and Argentina. The market is primarily driven by the packaging and commercial printing sectors, which are modernizing to compete both domestically and for export markets. Investments in packaging for agricultural exports and consumer goods are creating demand for better quality control tools. While economic volatility can impact capital investment cycles, there is a growing recognition of the value spectro-densitometer systems bring in reducing material waste and ensuring color consistency. The adoption rate is gradually increasing, focusing on robust and cost-effective solutions tailored to regional industrial needs.
Middle East & Africa
The Middle East & Africa region presents a nascent but promising market for spectro-densitometer equipment. Growth is largely concentrated in the Gulf Cooperation Council (GCC) countries, driven by investments in packaging for the food & beverage, pharmaceutical, and luxury goods sectors. The establishment of regional printing hubs and a focus on import substitution are key factors. In Africa, selected markets with growing manufacturing sectors are beginning to recognize the importance of color measurement for quality assurance. Market development is gradual, influenced by economic diversification efforts and the need to meet the quality standards of international partners and consumers, signaling long-term potential for spectro-densitometer adoption.
Report Scope
This market research report provides a comprehensive analysis of the Spectro-Densitometer Market , covering the forecast period 2026–2034. It offers detailed insights into market dynamics, technological advancements, competitive landscape, and key trends shaping the industry.
Key focus areas of the report include:
- Market Overview: The report begins with an overview outlining its current market scenario, key growth indicators, and industry transformation drivers. It discusses the role of spectro-densitometers in ensuring color consistency and quality in printing and industrial processes, covering factors such as technological adoption, demand-supply balance, regulatory standards, and strategic advancements across industries such as printing, textiles, plastics, and packaging.
- Market Size & Forecast: Historical data and future projections for revenue, unit shipments, and market value across major regions and segments.
- Segmentation Analysis: Detailed breakdown by product type, technology, application, and end-user industry to identify high-growth segments and investment opportunities.
- Regional Insights: Insights into market performance across North America, Europe, Asia-Pacific, Latin America, and the Middle East & Africa, including country-level analysis where relevant.
- Competitive Landscape: Profiles of leading market participants, including their product offerings, R&D focus, manufacturing capacity, pricing strategies, and recent developments such as mergers, acquisitions, and partnerships.
- Technology Trends & Innovation: Assessment of emerging technologies, integration of advanced color measurement, automation trends, and evolving industry standards.
- Market Drivers & Restraints: Evaluation of factors driving market growth along with challenges, supply chain constraints, regulatory issues, and market-entry barriers.
- Stakeholder Insights: Insights for component suppliers, OEMs, system integrators, investors, and policymakers regarding the evolving ecosystem and strategic opportunities.
Primary and secondary research methods are employed, including interviews with industry experts, data from verified sources, and real-time market intelligence to ensure the accuracy and reliability of the insights presented.
FREQUENTLY ASKED QUESTIONS:
What is the current market size of Spectro-Densitometer Market?
-> Global Spectro-Densitometer market was valued at USD 107 million in 2025 and is projected to reach USD 153 million by 2034, growing at a CAGR of 4.5% during the forecast period.
Which key companies operate in Spectro-Densitometer Market?
-> Key players include X-Rite, Techkon, Konica Minolta, Tobias Associates, GWJ Company, FAG, and 3nh, among others.
What are the key growth drivers?
-> Key growth drivers include demand for precise color measurement and quality control in the printing industry, technological advancements in spectrophotometry, and the need for consistency in industrial applications like textiles and plastics.
Which region dominates the market?
-> The market is analyzed across regions including North America, Europe, Asia, South America, and the Middle East & Africa. Specific country-level insights cover the U.S., China, Germany, Japan, and other key markets.
What are the emerging trends?
-> Emerging trends include the integration of advanced spectral analysis, automation in print quality monitoring, and the development of portable and user-friendly spectro-densitometer devices.

Get Sample Report PDF for Exclusive Insights
Report Sample Includes
- Table of Contents
- List of Tables & Figures
- Charts, Research Methodology, and more...
 Download Sample Report PDF