Smart Variable Message Signs (VMS) Market Analysis:
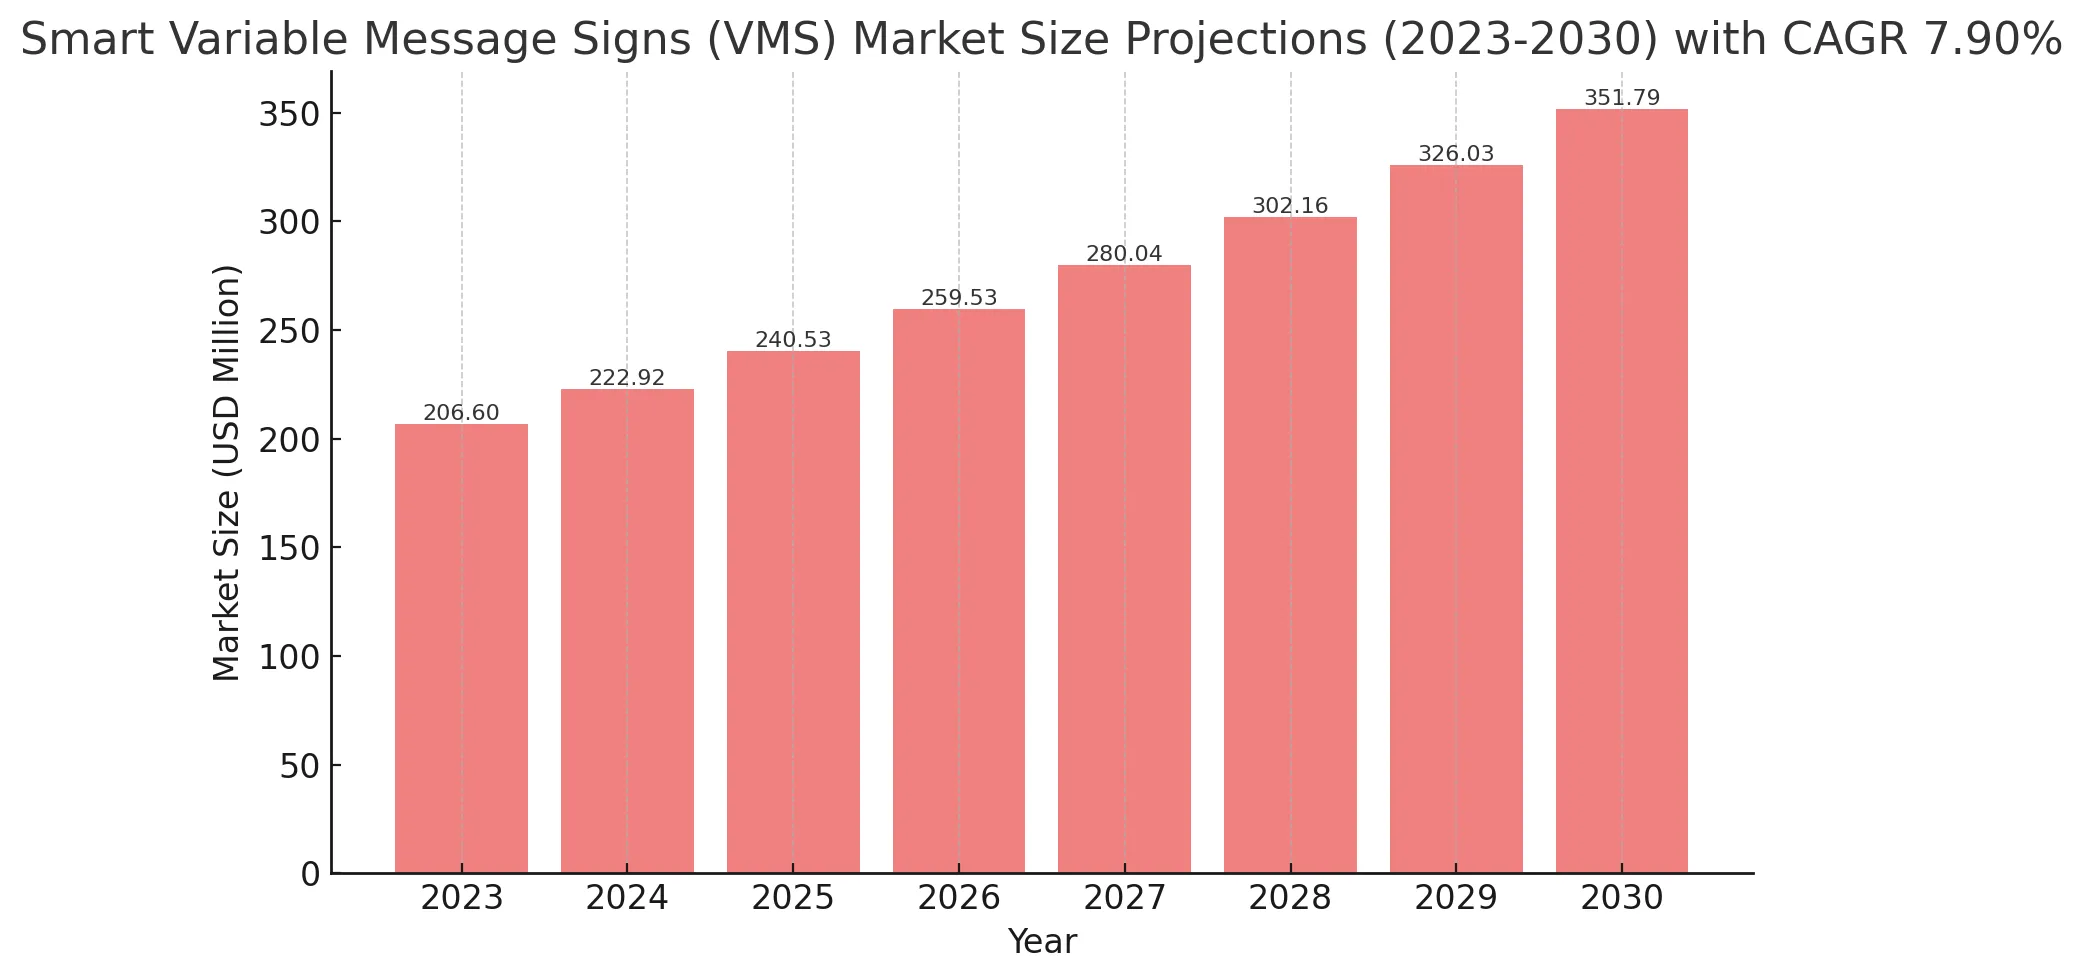
The global Smart Variable Message Signs (VMS) Market size was estimated at USD 206.60 million in 2023 and is projected to reach USD 351.79 million by 2030, exhibiting a CAGR of 7.90% during the forecast period.
North America Smart Variable Message Signs (VMS) market size was USD 53.83 million in 2023, at a CAGR of 6.77% during the forecast period of 2025 through 2030.
Smart Variable Message Signs (VMS) Market Overview
Variable Message Signs (VMS) are electronic and intelligent display panels for road traffic management that allow text and graphic variable messages to be combined, resulting in a more effective means of controlling traffic.
This report provides a deep insight into the global Smart Variable Message Signs (VMS) market covering all its essential aspects. This ranges from a macro overview of the market to micro details of the market size, competitive landscape, development trend, niche market, key market drivers and challenges, SWOT analysis, value chain analysis, etc.
The analysis helps the reader to shape the competition within the industries and strategies for the competitive environment to enhance the potential profit. Furthermore, it provides a simple framework for evaluating and accessing the position of the business organization. The report structure also focuses on the competitive landscape of the Global Smart Variable Message Signs (VMS) Market, this report introduces in detail the market share, market performance, product situation, operation situation, etc. of the main players, which helps the readers in the industry to identify the main competitors and deeply understand the competition pattern of the market.
In a word, this report is a must-read for industry players, investors, researchers, consultants, business strategists, and all those who have any kind of stake or are planning to foray into the Smart Variable Message Signs (VMS) market in any manner.
Smart Variable Message Signs (VMS) Key Market Trends :
- Integration of IoT and AI
Advanced AI and IoT integration in VMS are improving traffic flow prediction and real-time message updates. - Rise in Smart Cities Initiatives
Governments globally are investing in smart traffic management solutions, increasing demand for intelligent VMS. - Growing Demand for Eco-Friendly Solutions
Energy-efficient LED-based VMS and solar-powered systems are gaining popularity due to sustainability concerns. - Expansion of 5G Connectivity
The rollout of 5G networks is enhancing data transmission efficiency for real-time updates in VMS. - Increased Adoption in Non-Transport Sectors
VMS is increasingly used in industrial and commercial sectors for enhanced communication and safety measures.
Smart Variable Message Signs (VMS) Market Regional Analysis :

-
North America:
Strong demand driven by EVs, 5G infrastructure, and renewable energy, with the U.S. leading the market.
-
Europe:
Growth fueled by automotive electrification, renewable energy, and strong regulatory support, with Germany as a key player.
-
Asia-Pacific:
Dominates the market due to large-scale manufacturing in China and Japan, with growing demand from EVs, 5G, and semiconductors.
-
South America:
Emerging market, driven by renewable energy and EV adoption, with Brazil leading growth.
-
Middle East & Africa:
Gradual growth, mainly due to investments in renewable energy and EV infrastructure, with Saudi Arabia and UAE as key contributors.
Smart Variable Message Signs (VMS) Market Segmentation :
The research report includes specific segments by region (country), manufacturers, Type, and Application. Market segmentation creates subsets of a market based on product type, end-user or application, Geographic, and other factors. By understanding the market segments, the decision-maker can leverage this targeting in the product, sales, and marketing strategies. Market segments can power your product development cycles by informing how you create product offerings for different segments.
Key Company
- Daktronics
- Triple Sign System
- SWARCO
- Dysten
- Wanco
- Yunex Traffic
- LACROIX City
- Ver-Mac
- Efftronics Systems
- Skyline Products
- Yaham
- Hill and Smith Limited
- SESA Transportation
- Sernis
- Aesys
- Data Signs
- Coates
- Onyx Technologies
- Valmont Industries
Market Segmentation (by Type)
- Fixed Type
- Mobile Type
Market Segmentation (by Application)
- Transportation
- Industrial
- Commercial
- Others
Drivers
- Rising Traffic Congestion
Growing urbanization and vehicle density are driving demand for real-time traffic management solutions. - Government Initiatives for Smart Infrastructure
Investments in smart transportation projects are fueling market expansion globally. - Advancements in Display Technology
High-resolution LED displays and cloud-based systems are enhancing the efficiency of VMS.
Restraints
- High Initial Investment
The installation and maintenance of smart VMS require significant capital, limiting adoption in some regions. - Technical Challenges
Issues like software integration, cybersecurity threats, and hardware failures can impact market growth. - Limited Awareness in Emerging Markets
Many developing nations lack awareness and proper infrastructure for smart VMS implementation.
Opportunities
- Expansion of Smart Highways
The rise of intelligent transportation systems (ITS) is creating new opportunities for VMS manufacturers. - Adoption of Cloud-Based Solutions
Cloud connectivity in VMS allows seamless updates and remote control, enhancing market potential. - Public-Private Partnerships
Collaboration between governments and private firms can accelerate VMS deployment in key regions.
Challenges
- Regulatory and Compliance Issues
Strict government regulations and approvals can slow down new installations. - Interoperability Concerns
Different software and hardware configurations across regions create challenges in standardization. - Maintenance and Operational Costs
Regular updates, repairs, and energy consumption add to long-term costs for end-users.
Key Benefits of This Market Research:
- Industry drivers, restraints, and opportunities covered in the study
- Neutral perspective on the market performance
- Recent industry trends and developments
- Competitive landscape & strategies of key players
- Potential & niche segments and regions exhibiting promising growth covered
- Historical, current, and projected market size, in terms of value
- In-depth analysis of the Smart Variable Message Signs (VMS) Market
- Overview of the regional outlook of the Smart Variable Message Signs (VMS) Market:
Key Reasons to Buy this Report:
- Access to date statistics compiled by our researchers. These provide you with historical and forecast data, which is analyzed to tell you why your market is set to change
- This enables you to anticipate market changes to remain ahead of your competitors
- You will be able to copy data from the Excel spreadsheet straight into your marketing plans, business presentations, or other strategic documents
- The concise analysis, clear graph, and table format will enable you to pinpoint the information you require quickly
- Provision of market value (USD Billion) data for each segment and sub-segment
- Indicates the region and segment that is expected to witness the fastest growth as well as to dominate the market
- Analysis by geography highlighting the consumption of the product/service in the region as well as indicating the factors that are affecting the market within each region
- Provides insight into the market through Value Chain
- Market dynamics scenario, along with growth opportunities of the market in the years to come
- 6-month post-sales analyst support
Customization of the Report
In case of any queries or customization requirements, please connect with our sales team, who will ensure that your requirements are met.
FAQs
Q: What are the key driving factors and opportunities in the Smart Variable Message Signs (VMS) market?
A: The major driving factors include increasing urbanization, rising traffic congestion, and government investments in smart infrastructure. Opportunities lie in the adoption of cloud-based solutions, expansion of smart highways, and public-private partnerships.
Q: Which region is projected to have the largest market share?
A: North America and Europe are expected to dominate the market due to strong investments in smart transportation and advanced infrastructure.
Q: Who are the top players in the global Smart Variable Message Signs (VMS) market?
A: Leading companies include Daktronics, Triple Sign System, SWARCO, Dysten, Wanco, and Yunex Traffic, among others.
Q: What are the latest technological advancements in the industry?
A: Key advancements include AI-powered traffic analysis, IoT-enabled VMS, high-resolution LED displays, and integration with 5G networks.
Q: What is the current size of the global Smart Variable Message Signs (VMS) market?
A: As of 2023, the market size was estimated at USD 206.60 million and is expected to reach USD 351.79 million by 2030, growing at a CAGR of 7.90%.

Get Sample Report PDF for Exclusive Insights
Report Sample Includes
- Table of Contents
- List of Tables & Figures
- Charts, Research Methodology, and more...