Smart Roads Anemometers Market, Size, Trends, Business Strategies 2025-2032

The global Smart Roads Anemometers Market size was estimated at USD 1650 million in 2023 and is projected to reach USD 2384.34 million by 2030, exhibiting a CAGR of 5.40% during the forecast period.

PDF Icon Download Sample Report PDF
  • Quick Dispatch

    All Orders

  • Secure Payment

    100% Secure Payment

Price range: $1,500.00 through $4,250.00

Clear

Smart Roads Anemometers Market Overview

The smart road is the type of advanced technology which guides the drivers of vehicles against any object which is in front of the vehicle. These roads help to reduce the vehicle emissions by identifying best and shortest route for any vehicle to reach its destination.An anemometer is a wind measurement tool which measures intensity, wind direction, amplitude and speed. Physicists use it to study the path of airflow. They come in both digital and manual versions. Anemometers are available in a variety of sizes and shapes. Some are moveable handheld anemometers, while others are fixed.

This report provides a deep insight into the global Smart Roads Anemometers market covering all its essential aspects. This ranges from a macro overview of the market to micro details of the market size, competitive landscape, development trend, niche market, key market drivers and challenges, SWOT analysis, value chain analysis, etc.

The analysis helps the reader to shape the competition within the industries and strategies for the competitive environment to enhance the potential profit. Furthermore, it provides a simple framework for evaluating and accessing the position of the business organization. The report structure also focuses on the competitive landscape of the Global Smart Roads Anemometers Market, this report introduces in detail the market share, market performance, product situation, operation situation, etc. of the main players, which helps the readers in the industry to identify the main competitors and deeply understand the competition pattern of the market.
In a word, this report is a must-read for industry players, investors, researchers, consultants, business strategists, and all those who have any kind of stake or are planning to foray into the Smart Roads Anemometers market in any manner.

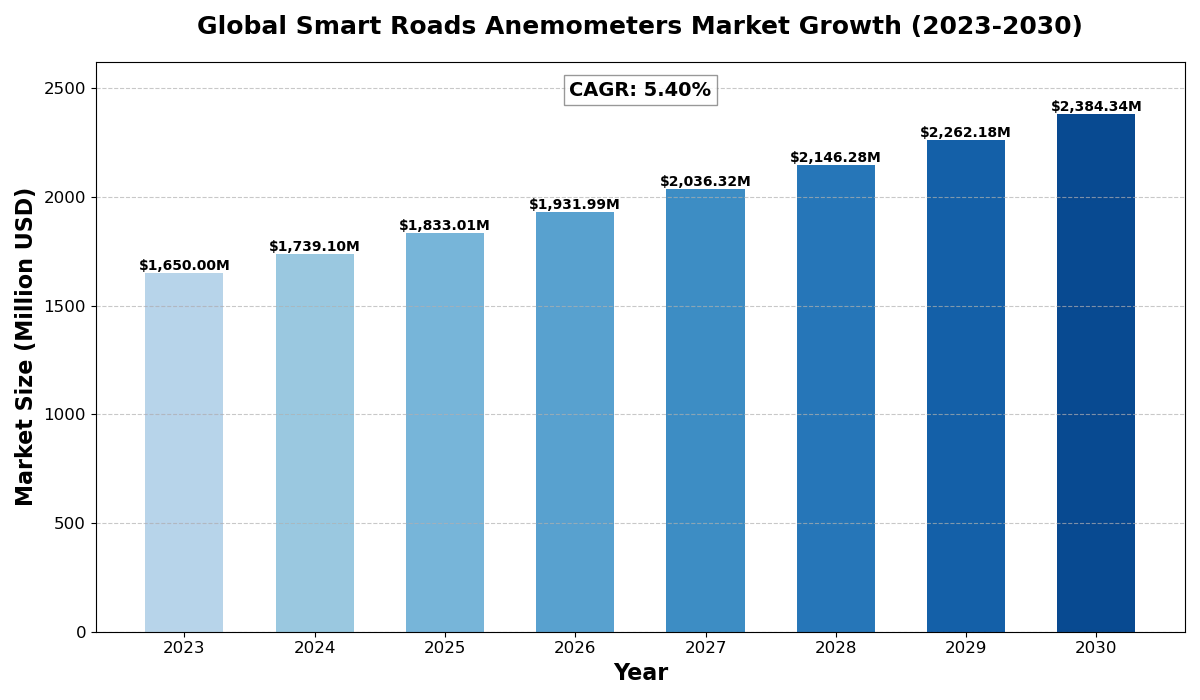
Smart Roads Anemometers Market Analysis:

The global Smart Roads Anemometers Market size was estimated at USD 1650 million in 2023 and is projected to reach USD 2384.34 million by 2030, exhibiting a CAGR of 5.40% during the forecast period.

North America Smart Roads Anemometers market size was USD 429.94 million in 2023, at a CAGR of 4.63% during the forecast period of 2025 through 2030.

Smart Roads Anemometers Key Market Trends  :

  1. Growing Adoption of Smart Road Technologies
    The integration of AI, IoT, and cloud computing in smart road infrastructure is increasing to enhance road safety and efficiency.
  2. Rising Demand for Traffic Management Solutions
    Governments and private firms are investing in smart traffic systems that use anemometers to optimize vehicle movement and reduce congestion.
  3. Expansion of Smart City Projects
    The global push towards smart cities is boosting the adoption of intelligent road systems, including advanced anemometers for wind monitoring.
  4. Shift Towards Sustainable and Energy-Efficient Solutions
    The focus on reducing vehicle emissions and improving road safety is driving the development of energy-efficient anemometers.
  5. Advancements in Sensor and Communication Technologies
    Innovations in sensor accuracy and real-time data processing are improving the efficiency of smart road anemometers.

Smart Roads Anemometers Market Regional Analysis :

semi insight

  • North America:

    Strong demand driven by EVs, 5G infrastructure, and renewable energy, with the U.S. leading the market.

  • Europe:

    Growth fueled by automotive electrification, renewable energy, and strong regulatory support, with Germany as a key player.

  • Asia-Pacific:

    Dominates the market due to large-scale manufacturing in China and Japan, with growing demand from EVs, 5G, and semiconductors.

  • South America:

    Emerging market, driven by renewable energy and EV adoption, with Brazil leading growth.

  • Middle East & Africa:

    Gradual growth, mainly due to investments in renewable energy and EV infrastructure, with Saudi Arabia and UAE as key contributors.

Smart Roads Anemometers Market Segmentation :

The research report includes specific segments by region (country), manufacturers, Type, and Application. Market segmentation creates subsets of a market based on product type, end-user or application, Geographic, and other factors. By understanding the market segments, the decision-maker can leverage this targeting in the product, sales, and marketing strategies. Market segments can power your product development cycles by informing how you create product offerings for different segments.
Key Company

  • Schneider Electric
  • Siemens
  • Intel Corporation
  • General Electric
  • Accenture
  • Thales Group
  • ABB
  • AT&T Intellectual Property
  • Honeywell International Inc
  • Infineon Technologies AG
  • DNV GL
  • ALE International
  • Kapsch TrafficCom AG
  • LG CNS
  • Cisco
  • Xerox Corporation
  • Huawei Technologies Co.
Market Segmentation (by Type)
  • On-Premise
  • On-Cloud
Market Segmentation (by Application)
  • Transportation and Communication Systems
  • Traffic Management System

Market Drivers

  • Increase in Smart Road Investments
    Governments and private enterprises are heavily investing in smart road infrastructure, boosting demand for advanced anemometers.
  • Rising Traffic Congestion Issues
    Urbanization and the growing number of vehicles are increasing the need for smart traffic management solutions.
  • Technological Advancements in IoT and AI
    The use of AI-driven analytics and IoT sensors is enhancing the efficiency of smart roads anemometers.

Market Restraints

  • High Initial Investment Costs
    The deployment of smart road technology requires significant capital, which may hinder adoption in developing regions.
  • Lack of Standardization in Smart Road Infrastructure
    The absence of unified regulations and standards across different regions can slow down market growth.
  • Data Security and Privacy Concerns
    The integration of IoT and cloud-based systems raises concerns about cyber threats and data breaches.

Market Opportunities

  • Emerging Smart City Initiatives
    Increasing global initiatives for smart city development present a major growth opportunity for smart road technologies.
  • Growing Demand for Real-Time Traffic Solutions
    The need for accurate weather and traffic data is driving the adoption of advanced anemometers.
  • Integration with Renewable Energy Solutions
    Smart roads combined with solar and wind energy solutions offer sustainable growth prospects.

Market Challenges

  • Complex Implementation Process
    The integration of smart road technologies with existing infrastructure poses a significant challenge.
  • Technical Limitations in Extreme Weather Conditions
    Harsh environmental conditions can impact the performance and accuracy of anemometers.
  • Limited Awareness and Adoption in Developing Regions
    Many developing regions lack awareness and resources to adopt smart road solutions efficiently.

Key Benefits of This Market Research:

  • Industry drivers, restraints, and opportunities covered in the study
  • Neutral perspective on the market performance
  • Recent industry trends and developments
  • Competitive landscape & strategies of key players
  • Potential & niche segments and regions exhibiting promising growth covered
  • Historical, current, and projected market size, in terms of value
  • In-depth analysis of the Smart Roads Anemometers Market
  • Overview of the regional outlook of the Smart Roads Anemometers Market:

Key Reasons to Buy this Report:

  • Access to date statistics compiled by our researchers. These provide you with historical and forecast data, which is analyzed to tell you why your market is set to change
  • This enables you to anticipate market changes to remain ahead of your competitors
  • You will be able to copy data from the Excel spreadsheet straight into your marketing plans, business presentations, or other strategic documents
  • The concise analysis, clear graph, and table format will enable you to pinpoint the information you require quickly
  • Provision of market value (USD Billion) data for each segment and sub-segment
  • Indicates the region and segment that is expected to witness the fastest growth as well as to dominate the market
  • Provides insight into the market through Value Chain
  • Market dynamics scenario, along with growth opportunities of the market in the years to come
  • 6-month post-sales analyst support

Customization of the Report
In case of any queries or customization requirements, please connect with our sales team, who will ensure that your requirements are met.


FAQs

Q: What are the key driving factors and opportunities in the Smart Roads Anemometers market?

A: The major drivers include increasing investments in smart roads, rising urban traffic congestion, and advancements in IoT and AI. Opportunities lie in smart city projects, real-time traffic management solutions, and integration with renewable energy.


Q: Which region is projected to have the largest market share?

A: North America is expected to dominate the market due to strong government support, high adoption of smart technologies, and significant investments in infrastructure development.


Q: Who are the top players in the global Smart Roads Anemometers market?

A: Key players include Schneider Electric, Siemens, Intel Corporation, General Electric, Honeywell International Inc, ABB, Cisco, and Huawei Technologies.


Q: What are the latest technological advancements in the industry?

A: Innovations in AI-based traffic management, IoT-enabled wind sensors, real-time data analytics, and cloud-based monitoring systems are shaping the future of smart road anemometers.


Q: What is the current size of the global Smart Roads Anemometers market?

A: The market was valued at USD 1,650 million in 2023 and is projected to reach USD 2,384.34 million by 2030, growing at a CAGR of 5.40%.

Smart Roads Anemometers Market, Size, Trends, Business Strategies 2025-2032

Get Sample Report PDF for Exclusive Insights

Report Sample Includes

  • Table of Contents
  • List of Tables & Figures
  • Charts, Research Methodology, and more...
PDF Icon Download Sample Report PDF

Download Sample Report

Table of Content

Table of Contents
1 Research Methodology and Statistical Scope
1.1 Market Definition and Statistical Scope of Smart Roads Anemometers
1.2 Key Market Segments
1.2.1 Smart Roads Anemometers Segment by Type
1.2.2 Smart Roads Anemometers Segment by Application
1.3 Methodology & Sources of Information
1.3.1 Research Methodology
1.3.2 Research Process
1.3.3 Market Breakdown and Data Triangulation
1.3.4 Base Year
1.3.5 Report Assumptions & Caveats
2 Smart Roads Anemometers Market Overview
2.1 Global Market Overview
2.1.1 Global Smart Roads Anemometers Market Size (M USD) Estimates and Forecasts (2019-2030)
2.1.2 Global Smart Roads Anemometers Sales Estimates and Forecasts (2019-2030)
2.2 Market Segment Executive Summary
2.3 Global Market Size by Region
3 Smart Roads Anemometers Market Competitive Landscape
3.1 Global Smart Roads Anemometers Sales by Manufacturers (2019-2025)
3.2 Global Smart Roads Anemometers Revenue Market Share by Manufacturers (2019-2025)
3.3 Smart Roads Anemometers Market Share by Company Type (Tier 1, Tier 2, and Tier 3)
3.4 Global Smart Roads Anemometers Average Price by Manufacturers (2019-2025)
3.5 Manufacturers Smart Roads Anemometers Sales Sites, Area Served, Product Type
3.6 Smart Roads Anemometers Market Competitive Situation and Trends
3.6.1 Smart Roads Anemometers Market Concentration Rate
3.6.2 Global 5 and 10 Largest Smart Roads Anemometers Players Market Share by Revenue
3.6.3 Mergers & Acquisitions, Expansion
4 Smart Roads Anemometers Industry Chain Analysis
4.1 Smart Roads Anemometers Industry Chain Analysis
4.2 Market Overview of Key Raw Materials
4.3 Midstream Market Analysis
4.4 Downstream Customer Analysis
5 The Development and Dynamics of Smart Roads Anemometers Market
5.1 Key Development Trends
5.2 Driving Factors
5.3 Market Challenges
5.4 Market Restraints
5.5 Industry News
5.5.1 New Product Developments
5.5.2 Mergers & Acquisitions
5.5.3 Expansions
5.5.4 Collaboration/Supply Contracts
5.6 Industry Policies
6 Smart Roads Anemometers Market Segmentation by Type
6.1 Evaluation Matrix of Segment Market Development Potential (Type)
6.2 Global Smart Roads Anemometers Sales Market Share by Type (2019-2025)
6.3 Global Smart Roads Anemometers Market Size Market Share by Type (2019-2025)
6.4 Global Smart Roads Anemometers Price by Type (2019-2025)
7 Smart Roads Anemometers Market Segmentation by Application
7.1 Evaluation Matrix of Segment Market Development Potential (Application)
7.2 Global Smart Roads Anemometers Market Sales by Application (2019-2025)
7.3 Global Smart Roads Anemometers Market Size (M USD) by Application (2019-2025)
7.4 Global Smart Roads Anemometers Sales Growth Rate by Application (2019-2025)
8 Smart Roads Anemometers Market Segmentation by Region
8.1 Global Smart Roads Anemometers Sales by Region
8.1.1 Global Smart Roads Anemometers Sales by Region
8.1.2 Global Smart Roads Anemometers Sales Market Share by Region
8.2 North America
8.2.1 North America Smart Roads Anemometers Sales by Country
8.2.2 U.S.
8.2.3 Canada
8.2.4 Mexico
8.3 Europe
8.3.1 Europe Smart Roads Anemometers Sales by Country
8.3.2 Germany
8.3.3 France
8.3.4 U.K.
8.3.5 Italy
8.3.6 Russia
8.4 Asia Pacific
8.4.1 Asia Pacific Smart Roads Anemometers Sales by Region
8.4.2 China
8.4.3 Japan
8.4.4 South Korea
8.4.5 India
8.4.6 Southeast Asia
8.5 South America
8.5.1 South America Smart Roads Anemometers Sales by Country
8.5.2 Brazil
8.5.3 Argentina
8.5.4 Columbia
8.6 Middle East and Africa
8.6.1 Middle East and Africa Smart Roads Anemometers Sales by Region
8.6.2 Saudi Arabia
8.6.3 UAE
8.6.4 Egypt
8.6.5 Nigeria
8.6.6 South Africa
9 Key Companies Profile
9.1 Schneider Electric
9.1.1 Schneider Electric Smart Roads Anemometers Basic Information
9.1.2 Schneider Electric Smart Roads Anemometers Product Overview
9.1.3 Schneider Electric Smart Roads Anemometers Product Market Performance
9.1.4 Schneider Electric Business Overview
9.1.5 Schneider Electric Smart Roads Anemometers SWOT Analysis
9.1.6 Schneider Electric Recent Developments
9.2 Siemens
9.2.1 Siemens Smart Roads Anemometers Basic Information
9.2.2 Siemens Smart Roads Anemometers Product Overview
9.2.3 Siemens Smart Roads Anemometers Product Market Performance
9.2.4 Siemens Business Overview
9.2.5 Siemens Smart Roads Anemometers SWOT Analysis
9.2.6 Siemens Recent Developments
9.3 Intel Corporation
9.3.1 Intel Corporation Smart Roads Anemometers Basic Information
9.3.2 Intel Corporation Smart Roads Anemometers Product Overview
9.3.3 Intel Corporation Smart Roads Anemometers Product Market Performance
9.3.4 Intel Corporation Smart Roads Anemometers SWOT Analysis
9.3.5 Intel Corporation Business Overview
9.3.6 Intel Corporation Recent Developments
9.4 General Electric
9.4.1 General Electric Smart Roads Anemometers Basic Information
9.4.2 General Electric Smart Roads Anemometers Product Overview
9.4.3 General Electric Smart Roads Anemometers Product Market Performance
9.4.4 General Electric Business Overview
9.4.5 General Electric Recent Developments
9.5 Accenture
9.5.1 Accenture Smart Roads Anemometers Basic Information
9.5.2 Accenture Smart Roads Anemometers Product Overview
9.5.3 Accenture Smart Roads Anemometers Product Market Performance
9.5.4 Accenture Business Overview
9.5.5 Accenture Recent Developments
9.6 Thales Group
9.6.1 Thales Group Smart Roads Anemometers Basic Information
9.6.2 Thales Group Smart Roads Anemometers Product Overview
9.6.3 Thales Group Smart Roads Anemometers Product Market Performance
9.6.4 Thales Group Business Overview
9.6.5 Thales Group Recent Developments
9.7 ABB
9.7.1 ABB Smart Roads Anemometers Basic Information
9.7.2 ABB Smart Roads Anemometers Product Overview
9.7.3 ABB Smart Roads Anemometers Product Market Performance
9.7.4 ABB Business Overview
9.7.5 ABB Recent Developments
9.8 ATandT Intellectual Property
9.8.1 ATandT Intellectual Property Smart Roads Anemometers Basic Information
9.8.2 ATandT Intellectual Property Smart Roads Anemometers Product Overview
9.8.3 ATandT Intellectual Property Smart Roads Anemometers Product Market Performance
9.8.4 ATandT Intellectual Property Business Overview
9.8.5 ATandT Intellectual Property Recent Developments
9.9 Honeywell International Inc
9.9.1 Honeywell International Inc Smart Roads Anemometers Basic Information
9.9.2 Honeywell International Inc Smart Roads Anemometers Product Overview
9.9.3 Honeywell International Inc Smart Roads Anemometers Product Market Performance
9.9.4 Honeywell International Inc Business Overview
9.9.5 Honeywell International Inc Recent Developments
9.10 Infineon Technologies AG
9.10.1 Infineon Technologies AG Smart Roads Anemometers Basic Information
9.10.2 Infineon Technologies AG Smart Roads Anemometers Product Overview
9.10.3 Infineon Technologies AG Smart Roads Anemometers Product Market Performance
9.10.4 Infineon Technologies AG Business Overview
9.10.5 Infineon Technologies AG Recent Developments
9.11 DNV GL
9.11.1 DNV GL Smart Roads Anemometers Basic Information
9.11.2 DNV GL Smart Roads Anemometers Product Overview
9.11.3 DNV GL Smart Roads Anemometers Product Market Performance
9.11.4 DNV GL Business Overview
9.11.5 DNV GL Recent Developments
9.12 ALE International
9.12.1 ALE International Smart Roads Anemometers Basic Information
9.12.2 ALE International Smart Roads Anemometers Product Overview
9.12.3 ALE International Smart Roads Anemometers Product Market Performance
9.12.4 ALE International Business Overview
9.12.5 ALE International Recent Developments
9.13 Kapsch TrafficCom AG
9.13.1 Kapsch TrafficCom AG Smart Roads Anemometers Basic Information
9.13.2 Kapsch TrafficCom AG Smart Roads Anemometers Product Overview
9.13.3 Kapsch TrafficCom AG Smart Roads Anemometers Product Market Performance
9.13.4 Kapsch TrafficCom AG Business Overview
9.13.5 Kapsch TrafficCom AG Recent Developments
9.14 LG CNS
9.14.1 LG CNS Smart Roads Anemometers Basic Information
9.14.2 LG CNS Smart Roads Anemometers Product Overview
9.14.3 LG CNS Smart Roads Anemometers Product Market Performance
9.14.4 LG CNS Business Overview
9.14.5 LG CNS Recent Developments
9.15 Cisco
9.15.1 Cisco Smart Roads Anemometers Basic Information
9.15.2 Cisco Smart Roads Anemometers Product Overview
9.15.3 Cisco Smart Roads Anemometers Product Market Performance
9.15.4 Cisco Business Overview
9.15.5 Cisco Recent Developments
9.16 Xerox Corporation
9.16.1 Xerox Corporation Smart Roads Anemometers Basic Information
9.16.2 Xerox Corporation Smart Roads Anemometers Product Overview
9.16.3 Xerox Corporation Smart Roads Anemometers Product Market Performance
9.16.4 Xerox Corporation Business Overview
9.16.5 Xerox Corporation Recent Developments
9.17 Huawei Technologies Co.
9.17.1 Huawei Technologies Co. Smart Roads Anemometers Basic Information
9.17.2 Huawei Technologies Co. Smart Roads Anemometers Product Overview
9.17.3 Huawei Technologies Co. Smart Roads Anemometers Product Market Performance
9.17.4 Huawei Technologies Co. Business Overview
9.17.5 Huawei Technologies Co. Recent Developments
10 Smart Roads Anemometers Market Forecast by Region
10.1 Global Smart Roads Anemometers Market Size Forecast
10.2 Global Smart Roads Anemometers Market Forecast by Region
10.2.1 North America Market Size Forecast by Country
10.2.2 Europe Smart Roads Anemometers Market Size Forecast by Country
10.2.3 Asia Pacific Smart Roads Anemometers Market Size Forecast by Region
10.2.4 South America Smart Roads Anemometers Market Size Forecast by Country
10.2.5 Middle East and Africa Forecasted Consumption of Smart Roads Anemometers by Country
11 Forecast Market by Type and by Application (2025-2030)
11.1 Global Smart Roads Anemometers Market Forecast by Type (2025-2030)
11.1.1 Global Forecasted Sales of Smart Roads Anemometers by Type (2025-2030)
11.1.2 Global Smart Roads Anemometers Market Size Forecast by Type (2025-2030)
11.1.3 Global Forecasted Price of Smart Roads Anemometers by Type (2025-2030)
11.2 Global Smart Roads Anemometers Market Forecast by Application (2025-2030)
11.2.1 Global Smart Roads Anemometers Sales (K Units) Forecast by Application
11.2.2 Global Smart Roads Anemometers Market Size (M USD) Forecast by Application (2025-2030)
12 Conclusion and Key FindingsList of Tables
Table 1. Introduction of the Type
Table 2. Introduction of the Application
Table 3. Market Size (M USD) Segment Executive Summary
Table 4. Smart Roads Anemometers Market Size Comparison by Region (M USD)
Table 5. Global Smart Roads Anemometers Sales (K Units) by Manufacturers (2019-2025)
Table 6. Global Smart Roads Anemometers Sales Market Share by Manufacturers (2019-2025)
Table 7. Global Smart Roads Anemometers Revenue (M USD) by Manufacturers (2019-2025)
Table 8. Global Smart Roads Anemometers Revenue Share by Manufacturers (2019-2025)
Table 9. Company Type (Tier 1, Tier 2, and Tier 3) & (based on the Revenue in Smart Roads Anemometers as of 2022)
Table 10. Global Market Smart Roads Anemometers Average Price (USD/Unit) of Key Manufacturers (2019-2025)
Table 11. Manufacturers Smart Roads Anemometers Sales Sites and Area Served
Table 12. Manufacturers Smart Roads Anemometers Product Type
Table 13. Global Smart Roads Anemometers Manufacturers Market Concentration Ratio (CR5 and HHI)
Table 14. Mergers & Acquisitions, Expansion Plans
Table 15. Industry Chain Map of Smart Roads Anemometers
Table 16. Market Overview of Key Raw Materials
Table 17. Midstream Market Analysis
Table 18. Downstream Customer Analysis
Table 19. Key Development Trends
Table 20. Driving Factors
Table 21. Smart Roads Anemometers Market Challenges
Table 22. Global Smart Roads Anemometers Sales by Type (K Units)
Table 23. Global Smart Roads Anemometers Market Size by Type (M USD)
Table 24. Global Smart Roads Anemometers Sales (K Units) by Type (2019-2025)
Table 25. Global Smart Roads Anemometers Sales Market Share by Type (2019-2025)
Table 26. Global Smart Roads Anemometers Market Size (M USD) by Type (2019-2025)
Table 27. Global Smart Roads Anemometers Market Size Share by Type (2019-2025)
Table 28. Global Smart Roads Anemometers Price (USD/Unit) by Type (2019-2025)
Table 29. Global Smart Roads Anemometers Sales (K Units) by Application
Table 30. Global Smart Roads Anemometers Market Size by Application
Table 31. Global Smart Roads Anemometers Sales by Application (2019-2025) & (K Units)
Table 32. Global Smart Roads Anemometers Sales Market Share by Application (2019-2025)
Table 33. Global Smart Roads Anemometers Sales by Application (2019-2025) & (M USD)
Table 34. Global Smart Roads Anemometers Market Share by Application (2019-2025)
Table 35. Global Smart Roads Anemometers Sales Growth Rate by Application (2019-2025)
Table 36. Global Smart Roads Anemometers Sales by Region (2019-2025) & (K Units)
Table 37. Global Smart Roads Anemometers Sales Market Share by Region (2019-2025)
Table 38. North America Smart Roads Anemometers Sales by Country (2019-2025) & (K Units)
Table 39. Europe Smart Roads Anemometers Sales by Country (2019-2025) & (K Units)
Table 40. Asia Pacific Smart Roads Anemometers Sales by Region (2019-2025) & (K Units)
Table 41. South America Smart Roads Anemometers Sales by Country (2019-2025) & (K Units)
Table 42. Middle East and Africa Smart Roads Anemometers Sales by Region (2019-2025) & (K Units)
Table 43. Schneider Electric Smart Roads Anemometers Basic Information
Table 44. Schneider Electric Smart Roads Anemometers Product Overview
Table 45. Schneider Electric Smart Roads Anemometers Sales (K Units), Revenue (M USD), Price (USD/Unit) and Gross Margin (2019-2025)
Table 46. Schneider Electric Business Overview
Table 47. Schneider Electric Smart Roads Anemometers SWOT Analysis
Table 48. Schneider Electric Recent Developments
Table 49. Siemens Smart Roads Anemometers Basic Information
Table 50. Siemens Smart Roads Anemometers Product Overview
Table 51. Siemens Smart Roads Anemometers Sales (K Units), Revenue (M USD), Price (USD/Unit) and Gross Margin (2019-2025)
Table 52. Siemens Business Overview
Table 53. Siemens Smart Roads Anemometers SWOT Analysis
Table 54. Siemens Recent Developments
Table 55. Intel Corporation Smart Roads Anemometers Basic Information
Table 56. Intel Corporation Smart Roads Anemometers Product Overview
Table 57. Intel Corporation Smart Roads Anemometers Sales (K Units), Revenue (M USD), Price (USD/Unit) and Gross Margin (2019-2025)
Table 58. Intel Corporation Smart Roads Anemometers SWOT Analysis
Table 59. Intel Corporation Business Overview
Table 60. Intel Corporation Recent Developments
Table 61. General Electric Smart Roads Anemometers Basic Information
Table 62. General Electric Smart Roads Anemometers Product Overview
Table 63. General Electric Smart Roads Anemometers Sales (K Units), Revenue (M USD), Price (USD/Unit) and Gross Margin (2019-2025)
Table 64. General Electric Business Overview
Table 65. General Electric Recent Developments
Table 66. Accenture Smart Roads Anemometers Basic Information
Table 67. Accenture Smart Roads Anemometers Product Overview
Table 68. Accenture Smart Roads Anemometers Sales (K Units), Revenue (M USD), Price (USD/Unit) and Gross Margin (2019-2025)
Table 69. Accenture Business Overview
Table 70. Accenture Recent Developments
Table 71. Thales Group Smart Roads Anemometers Basic Information
Table 72. Thales Group Smart Roads Anemometers Product Overview
Table 73. Thales Group Smart Roads Anemometers Sales (K Units), Revenue (M USD), Price (USD/Unit) and Gross Margin (2019-2025)
Table 74. Thales Group Business Overview
Table 75. Thales Group Recent Developments
Table 76. ABB Smart Roads Anemometers Basic Information
Table 77. ABB Smart Roads Anemometers Product Overview
Table 78. ABB Smart Roads Anemometers Sales (K Units), Revenue (M USD), Price (USD/Unit) and Gross Margin (2019-2025)
Table 79. ABB Business Overview
Table 80. ABB Recent Developments
Table 81. ATandT Intellectual Property Smart Roads Anemometers Basic Information
Table 82. ATandT Intellectual Property Smart Roads Anemometers Product Overview
Table 83. ATandT Intellectual Property Smart Roads Anemometers Sales (K Units), Revenue (M USD), Price (USD/Unit) and Gross Margin (2019-2025)
Table 84. ATandT Intellectual Property Business Overview
Table 85. ATandT Intellectual Property Recent Developments
Table 86. Honeywell International Inc Smart Roads Anemometers Basic Information
Table 87. Honeywell International Inc Smart Roads Anemometers Product Overview
Table 88. Honeywell International Inc Smart Roads Anemometers Sales (K Units), Revenue (M USD), Price (USD/Unit) and Gross Margin (2019-2025)
Table 89. Honeywell International Inc Business Overview
Table 90. Honeywell International Inc Recent Developments
Table 91. Infineon Technologies AG Smart Roads Anemometers Basic Information
Table 92. Infineon Technologies AG Smart Roads Anemometers Product Overview
Table 93. Infineon Technologies AG Smart Roads Anemometers Sales (K Units), Revenue (M USD), Price (USD/Unit) and Gross Margin (2019-2025)
Table 94. Infineon Technologies AG Business Overview
Table 95. Infineon Technologies AG Recent Developments
Table 96. DNV GL Smart Roads Anemometers Basic Information
Table 97. DNV GL Smart Roads Anemometers Product Overview
Table 98. DNV GL Smart Roads Anemometers Sales (K Units), Revenue (M USD), Price (USD/Unit) and Gross Margin (2019-2025)
Table 99. DNV GL Business Overview
Table 100. DNV GL Recent Developments
Table 101. ALE International Smart Roads Anemometers Basic Information
Table 102. ALE International Smart Roads Anemometers Product Overview
Table 103. ALE International Smart Roads Anemometers Sales (K Units), Revenue (M USD), Price (USD/Unit) and Gross Margin (2019-2025)
Table 104. ALE International Business Overview
Table 105. ALE International Recent Developments
Table 106. Kapsch TrafficCom AG Smart Roads Anemometers Basic Information
Table 107. Kapsch TrafficCom AG Smart Roads Anemometers Product Overview
Table 108. Kapsch TrafficCom AG Smart Roads Anemometers Sales (K Units), Revenue (M USD), Price (USD/Unit) and Gross Margin (2019-2025)
Table 109. Kapsch TrafficCom AG Business Overview
Table 110. Kapsch TrafficCom AG Recent Developments
Table 111. LG CNS Smart Roads Anemometers Basic Information
Table 112. LG CNS Smart Roads Anemometers Product Overview
Table 113. LG CNS Smart Roads Anemometers Sales (K Units), Revenue (M USD), Price (USD/Unit) and Gross Margin (2019-2025)
Table 114. LG CNS Business Overview
Table 115. LG CNS Recent Developments
Table 116. Cisco Smart Roads Anemometers Basic Information
Table 117. Cisco Smart Roads Anemometers Product Overview
Table 118. Cisco Smart Roads Anemometers Sales (K Units), Revenue (M USD), Price (USD/Unit) and Gross Margin (2019-2025)
Table 119. Cisco Business Overview
Table 120. Cisco Recent Developments
Table 121. Xerox Corporation Smart Roads Anemometers Basic Information
Table 122. Xerox Corporation Smart Roads Anemometers Product Overview
Table 123. Xerox Corporation Smart Roads Anemometers Sales (K Units), Revenue (M USD), Price (USD/Unit) and Gross Margin (2019-2025)
Table 124. Xerox Corporation Business Overview
Table 125. Xerox Corporation Recent Developments
Table 126. Huawei Technologies Co. Smart Roads Anemometers Basic Information
Table 127. Huawei Technologies Co. Smart Roads Anemometers Product Overview
Table 128. Huawei Technologies Co. Smart Roads Anemometers Sales (K Units), Revenue (M USD), Price (USD/Unit) and Gross Margin (2019-2025)
Table 129. Huawei Technologies Co. Business Overview
Table 130. Huawei Technologies Co. Recent Developments
Table 131. Global Smart Roads Anemometers Sales Forecast by Region (2025-2030) & (K Units)
Table 132. Global Smart Roads Anemometers Market Size Forecast by Region (2025-2030) & (M USD)
Table 133. North America Smart Roads Anemometers Sales Forecast by Country (2025-2030) & (K Units)
Table 134. North America Smart Roads Anemometers Market Size Forecast by Country (2025-2030) & (M USD)
Table 135. Europe Smart Roads Anemometers Sales Forecast by Country (2025-2030) & (K Units)
Table 136. Europe Smart Roads Anemometers Market Size Forecast by Country (2025-2030) & (M USD)
Table 137. Asia Pacific Smart Roads Anemometers Sales Forecast by Region (2025-2030) & (K Units)
Table 138. Asia Pacific Smart Roads Anemometers Market Size Forecast by Region (2025-2030) & (M USD)
Table 139. South America Smart Roads Anemometers Sales Forecast by Country (2025-2030) & (K Units)
Table 140. South America Smart Roads Anemometers Market Size Forecast by Country (2025-2030) & (M USD)
Table 141. Middle East and Africa Smart Roads Anemometers Consumption Forecast by Country (2025-2030) & (Units)
Table 142. Middle East and Africa Smart Roads Anemometers Market Size Forecast by Country (2025-2030) & (M USD)
Table 143. Global Smart Roads Anemometers Sales Forecast by Type (2025-2030) & (K Units)
Table 144. Global Smart Roads Anemometers Market Size Forecast by Type (2025-2030) & (M USD)
Table 145. Global Smart Roads Anemometers Price Forecast by Type (2025-2030) & (USD/Unit)
Table 146. Global Smart Roads Anemometers Sales (K Units) Forecast by Application (2025-2030)
Table 147. Global Smart Roads Anemometers Market Size Forecast by Application (2025-2030) & (M USD)
List of Figures
Figure 1. Product Picture of Smart Roads Anemometers
Figure 2. Data Triangulation
Figure 3. Key Caveats
Figure 4. Global Smart Roads Anemometers Market Size (M USD), 2019-2030
Figure 5. Global Smart Roads Anemometers Market Size (M USD) (2019-2030)
Figure 6. Global Smart Roads Anemometers Sales (K Units) & (2019-2030)
Figure 7. Evaluation Matrix of Segment Market Development Potential (Type)
Figure 8. Evaluation Matrix of Segment Market Development Potential (Application)
Figure 9. Evaluation Matrix of Regional Market Development Potential
Figure 10. Smart Roads Anemometers Market Size by Country (M USD)
Figure 11. Smart Roads Anemometers Sales Share by Manufacturers in 2023
Figure 12. Global Smart Roads Anemometers Revenue Share by Manufacturers in 2023
Figure 13. Smart Roads Anemometers Market Share by Company Type (Tier 1, Tier 2 and Tier 3): 2023
Figure 14. Global Market Smart Roads Anemometers Average Price (USD/Unit) of Key Manufacturers in 2023
Figure 15. The Global 5 and 10 Largest Players: Market Share by Smart Roads Anemometers Revenue in 2023
Figure 16. Evaluation Matrix of Segment Market Development Potential (Type)
Figure 17. Global Smart Roads Anemometers Market Share by Type
Figure 18. Sales Market Share of Smart Roads Anemometers by Type (2019-2025)
Figure 19. Sales Market Share of Smart Roads Anemometers by Type in 2023
Figure 20. Market Size Share of Smart Roads Anemometers by Type (2019-2025)
Figure 21. Market Size Market Share of Smart Roads Anemometers by Type in 2023
Figure 22. Evaluation Matrix of Segment Market Development Potential (Application)
Figure 23. Global Smart Roads Anemometers Market Share by Application
Figure 24. Global Smart Roads Anemometers Sales Market Share by Application (2019-2025)
Figure 25. Global Smart Roads Anemometers Sales Market Share by Application in 2023
Figure 26. Global Smart Roads Anemometers Market Share by Application (2019-2025)
Figure 27. Global Smart Roads Anemometers Market Share by Application in 2023
Figure 28. Global Smart Roads Anemometers Sales Growth Rate by Application (2019-2025)
Figure 29. Global Smart Roads Anemometers Sales Market Share by Region (2019-2025)
Figure 30. North America Smart Roads Anemometers Sales and Growth Rate (2019-2025) & (K Units)
Figure 31. North America Smart Roads Anemometers Sales Market Share by Country in 2023
Figure 32. U.S. Smart Roads Anemometers Sales and Growth Rate (2019-2025) & (K Units)
Figure 33. Canada Smart Roads Anemometers Sales (K Units) and Growth Rate (2019-2025)
Figure 34. Mexico Smart Roads Anemometers Sales (Units) and Growth Rate (2019-2025)
Figure 35. Europe Smart Roads Anemometers Sales and Growth Rate (2019-2025) & (K Units)
Figure 36. Europe Smart Roads Anemometers Sales Market Share by Country in 2023
Figure 37. Germany Smart Roads Anemometers Sales and Growth Rate (2019-2025) & (K Units)
Figure 38. France Smart Roads Anemometers Sales and Growth Rate (2019-2025) & (K Units)
Figure 39. U.K. Smart Roads Anemometers Sales and Growth Rate (2019-2025) & (K Units)
Figure 40. Italy Smart Roads Anemometers Sales and Growth Rate (2019-2025) & (K Units)
Figure 41. Russia Smart Roads Anemometers Sales and Growth Rate (2019-2025) & (K Units)
Figure 42. Asia Pacific Smart Roads Anemometers Sales and Growth Rate (K Units)
Figure 43. Asia Pacific Smart Roads Anemometers Sales Market Share by Region in 2023
Figure 44. China Smart Roads Anemometers Sales and Growth Rate (2019-2025) & (K Units)
Figure 45. Japan Smart Roads Anemometers Sales and Growth Rate (2019-2025) & (K Units)
Figure 46. South Korea Smart Roads Anemometers Sales and Growth Rate (2019-2025) & (K Units)
Figure 47. India Smart Roads Anemometers Sales and Growth Rate (2019-2025) & (K Units)
Figure 48. Southeast Asia Smart Roads Anemometers Sales and Growth Rate (2019-2025) & (K Units)
Figure 49. South America Smart Roads Anemometers Sales and Growth Rate (K Units)
Figure 50. South America Smart Roads Anemometers Sales Market Share by Country in 2023
Figure 51. Brazil Smart Roads Anemometers Sales and Growth Rate (2019-2025) & (K Units)
Figure 52. Argentina Smart Roads Anemometers Sales and Growth Rate (2019-2025) & (K Units)
Figure 53. Columbia Smart Roads Anemometers Sales and Growth Rate (2019-2025) & (K Units)
Figure 54. Middle East and Africa Smart Roads Anemometers Sales and Growth Rate (K Units)
Figure 55. Middle East and Africa Smart Roads Anemometers Sales Market Share by Region in 2023
Figure 56. Saudi Arabia Smart Roads Anemometers Sales and Growth Rate (2019-2025) & (K Units)
Figure 57. UAE Smart Roads Anemometers Sales and Growth Rate (2019-2025) & (K Units)
Figure 58. Egypt Smart Roads Anemometers Sales and Growth Rate (2019-2025) & (K Units)
Figure 59. Nigeria Smart Roads Anemometers Sales and Growth Rate (2019-2025) & (K Units)
Figure 60. South Africa Smart Roads Anemometers Sales and Growth Rate (2019-2025) & (K Units)
Figure 61. Global Smart Roads Anemometers Sales Forecast by Volume (2019-2030) & (K Units)
Figure 62. Global Smart Roads Anemometers Market Size Forecast by Value (2019-2030) & (M USD)
Figure 63. Global Smart Roads Anemometers Sales Market Share Forecast by Type (2025-2030)
Figure 64. Global Smart Roads Anemometers Market Share Forecast by Type (2025-2030)
Figure 65. Global Smart Roads Anemometers Sales Forecast by Application (2025-2030)
Figure 66. Global Smart Roads Anemometers Market Share Forecast by Application (2025-2030)