Smart Mobile POS Market, Global Business Strategies 2026-2033

Smart Mobile POS Market was valued at USD 3.5 billion in 2025 and is projected to reach USD 8.9 billion by 2033, exhibiting a CAGR of 12.3% during the forecast period.

PDF Icon Download Sample Report PDF
  • Quick Dispatch

    All Orders

  • Secure Payment

    100% Secure Payment

Price range: $1,500.00 through $4,250.00

Clear

Market Insights

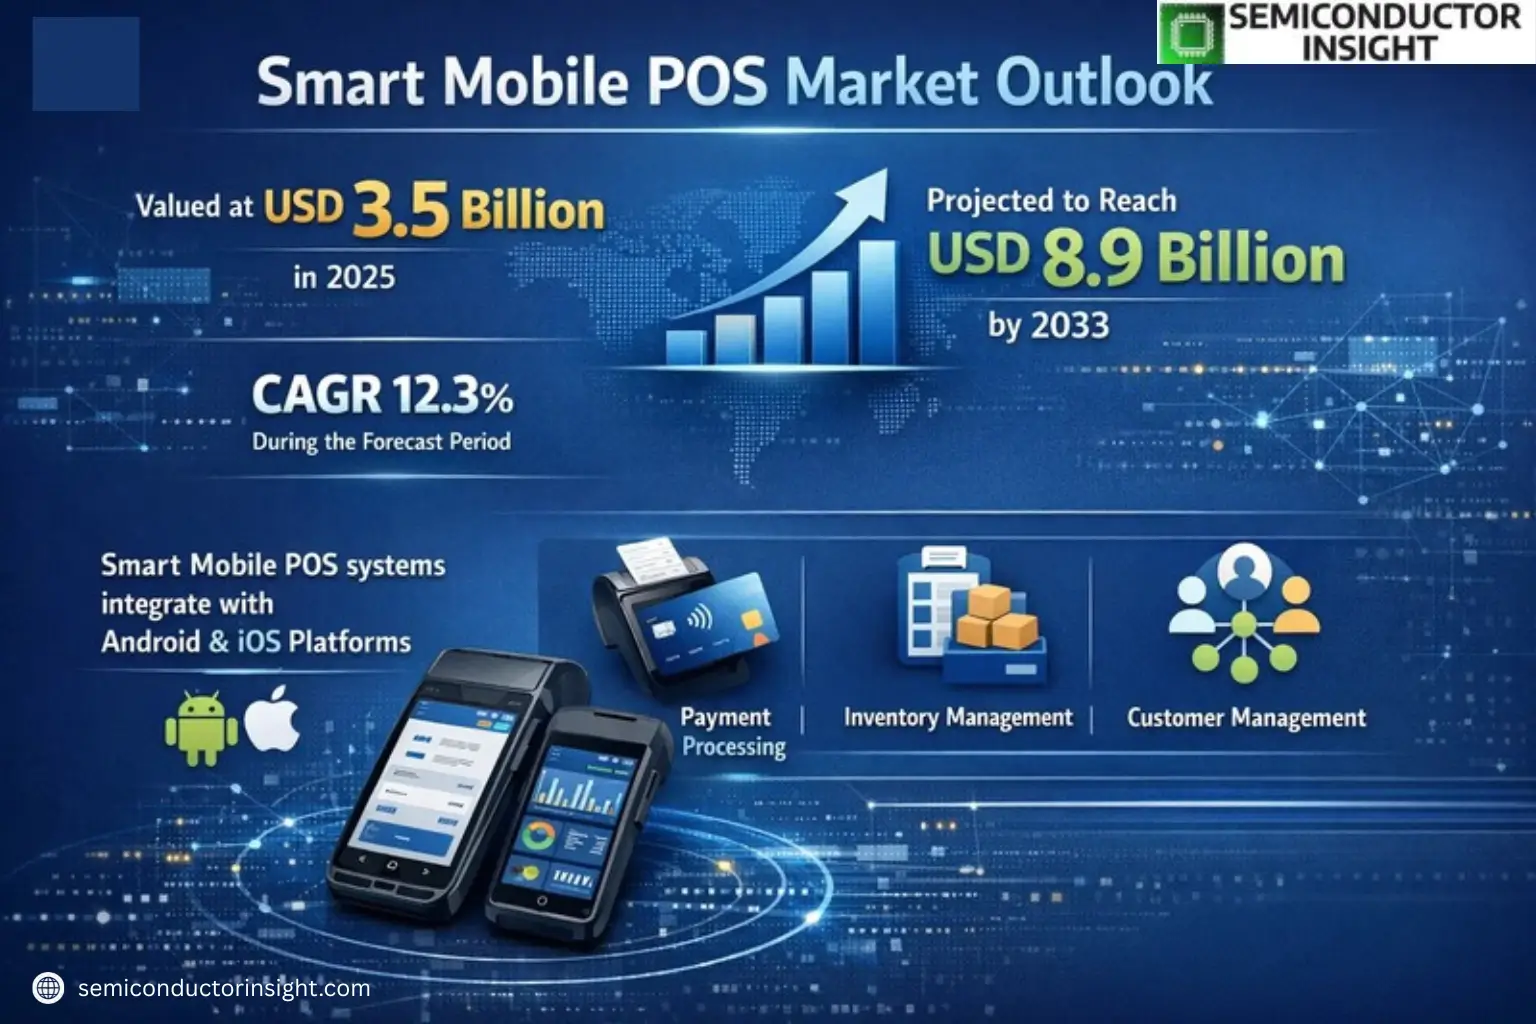
Global Smart Mobile POS Market was valued at USD 3.5 billion in 2025 and is projected to reach USD 8.9 billion by 2033, exhibiting a CAGR of 12.3% during the forecast period.

Smart Mobile POS systems are advanced point-of-sale devices integrated with Android or iOS operating systems, enabling seamless payment processing, inventory management, and customer relationship management. Unlike traditional terminals, these devices offer mobility, cloud-based analytics, and multi-channel integration, making them ideal for retail, hospitality, and small businesses.

The market growth is driven by increasing cashless transactions, rising adoption of contactless payments, and demand for real-time data analytics. Furthermore, the shift toward omnichannel retailing and the need for compact, cost-effective solutions are accelerating adoption. Key players such as Verifone, PAX Technology, and Newland Payment dominate the market with innovative product launches and strategic partnerships to enhance their global footprint.

Xyz market size & forecast

MARKET DRIVERS

Rising Demand for Contactless Payments

Global Smart Mobile POS Market is experiencing significant growth driven by the accelerated adoption of contactless payment solutions. With over 65% of consumers now preferring tap-to-pay options, businesses are rapidly transitioning from traditional POS systems to mobile alternatives. The convenience and hygiene benefits of Smart Mobile POS solutions align perfectly with evolving consumer expectations.

SME Digital Transformation

Small and medium enterprises are adopting Smart Mobile POS systems at unprecedented rates, with annual growth exceeding 28% in developing markets. The low upfront cost and scalability of mobile POS solutions make them ideal for SMBs undergoing digital transformation.

Advanced analytics capabilities embedded in modern Smart Mobile POS platforms are driving adoption among enterprise retailers seeking real-time business insights.

MARKET CHALLENGES

Security and Compliance Concerns

Smart Mobile POS Market faces ongoing challenges with payment security standards and data protection regulations. Approximately 23% of merchants cite security concerns as their primary hesitation when adopting mobile POS solutions.

Other Challenges

Device Fragmentation
The wide variety of mobile devices and operating systems creates compatibility issues, with 37% of Smart Mobile POS implementations requiring custom development.

MARKET RESTRAINTS

Legacy System Dependencies

Many retailers remain hesitant to migrate from established POS infrastructure to Smart Mobile POS solutions due to high switching costs and integration challenges with existing ERP systems. This restraint is particularly evident in large retail chains with complex operations.

MARKET OPPORTUNITIES

Emerging Market Expansion

Smart Mobile POS Market has significant growth potential in developing regions where traditional banking infrastructure is limited. Mobile POS adoption in these markets is growing at 34% annually, outpacing mature markets by nearly 2:1.
Smart Mobile POS Market Trends

Rapid Growth Driven by Retail and Restaurant Adoption

Global Smart Mobile POS Market is projected to grow at a significant CAGR, reaching multimillion-dollar valuation by 2033. The retail and food service sectors account for over 65% of total adoption, with grocery stores and fast-food chains leading implementations. Android-based POS systems now dominate 72% of new installations due to their flexibility and integration capabilities.

Other Trends

Pricing Segmentation Shaping Market Accessibility

The market shows clear segmentation with 38% of devices priced below USD 110 targeting SMBs, while premium USD 150+ models with advanced analytics capture 22% share. Mid-range USD 110-USD 150 units remain popular for their balance of features and affordability.

Regional Market Developments

Asia-Pacific leads in Smart Mobile POS deployments with 45% market share, driven by China’s digital payment ecosystem. North America follows with 28% adoption, particularly in retail chains upgrading legacy systems. Manufacturers are increasingly developing region-specific solutions to address local payment processing requirements.

Technological Advancements in Security and Integration

Recent Smart Mobile POS innovations focus on biometric authentication and cloud-based inventory synchronization. Over 60% of new models now feature encrypted contactless payment support, responding to the 300% growth in NFC transactions since 2020. Leading vendors are integrating AI-powered sales analytics directly into POS interfaces to provide real-time business insights.

Competitive Landscape Evolution

The top 5 Smart Mobile POS manufacturers control 58% of the global market, with Chinese firms like Landi and PAX Technology expanding internationally. Strategic partnerships between payment processors and POS developers are accelerating the adoption of unified commerce solutions across verticals.

COMPETITIVE LANDSCAPE

Key Industry Players

Asian manufacturers dominate the global Smart Mobile POS ecosystem with innovative Android-based solutions

Smart Mobile POS Market is led by Chinese manufacturers who collectively hold over 60% global market share, with Landi and PAX Technology emerging as category leaders through their extensive distribution networks and diversified product portfolios. The market exhibits moderate consolidation with the top 5 players accounting for 45-50% of total revenues, while regional players maintain strong footholds in local markets through customized payment solutions.

Niche innovators like WizarPOS and Wiseasy Technology are gaining traction through cloud-connected devices with advanced analytics capabilities, particularly in the restaurant and retail segments. Meanwhile, global payment giants Verifone and Ingenico are transitioning from traditional POS systems to Android-powered mobile solutions to maintain competitiveness in North American and European markets.

List of Key Smart Mobile POS Companies Profiled

Segment Analysis:

Segment Category Sub-Segments Key Insights
By Type
  • Handheld POS Devices
  • Tablet-based POS Devices
  • Countertop POS Devices
Tablet-based POS Devices

  • Offer superior user experience with touchscreen interfaces and mobile flexibility
  • Enable seamless integration with other business systems through Android OS
  • Support modular add-ons for printers, cash drawers, and card readers
By Application
  • Retail Stores
  • Restaurants
  • Hospitality
  • Healthcare
Retail Stores

  • Require robust inventory management capabilities
  • Benefit from quick payment processing in high-traffic environments
  • Demand seamless omnichannel integration
By End User
  • Enterprise Businesses
  • SMBs
  • Individual Merchants
SMBs

  • Prefer cost-effective solutions with subscription-based models
  • Require easy-to-use interfaces with quick setup
  • Value mobile solutions that reduce physical infrastructure needs
By Operating System
  • Android-based
  • iOS-based
  • Hybrid Systems
Android-based

  • Dominate the market due to open ecosystem and customization options
  • Offer better hardware compatibility with peripheral devices
  • Enable easier integration with third-party business applications
By Connectivity
  • WiFi-enabled
  • Cellular-enabled
  • Bluetooth-enabled
WiFi-enabled

  • Most common choice due to stable connectivity and lower operational costs
  • Enable seamless integration with existing business networks
  • Support real-time data synchronization across multiple locations

Regional Analysis: Global Smart Mobile POS Market

North America

North America dominates the Smart Mobile POS Market with cutting-edge payment infrastructure and rapid retail digitalization. The region’s strong fintech ecosystem drives adoption of wireless payment solutions across restaurants, retail stores, and hospitality sectors. Leading technology providers continuously innovate with cloud-based POS systems featuring advanced analytics and inventory management. Strict data security regulations push vendors toward PCI-compliant solutions with biometric authentication. The integration of AI-powered recommendation engines with mobile POS systems is transforming customer experiences. Local players emphasize contactless payment compatibility and omnichannel retail integration as key competitive advantages. The market sees increasing demand from small businesses adopting affordable SaaS-based mobile POS solutions.

Technology Leadership
U.S. and Canada lead in NFC and contactless payment technologies, driving Smart Mobile POS adoption. Major players invest heavily in developing proprietary payment processing platforms with enhanced security features.
Retail Transformation
The shift toward omnichannel retail strategies fuels demand for mobile POS solutions that integrate e-commerce platforms with physical store operations, creating seamless customer purchasing journeys.
SMB Adoption
Cost-effective Android-based mobile POS systems gain traction among small businesses seeking affordable digital payment solutions with basic inventory and customer management features.
Security Focus
Stringent PCI DSS compliance requirements drive innovation in end-to-end encryption and tokenization technologies for mobile payment processing across the region.

Europe
Europe’s Smart Mobile POS Market grows with strong EMV chip card adoption and open banking initiatives. The region sees rapid deployment of mPOS solutions in food service and pop-up retail sectors. GDPR compliance requirements push vendors to develop privacy-focused mobile payment architectures. Cross-border payment standardization within EU countries facilitates Smart POS system interoperability. Mature markets like Germany and UK show preference for integrated solutions combining payments with loyalty programs and digital receipts.

Asia-Pacific
APAC emerges as the fastest-growing Smart Mobile POS Market, fueled by mobile wallet penetration and government digital payment initiatives. China and India drive adoption through QR-code based payment ecosystems. The region sees unique demand for low-cost Android POS devices with multilingual support. Local vendors develop customized solutions for traditional retail markets and street vendors. Growing tourism sectors in Southeast Asia accelerate hospitality POS system deployments.

Latin America
Latin America’s Smart Mobile POS expansion is propelled by financial inclusion programs and growing e-commerce penetration. Brazil and Mexico lead in adoption of low-cost mobile payment terminals by small merchants. The market sees increasing integration of mobile POS with local alternative payment methods. Security concerns drive demand for solutions with advanced fraud detection capabilities tailored for the regional context.

Middle East & Africa
MEA’s Smart Mobile POS Market grows through government-led cashless economy initiatives and expanding retail sectors. UAE and Saudi Arabia lead in contactless payment adoption among luxury retailers. African markets see mobile POS solutions adapted for feature phone compatibility. The region presents opportunities for mobile money-integrated POS systems catering to unbanked populations.

Report Scope

This market research report provides a comprehensive analysis of the Smart Mobile POS Market , covering the forecast period 2025–2033. It offers detailed insights into market dynamics, technological advancements, competitive landscape, and key trends shaping the industry.

Key focus areas of the report include:

  • Market Overview: The report begins with an overview outlining its current market scenario, key growth indicators, and industry transformation drivers. It discusses macroeconomic factors, demand–supply balance, regulatory landscape, and the strategic role of mobile POS in powering advancements across industries such as retail, hospitality, and food service.
  • Market Size & Forecast: Historical data and future projections for revenue, unit shipments, and market value across major regions and segments.
  • Segmentation Analysis: Detailed breakdown by price level, application, and end-user industry to identify high-growth segments and investment opportunities.
  • Regional Insights: Insights into market performance across North America, Europe, Asia-Pacific, Latin America, and the Middle East & Africa, including country-level analysis where relevant.
  • Competitive Landscape: Profiles of leading market participants, including their product offerings, R&D focus, manufacturing capacity, pricing strategies, and recent developments such as mergers, acquisitions, and partnerships.
  • Technology Trends & Innovation: Assessment of emerging technologies, integration of Android POS systems, and evolving industry standards.
  • Market Drivers & Restraints: Evaluation of factors driving market growth along with challenges, supply chain constraints, regulatory issues, and market-entry barriers.
  • Stakeholder Insights: Insights for manufacturers, suppliers, distributors, investors, and policymakers regarding the evolving ecosystem and strategic opportunities.

Primary and secondary research methods are employed, including interviews with industry experts, data from verified sources, and real-time market intelligence to ensure the accuracy and reliability of the insights presented.

FREQUENTLY ASKED QUESTIONS:

What is the current market size of Smart Mobile POS Market?

-> Smart Mobile POS Market was valued at USD 3.5 billion in 2025 and is projected to reach USD 8.9 billion by 2033, exhibiting a CAGR of 12.3% during the forecast period.

Which key companies operate in Smart Mobile POS Market?

-> Key players include Landi, SZZT Electronics, WizarPOS, Newland Payment, Fujian Centerm, Verifone, PAX Technology, Xinguodu, Smartpeak, NEWPOS, Wiseasy Technology, and Justtide, among others.

What are the key applications of Smart Mobile POS?

-> Key applications include Grocery/Supermarkets, Fast Food Restaurants, Restaurants, Retail Fashion and Department Stores, and Others.

Which region is leading in Smart Mobile POS adoption?

-> Asia shows significant market share, with major contributions from China, while North America and Europe continue to be key markets.

What are the main price segments for Smart Mobile POS?

-> Main price segments include Below 110 USD, 110-150 USD, and Above 150 USD.

Smart Mobile POS Market, Global Business Strategies 2026-2033

Get Sample Report PDF for Exclusive Insights

Report Sample Includes

  • Table of Contents
  • List of Tables & Figures
  • Charts, Research Methodology, and more...
PDF Icon Download Sample Report PDF
SKU: 06f6bafe836e
Category:
Tag:
License Type

Corporate License, Excel License, PDF and Excel Databook License

Download Sample Report

Table of Content

1 Introduction to Research & Analysis Reports
1.1 Smart Mobile POS Market Definition
1.2 Market Segments
1.2.1 Segment by Price Level
1.2.2 Segment by Application
1.3 Global Smart Mobile POS Market Overview
1.4 Features & Benefits of This Report
1.5 Methodology & Sources of Information
1.5.1 Research Methodology
1.5.2 Research Process
1.5.3 Base Year
1.5.4 Report Assumptions & Caveats
2 Global Smart Mobile POS Overall Market Size
2.1 Global Smart Mobile POS Market Size: 2024 VS 2032
2.2 Global Smart Mobile POS Market Size, Prospects & Forecasts: 2020-2032
2.3 Global Smart Mobile POS Sales: 2020-2032
3 Company Landscape
3.1 Top Smart Mobile POS Players in Global Market
3.2 Top Global Smart Mobile POS Companies Ranked by Revenue
3.3 Global Smart Mobile POS Revenue by Companies
3.4 Global Smart Mobile POS Sales by Companies
3.5 Global Smart Mobile POS Price by Manufacturer (2020-2025)
3.6 Top 3 and Top 5 Smart Mobile POS Companies in Global Market, by Revenue in 2024
3.7 Global Manufacturers Smart Mobile POS Product Type
3.8 Tier 1, Tier 2, and Tier 3 Smart Mobile POS Players in Global Market
3.8.1 List of Global Tier 1 Smart Mobile POS Companies
3.8.2 List of Global Tier 2 and Tier 3 Smart Mobile POS Companies
4 Sights by Product
4.1 Overview
4.1.1 Segment by Price Level – Global Smart Mobile POS Market Size Markets, 2024 & 2032
4.1.2 Below 110 USD
4.1.3 110-150 USD
4.1.4 Above 150 USD
4.2 Segment by Price Level – Global Smart Mobile POS Revenue & Forecasts
4.2.1 Segment by Price Level – Global Smart Mobile POS Revenue, 2020-2025
4.2.2 Segment by Price Level – Global Smart Mobile POS Revenue, 2026-2032
4.2.3 Segment by Price Level – Global Smart Mobile POS Revenue Market Share, 2020-2032
4.3 Segment by Price Level – Global Smart Mobile POS Sales & Forecasts
4.3.1 Segment by Price Level – Global Smart Mobile POS Sales, 2020-2025
4.3.2 Segment by Price Level – Global Smart Mobile POS Sales, 2026-2032
4.3.3 Segment by Price Level – Global Smart Mobile POS Sales Market Share, 2020-2032
4.4 Segment by Price Level – Global Smart Mobile POS Price (Manufacturers Selling Prices), 2020-2032
5 Sights by Application
5.1 Overview
5.1.1 Segment by Application – Global Smart Mobile POS Market Size, 2024 & 2032
5.1.2 Grocery/Supermarkets
5.1.3 Fast Food Restaurants
5.1.4 Restaurants
5.1.5 Retail Fashion and Department Stores
5.1.6 Others
5.2 Segment by Application – Global Smart Mobile POS Revenue & Forecasts
5.2.1 Segment by Application – Global Smart Mobile POS Revenue, 2020-2025
5.2.2 Segment by Application – Global Smart Mobile POS Revenue, 2026-2032
5.2.3 Segment by Application – Global Smart Mobile POS Revenue Market Share, 2020-2032
5.3 Segment by Application – Global Smart Mobile POS Sales & Forecasts
5.3.1 Segment by Application – Global Smart Mobile POS Sales, 2020-2025
5.3.2 Segment by Application – Global Smart Mobile POS Sales, 2026-2032
5.3.3 Segment by Application – Global Smart Mobile POS Sales Market Share, 2020-2032
5.4 Segment by Application – Global Smart Mobile POS Price (Manufacturers Selling Prices), 2020-2032
6 Sights by Region
6.1 By Region – Global Smart Mobile POS Market Size, 2024 & 2032
6.2 By Region – Global Smart Mobile POS Revenue & Forecasts
6.2.1 By Region – Global Smart Mobile POS Revenue, 2020-2025
6.2.2 By Region – Global Smart Mobile POS Revenue, 2026-2032
6.2.3 By Region – Global Smart Mobile POS Revenue Market Share, 2020-2032
6.3 By Region – Global Smart Mobile POS Sales & Forecasts
6.3.1 By Region – Global Smart Mobile POS Sales, 2020-2025
6.3.2 By Region – Global Smart Mobile POS Sales, 2026-2032
6.3.3 By Region – Global Smart Mobile POS Sales Market Share, 2020-2032
6.4 North America
6.4.1 By Country – North America Smart Mobile POS Revenue, 2020-2032
6.4.2 By Country – North America Smart Mobile POS Sales, 2020-2032
6.4.3 United States Smart Mobile POS Market Size, 2020-2032
6.4.4 Canada Smart Mobile POS Market Size, 2020-2032
6.4.5 Mexico Smart Mobile POS Market Size, 2020-2032
6.5 Europe
6.5.1 By Country – Europe Smart Mobile POS Revenue, 2020-2032
6.5.2 By Country – Europe Smart Mobile POS Sales, 2020-2032
6.5.3 Germany Smart Mobile POS Market Size, 2020-2032
6.5.4 France Smart Mobile POS Market Size, 2020-2032
6.5.5 U.K. Smart Mobile POS Market Size, 2020-2032
6.5.6 Italy Smart Mobile POS Market Size, 2020-2032
6.5.7 Russia Smart Mobile POS Market Size, 2020-2032
6.5.8 Nordic Countries Smart Mobile POS Market Size, 2020-2032
6.5.9 Benelux Smart Mobile POS Market Size, 2020-2032
6.6 Asia
6.6.1 By Region – Asia Smart Mobile POS Revenue, 2020-2032
6.6.2 By Region – Asia Smart Mobile POS Sales, 2020-2032
6.6.3 China Smart Mobile POS Market Size, 2020-2032
6.6.4 Japan Smart Mobile POS Market Size, 2020-2032
6.6.5 South Korea Smart Mobile POS Market Size, 2020-2032
6.6.6 Southeast Asia Smart Mobile POS Market Size, 2020-2032
6.6.7 India Smart Mobile POS Market Size, 2020-2032
6.7 South America
6.7.1 By Country – South America Smart Mobile POS Revenue, 2020-2032
6.7.2 By Country – South America Smart Mobile POS Sales, 2020-2032
6.7.3 Brazil Smart Mobile POS Market Size, 2020-2032
6.7.4 Argentina Smart Mobile POS Market Size, 2020-2032
6.8 Middle East & Africa
6.8.1 By Country – Middle East & Africa Smart Mobile POS Revenue, 2020-2032
6.8.2 By Country – Middle East & Africa Smart Mobile POS Sales, 2020-2032
6.8.3 Turkey Smart Mobile POS Market Size, 2020-2032
6.8.4 Israel Smart Mobile POS Market Size, 2020-2032
6.8.5 Saudi Arabia Smart Mobile POS Market Size, 2020-2032
6.8.6 UAE Smart Mobile POS Market Size, 2020-2032
7 Manufacturers & Brands Profiles
7.1 Landi
7.1.1 Landi Company Summary
7.1.2 Landi Business Overview
7.1.3 Landi Smart Mobile POS Major Product Offerings
7.1.4 Landi Smart Mobile POS Sales and Revenue in Global (2020-2025)
7.1.5 Landi Key News & Latest Developments
7.2 SZZT Electronics
7.2.1 SZZT Electronics Company Summary
7.2.2 SZZT Electronics Business Overview
7.2.3 SZZT Electronics Smart Mobile POS Major Product Offerings
7.2.4 SZZT Electronics Smart Mobile POS Sales and Revenue in Global (2020-2025)
7.2.5 SZZT Electronics Key News & Latest Developments
7.3 WizarPOS
7.3.1 WizarPOS Company Summary
7.3.2 WizarPOS Business Overview
7.3.3 WizarPOS Smart Mobile POS Major Product Offerings
7.3.4 WizarPOS Smart Mobile POS Sales and Revenue in Global (2020-2025)
7.3.5 WizarPOS Key News & Latest Developments
7.4 Newland Payment
7.4.1 Newland Payment Company Summary
7.4.2 Newland Payment Business Overview
7.4.3 Newland Payment Smart Mobile POS Major Product Offerings
7.4.4 Newland Payment Smart Mobile POS Sales and Revenue in Global (2020-2025)
7.4.5 Newland Payment Key News & Latest Developments
7.5 Fujian Centerm
7.5.1 Fujian Centerm Company Summary
7.5.2 Fujian Centerm Business Overview
7.5.3 Fujian Centerm Smart Mobile POS Major Product Offerings
7.5.4 Fujian Centerm Smart Mobile POS Sales and Revenue in Global (2020-2025)
7.5.5 Fujian Centerm Key News & Latest Developments
7.6 Verifone
7.6.1 Verifone Company Summary
7.6.2 Verifone Business Overview
7.6.3 Verifone Smart Mobile POS Major Product Offerings
7.6.4 Verifone Smart Mobile POS Sales and Revenue in Global (2020-2025)
7.6.5 Verifone Key News & Latest Developments
7.7 PAX Technology
7.7.1 PAX Technology Company Summary
7.7.2 PAX Technology Business Overview
7.7.3 PAX Technology Smart Mobile POS Major Product Offerings
7.7.4 PAX Technology Smart Mobile POS Sales and Revenue in Global (2020-2025)
7.7.5 PAX Technology Key News & Latest Developments
7.8 Xinguodu
7.8.1 Xinguodu Company Summary
7.8.2 Xinguodu Business Overview
7.8.3 Xinguodu Smart Mobile POS Major Product Offerings
7.8.4 Xinguodu Smart Mobile POS Sales and Revenue in Global (2020-2025)
7.8.5 Xinguodu Key News & Latest Developments
7.9 Smartpeak
7.9.1 Smartpeak Company Summary
7.9.2 Smartpeak Business Overview
7.9.3 Smartpeak Smart Mobile POS Major Product Offerings
7.9.4 Smartpeak Smart Mobile POS Sales and Revenue in Global (2020-2025)
7.9.5 Smartpeak Key News & Latest Developments
7.10 NEWPOS
7.10.1 NEWPOS Company Summary
7.10.2 NEWPOS Business Overview
7.10.3 NEWPOS Smart Mobile POS Major Product Offerings
7.10.4 NEWPOS Smart Mobile POS Sales and Revenue in Global (2020-2025)
7.10.5 NEWPOS Key News & Latest Developments
7.11 Wiseasy Technology
7.11.1 Wiseasy Technology Company Summary
7.11.2 Wiseasy Technology Business Overview
7.11.3 Wiseasy Technology Smart Mobile POS Major Product Offerings
7.11.4 Wiseasy Technology Smart Mobile POS Sales and Revenue in Global (2020-2025)
7.11.5 Wiseasy Technology Key News & Latest Developments
7.12 Justtide
7.12.1 Justtide Company Summary
7.12.2 Justtide Business Overview
7.12.3 Justtide Smart Mobile POS Major Product Offerings
7.12.4 Justtide Smart Mobile POS Sales and Revenue in Global (2020-2025)
7.12.5 Justtide Key News & Latest Developments
8 Global Smart Mobile POS Production Capacity, Analysis
8.1 Global Smart Mobile POS Production Capacity, 2020-2032
8.2 Smart Mobile POS Production Capacity of Key Manufacturers in Global Market
8.3 Global Smart Mobile POS Production by Region
9 Key Market Trends, Opportunity, Drivers and Restraints
9.1 Market Opportunities & Trends
9.2 Market Drivers
9.3 Market Restraints
10 Smart Mobile POS Supply Chain Analysis
10.1 Smart Mobile POS Industry Value Chain
10.2 Smart Mobile POS Upstream Market
10.3 Smart Mobile POS Downstream and Clients
10.4 Marketing Channels Analysis
10.4.1 Marketing Channels
10.4.2 Smart Mobile POS Distributors and Sales Agents in Global
11 Conclusion
12 Appendix
12.1 Note
12.2 Examples of Clients
12.3 DisclaimerList of Tables
Table 1. Key Players of Smart Mobile POS in Global Market
Table 2. Top Smart Mobile POS Players in Global Market, Ranking by Revenue (2024)
Table 3. Global Smart Mobile POS Revenue by Companies, (US$, Mn), 2020-2025
Table 4. Global Smart Mobile POS Revenue Share by Companies, 2020-2025
Table 5. Global Smart Mobile POS Sales by Companies, (K Units), 2020-2025
Table 6. Global Smart Mobile POS Sales Share by Companies, 2020-2025
Table 7. Key Manufacturers Smart Mobile POS Price (2020-2025) & (USD/Unit)
Table 8. Global Manufacturers Smart Mobile POS Product Type
Table 9. List of Global Tier 1 Smart Mobile POS Companies, Revenue (US$, Mn) in 2024 and Market Share
Table 10. List of Global Tier 2 and Tier 3 Smart Mobile POS Companies, Revenue (US$, Mn) in 2024 and Market Share
Table 11. Segment by Price Level – Global Smart Mobile POS Revenue, (US$, Mn), 2024 & 2032
Table 12. Segment by Price Level – Global Smart Mobile POS Revenue (US$, Mn), 2020-2025
Table 13. Segment by Price Level – Global Smart Mobile POS Revenue (US$, Mn), 2026-2032
Table 14. Segment by Price Level – Global Smart Mobile POS Sales (K Units), 2020-2025
Table 15. Segment by Price Level – Global Smart Mobile POS Sales (K Units), 2026-2032
Table 16. Segment by Application – Global Smart Mobile POS Revenue, (US$, Mn), 2024 & 2032
Table 17. Segment by Application – Global Smart Mobile POS Revenue, (US$, Mn), 2020-2025
Table 18. Segment by Application – Global Smart Mobile POS Revenue, (US$, Mn), 2026-2032
Table 19. Segment by Application – Global Smart Mobile POS Sales, (K Units), 2020-2025
Table 20. Segment by Application – Global Smart Mobile POS Sales, (K Units), 2026-2032
Table 21. By Region – Global Smart Mobile POS Revenue, (US$, Mn), 2025-2032
Table 22. By Region – Global Smart Mobile POS Revenue, (US$, Mn), 2020-2025
Table 23. By Region – Global Smart Mobile POS Revenue, (US$, Mn), 2026-2032
Table 24. By Region – Global Smart Mobile POS Sales, (K Units), 2020-2025
Table 25. By Region – Global Smart Mobile POS Sales, (K Units), 2026-2032
Table 26. By Country – North America Smart Mobile POS Revenue, (US$, Mn), 2020-2025
Table 27. By Country – North America Smart Mobile POS Revenue, (US$, Mn), 2026-2032
Table 28. By Country – North America Smart Mobile POS Sales, (K Units), 2020-2025
Table 29. By Country – North America Smart Mobile POS Sales, (K Units), 2026-2032
Table 30. By Country – Europe Smart Mobile POS Revenue, (US$, Mn), 2020-2025
Table 31. By Country – Europe Smart Mobile POS Revenue, (US$, Mn), 2026-2032
Table 32. By Country – Europe Smart Mobile POS Sales, (K Units), 2020-2025
Table 33. By Country – Europe Smart Mobile POS Sales, (K Units), 2026-2032
Table 34. By Region – Asia Smart Mobile POS Revenue, (US$, Mn), 2020-2025
Table 35. By Region – Asia Smart Mobile POS Revenue, (US$, Mn), 2026-2032
Table 36. By Region – Asia Smart Mobile POS Sales, (K Units), 2020-2025
Table 37. By Region – Asia Smart Mobile POS Sales, (K Units), 2026-2032
Table 38. By Country – South America Smart Mobile POS Revenue, (US$, Mn), 2020-2025
Table 39. By Country – South America Smart Mobile POS Revenue, (US$, Mn), 2026-2032
Table 40. By Country – South America Smart Mobile POS Sales, (K Units), 2020-2025
Table 41. By Country – South America Smart Mobile POS Sales, (K Units), 2026-2032
Table 42. By Country – Middle East & Africa Smart Mobile POS Revenue, (US$, Mn), 2020-2025
Table 43. By Country – Middle East & Africa Smart Mobile POS Revenue, (US$, Mn), 2026-2032
Table 44. By Country – Middle East & Africa Smart Mobile POS Sales, (K Units), 2020-2025
Table 45. By Country – Middle East & Africa Smart Mobile POS Sales, (K Units), 2026-2032
Table 46. Landi Company Summary
Table 47. Landi Smart Mobile POS Product Offerings
Table 48. Landi Smart Mobile POS Sales (K Units), Revenue (US$, Mn) and Average Price (USD/Unit) & (2020-2025)
Table 49. Landi Key News & Latest Developments
Table 50. SZZT Electronics Company Summary
Table 51. SZZT Electronics Smart Mobile POS Product Offerings
Table 52. SZZT Electronics Smart Mobile POS Sales (K Units), Revenue (US$, Mn) and Average Price (USD/Unit) & (2020-2025)
Table 53. SZZT Electronics Key News & Latest Developments
Table 54. WizarPOS Company Summary
Table 55. WizarPOS Smart Mobile POS Product Offerings
Table 56. WizarPOS Smart Mobile POS Sales (K Units), Revenue (US$, Mn) and Average Price (USD/Unit) & (2020-2025)
Table 57. WizarPOS Key News & Latest Developments
Table 58. Newland Payment Company Summary
Table 59. Newland Payment Smart Mobile POS Product Offerings
Table 60. Newland Payment Smart Mobile POS Sales (K Units), Revenue (US$, Mn) and Average Price (USD/Unit) & (2020-2025)
Table 61. Newland Payment Key News & Latest Developments
Table 62. Fujian Centerm Company Summary
Table 63. Fujian Centerm Smart Mobile POS Product Offerings
Table 64. Fujian Centerm Smart Mobile POS Sales (K Units), Revenue (US$, Mn) and Average Price (USD/Unit) & (2020-2025)
Table 65. Fujian Centerm Key News & Latest Developments
Table 66. Verifone Company Summary
Table 67. Verifone Smart Mobile POS Product Offerings
Table 68. Verifone Smart Mobile POS Sales (K Units), Revenue (US$, Mn) and Average Price (USD/Unit) & (2020-2025)
Table 69. Verifone Key News & Latest Developments
Table 70. PAX Technology Company Summary
Table 71. PAX Technology Smart Mobile POS Product Offerings
Table 72. PAX Technology Smart Mobile POS Sales (K Units), Revenue (US$, Mn) and Average Price (USD/Unit) & (2020-2025)
Table 73. PAX Technology Key News & Latest Developments
Table 74. Xinguodu Company Summary
Table 75. Xinguodu Smart Mobile POS Product Offerings
Table 76. Xinguodu Smart Mobile POS Sales (K Units), Revenue (US$, Mn) and Average Price (USD/Unit) & (2020-2025)
Table 77. Xinguodu Key News & Latest Developments
Table 78. Smartpeak Company Summary
Table 79. Smartpeak Smart Mobile POS Product Offerings
Table 80. Smartpeak Smart Mobile POS Sales (K Units), Revenue (US$, Mn) and Average Price (USD/Unit) & (2020-2025)
Table 81. Smartpeak Key News & Latest Developments
Table 82. NEWPOS Company Summary
Table 83. NEWPOS Smart Mobile POS Product Offerings
Table 84. NEWPOS Smart Mobile POS Sales (K Units), Revenue (US$, Mn) and Average Price (USD/Unit) & (2020-2025)
Table 85. NEWPOS Key News & Latest Developments
Table 86. Wiseasy Technology Company Summary
Table 87. Wiseasy Technology Smart Mobile POS Product Offerings
Table 88. Wiseasy Technology Smart Mobile POS Sales (K Units), Revenue (US$, Mn) and Average Price (USD/Unit) & (2020-2025)
Table 89. Wiseasy Technology Key News & Latest Developments
Table 90. Justtide Company Summary
Table 91. Justtide Smart Mobile POS Product Offerings
Table 92. Justtide Smart Mobile POS Sales (K Units), Revenue (US$, Mn) and Average Price (USD/Unit) & (2020-2025)
Table 93. Justtide Key News & Latest Developments
Table 94. Smart Mobile POS Capacity of Key Manufacturers in Global Market, 2023-2025 (K Units)
Table 95. Global Smart Mobile POS Capacity Market Share of Key Manufacturers, 2023-2025
Table 96. Global Smart Mobile POS Production by Region, 2020-2025 (K Units)
Table 97. Global Smart Mobile POS Production by Region, 2026-2032 (K Units)
Table 98. Smart Mobile POS Market Opportunities & Trends in Global Market
Table 99. Smart Mobile POS Market Drivers in Global Market
Table 100. Smart Mobile POS Market Restraints in Global Market
Table 101. Smart Mobile POS Raw Materials
Table 102. Smart Mobile POS Raw Materials Suppliers in Global Market
Table 103. Typical Smart Mobile POS Downstream
Table 104. Smart Mobile POS Downstream Clients in Global Market
Table 105. Smart Mobile POS Distributors and Sales Agents in Global Market

List of Figures
Figure 1. Smart Mobile POS Product Picture
Figure 2. Smart Mobile POS Segment by Price Level in 2024
Figure 3. Smart Mobile POS Segment by Application in 2024
Figure 4. Global Smart Mobile POS Market Overview: 2024
Figure 5. Key Caveats
Figure 6. Global Smart Mobile POS Market Size: 2024 VS 2032 (US$, Mn)
Figure 7. Global Smart Mobile POS Revenue: 2020-2032 (US$, Mn)
Figure 8. Smart Mobile POS Sales in Global Market: 2020-2032 (K Units)
Figure 9. The Top 3 and 5 Players Market Share by Smart Mobile POS Revenue in 2024
Figure 10. Segment by Price Level – Global Smart Mobile POS Revenue, (US$, Mn), 2024 & 2032
Figure 11. Segment by Price Level – Global Smart Mobile POS Revenue Market Share, 2020-2032
Figure 12. Segment by Price Level – Global Smart Mobile POS Sales Market Share, 2020-2032
Figure 13. Segment by Price Level – Global Smart Mobile POS Price (USD/Unit), 2020-2032
Figure 14. Segment by Application – Global Smart Mobile POS Revenue, (US$, Mn), 2024 & 2032
Figure 15. Segment by Application – Global Smart Mobile POS Revenue Market Share, 2020-2032
Figure 16. Segment by Application – Global Smart Mobile POS Sales Market Share, 2020-2032
Figure 17. Segment by Application -Global Smart Mobile POS Price (USD/Unit), 2020-2032
Figure 18. By Region – Global Smart Mobile POS Revenue, (US$, Mn), 2025 & 2032
Figure 19. By Region – Global Smart Mobile POS Revenue Market Share, 2020 VS 2024 VS 2032
Figure 20. By Region – Global Smart Mobile POS Revenue Market Share, 2020-2032
Figure 21. By Region – Global Smart Mobile POS Sales Market Share, 2020-2032
Figure 22. By Country – North America Smart Mobile POS Revenue Market Share, 2020-2032
Figure 23. By Country – North America Smart Mobile POS Sales Market Share, 2020-2032
Figure 24. United States Smart Mobile POS Revenue, (US$, Mn), 2020-2032
Figure 25. Canada Smart Mobile POS Revenue, (US$, Mn), 2020-2032
Figure 26. Mexico Smart Mobile POS Revenue, (US$, Mn), 2020-2032
Figure 27. By Country – Europe Smart Mobile POS Revenue Market Share, 2020-2032
Figure 28. By Country – Europe Smart Mobile POS Sales Market Share, 2020-2032
Figure 29. Germany Smart Mobile POS Revenue, (US$, Mn), 2020-2032
Figure 30. France Smart Mobile POS Revenue, (US$, Mn), 2020-2032
Figure 31. U.K. Smart Mobile POS Revenue, (US$, Mn), 2020-2032
Figure 32. Italy Smart Mobile POS Revenue, (US$, Mn), 2020-2032
Figure 33. Russia Smart Mobile POS Revenue, (US$, Mn), 2020-2032
Figure 34. Nordic Countries Smart Mobile POS Revenue, (US$, Mn), 2020-2032
Figure 35. Benelux Smart Mobile POS Revenue, (US$, Mn), 2020-2032
Figure 36. By Region – Asia Smart Mobile POS Revenue Market Share, 2020-2032
Figure 37. By Region – Asia Smart Mobile POS Sales Market Share, 2020-2032
Figure 38. China Smart Mobile POS Revenue, (US$, Mn), 2020-2032
Figure 39. Japan Smart Mobile POS Revenue, (US$, Mn), 2020-2032
Figure 40. South Korea Smart Mobile POS Revenue, (US$, Mn), 2020-2032
Figure 41. Southeast Asia Smart Mobile POS Revenue, (US$, Mn), 2020-2032
Figure 42. India Smart Mobile POS Revenue, (US$, Mn), 2020-2032
Figure 43. By Country – South America Smart Mobile POS Revenue Market Share, 2020-2032
Figure 44. By Country – South America Smart Mobile POS Sales, Market Share, 2020-2032
Figure 45. Brazil Smart Mobile POS Revenue, (US$, Mn), 2020-2032
Figure 46. Argentina Smart Mobile POS Revenue, (US$, Mn), 2020-2032
Figure 47. By Country – Middle East & Africa Smart Mobile POS Revenue, Market Share, 2020-2032
Figure 48. By Country – Middle East & Africa Smart Mobile POS Sales, Market Share, 2020-2032
Figure 49. Turkey Smart Mobile POS Revenue, (US$, Mn), 2020-2032
Figure 50. Israel Smart Mobile POS Revenue, (US$, Mn), 2020-2032
Figure 51. Saudi Arabia Smart Mobile POS Revenue, (US$, Mn), 2020-2032
Figure 52. UAE Smart Mobile POS Revenue, (US$, Mn), 2020-2032
Figure 53. Global Smart Mobile POS Production Capacity (K Units), 2020-2032
Figure 54. The Percentage of Production Smart Mobile POS by Region, 2024 VS 2032
Figure 55. Smart Mobile POS Industry Value Chain
Figure 56. Marketing Channels