Silicon Drift Detector Sensor Market, Trends, Business Strategies 2025-2032

Silicon Drift Detector Sensor market was valued at 294 million in 2024 and is projected to reach US$ 607 million by 2032, at a CAGR of 11.2% during the forecast period

PDF Icon Download Sample Report PDF
  • Quick Dispatch

    All Orders

  • Secure Payment

    100% Secure Payment

Price range: $1,500.00 through $4,250.00

Clear

MARKET INSIGHTS

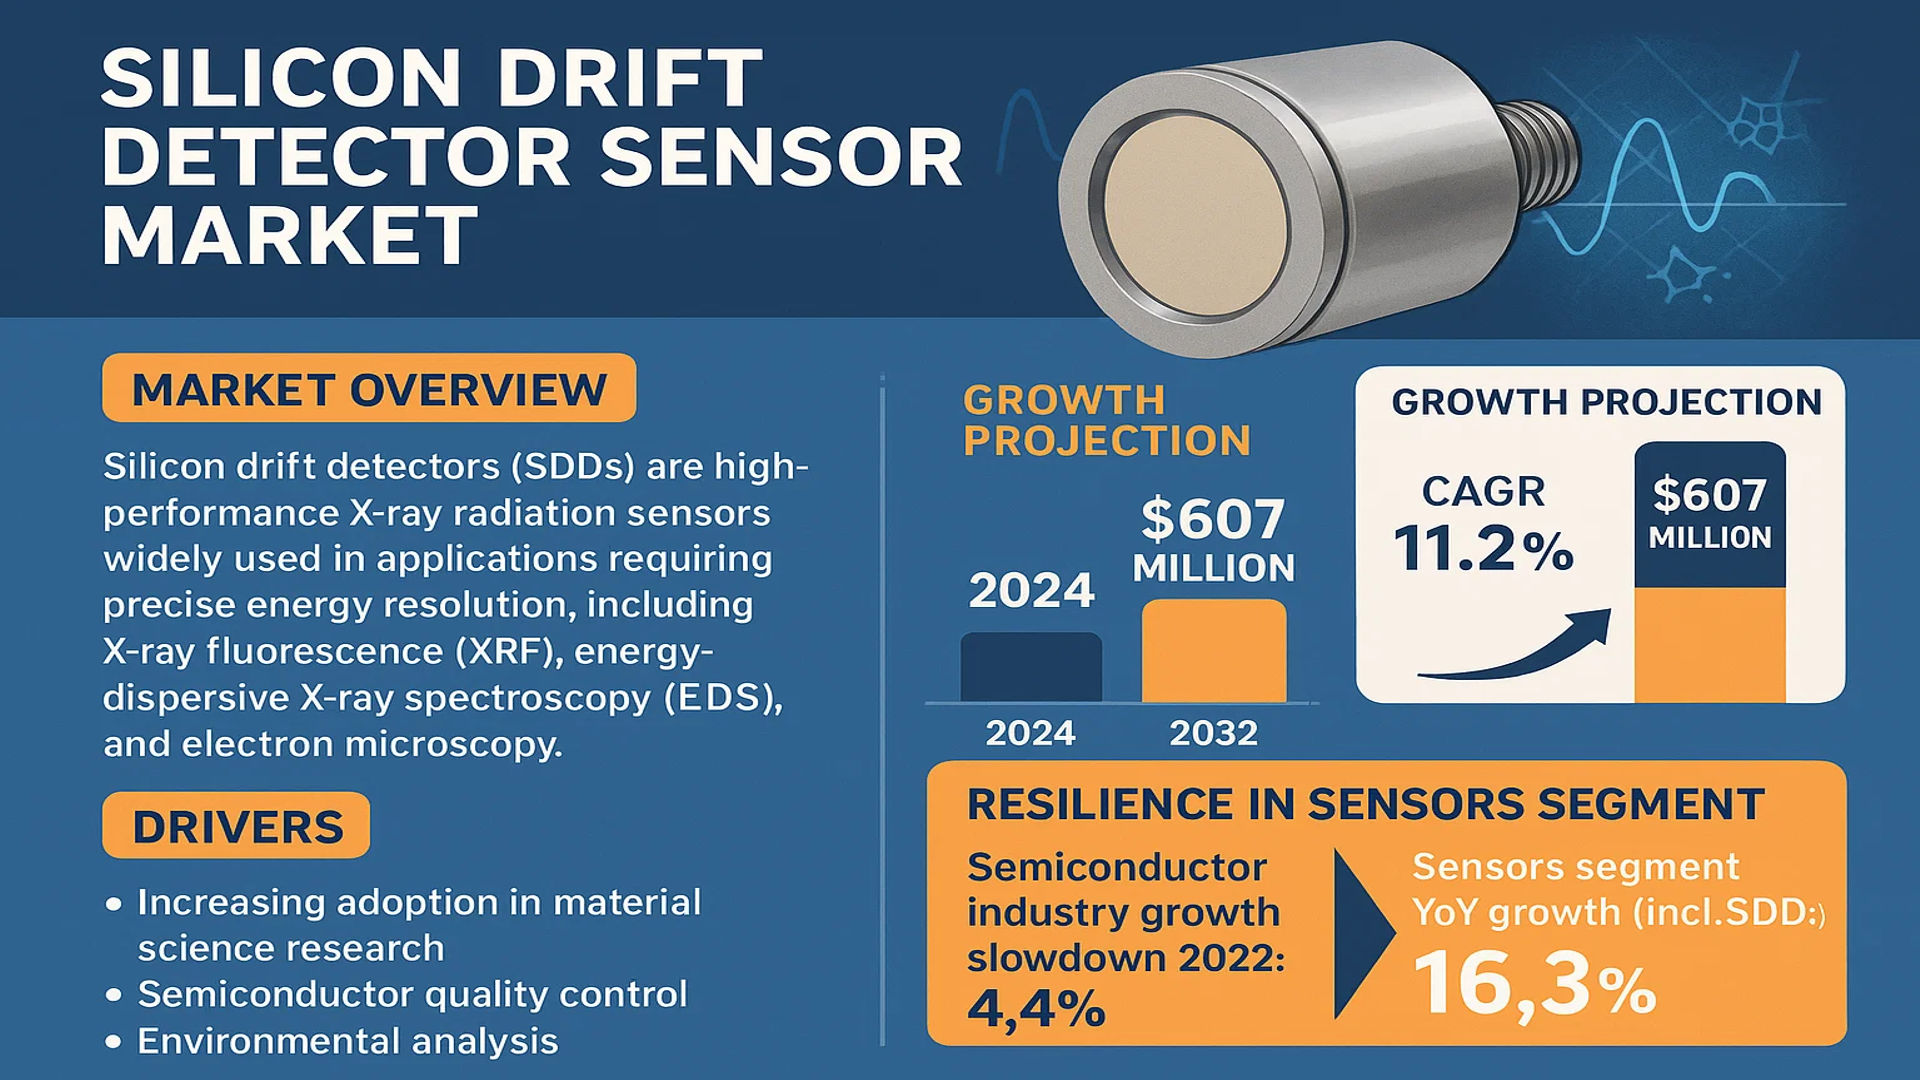
The global Silicon Drift Detector Sensor Market was valued at 294 million in 2024 and is projected to reach US$ 607 million by 2032, at a CAGR of 11.2% during the forecast period.

Silicon drift detectors (SDDs) are high-performance X-ray radiation sensors widely used in applications requiring precise energy resolution, including X-ray fluorescence (XRF), energy-dispersive X-ray spectroscopy (EDS), and electron microscopy. These detectors operate by collecting charge carriers (electrons) generated by X-ray photons in a silicon crystal structure, offering superior count rate capabilities and energy resolution compared to conventional detectors.

The market growth is driven by increasing adoption in material science research, semiconductor quality control, and environmental analysis. While the semiconductor industry faced a slowdown in 2022 with overall growth of just 4.4%, the sensors segment – including SDDs – demonstrated resilience with 16.3% year-over-year growth. Recent technological advancements in detector miniaturization and cooling systems are further expanding application possibilities. Key players such as Ketek, Mirion Technologies, and Amptek (AMETEK) continue to innovate, developing SDDs with larger active areas (exceeding 100 mm²) to meet growing analytical demands across industries.

Silicon Drift Detector Sensor Market

MARKET DYNAMICS

MARKET DRIVERS

Rising Demand for Advanced Analytical Techniques in Material Sciences Fuels Market Growth

The global Silicon Drift Detector (SDD) sensor market is experiencing significant growth driven by increasing adoption in material sciences. SDDs offer superior energy resolution and faster processing speeds compared to traditional detectors, enabling more precise elemental analysis. With industries requiring nanoscale material characterization, the demand for high-performance X-ray detectors in electron microscopy and spectroscopy applications has surged. The semiconductor industry alone accounts for over 35% of SDD sensor utilization, with the growing complexity of chip designs necessitating more sophisticated analytical tools. Asia-Pacific has emerged as a key growth region, with semiconductor R&D investments growing at approximately 15% annually since 2020.

Expansion of Pharmaceutical Quality Control Infrastructure Creates New Demand

Pharmaceutical manufacturers are increasingly implementing SDD-based energy dispersive X-ray spectroscopy (EDS) systems for contaminant detection and quality control. The technology’s ability to identify trace metal impurities at parts-per-million levels aligns perfectly with stringent regulatory requirements. With global pharmaceutical quality control equipment spending projected to exceed $9 billion by 2026, SDD sensors are becoming integral components in modern laboratories. Recent advancements in detector cooling systems have extended operational lifetimes by up to 40%, significantly improving cost-efficiency for end users. The market has responded positively, with SDD adoption rates in pharmaceutical applications growing at a compound annual rate of 13.5% since 2021.

Government Investments in Academic Research Accelerate Market Penetration

Academic and government research institutions are driving demand for high-end analytical equipment, with SDD sensors playing a crucial role in cutting-edge physics and materials research. The European Union’s Horizon Europe program has allocated over €700 million for advanced research instrumentation, while the U.S. National Science Foundation’s Major Research Instrumentation program continues to fund university equipment purchases. Such initiatives have created a steady demand stream for SDD-equipped microscopy systems, particularly those with active areas exceeding 100mm². Research-grade SDD implementations now account for nearly 25% of the total market, with double-digit growth projected through 2030.

MARKET CHALLENGES

High Initial Investment and Maintenance Costs Limit Widespread Adoption

While SDD technology offers superior performance, the substantial capital expenditure required for complete systems presents a significant barrier to entry. A fully configured SDD-based analysis system can cost between $150,000 to $500,000, with annual maintenance adding 10-15% to operational budgets. This pricing structure makes the technology inaccessible for smaller laboratories and educational institutions operating under constrained budgets. Manufacturers face the dual challenge of maintaining performance standards while reducing production costs, particularly for emerging markets where price sensitivity is higher. Cryogenic cooling systems, while necessary for optimal performance, contribute significantly to both initial costs and long-term operational expenses.

Other Challenges

Technical Complexity in Integration
The integration of SDD sensors with existing laboratory equipment requires specialized expertise, creating implementation bottlenecks. Unlike conventional detectors, SDD systems demand precise alignment and calibration, often necessitating manufacturer-trained technicians. This requirement extends downtime during maintenance periods and increases total cost of ownership.

Supply Chain Vulnerabilities
The semiconductor shortages affecting global markets have indirectly impacted SDD sensor production timelines. With lead times for certain components extending beyond 12 months, manufacturers struggle to meet the increasing demand from research and industrial sectors.

MARKET RESTRAINTS

Performance Limitations in Extreme Conditions Hamper Certain Applications

Despite their advantages, SDD sensors exhibit performance degradation in high-temperature environments and under prolonged exposure to intense radiation. This characteristic restricts their use in certain industrial and aerospace applications where conventional detectors continue to dominate. The maximum operational temperature threshold of ~-30°C to +50°C presents challenges for field applications in harsh environments. While manufacturers have introduced advanced cooling solutions, these add complexity and cost, with performance improvements averaging only 15-20% in extreme conditions. Such limitations have slowed SDD adoption in sectors like oilfield exploration and defense applications, where reliability under adverse conditions is paramount.

MARKET OPPORTUNITIES

Emerging Applications in Renewable Energy Create New Growth Potential

The rapid expansion of renewable energy technologies is generating novel applications for SDD sensors. In photovoltaic manufacturing, these detectors enable precise compositional analysis of thin-film solar cells, helping optimize conversion efficiencies. Battery research laboratories are increasingly adopting SDD-equipped systems to study next-generation energy storage materials at the atomic level. With global investments in clean energy research exceeding $1 trillion annually, the potential addressable market for specialized analytical equipment continues to expand. Manufacturers who develop application-specific SDD configurations for these emerging sectors stand to capture significant market share in coming years.

Miniaturization Trends Open Doors for Compact SDD Solutions

Advances in semiconductor manufacturing have enabled the development of compact SDD modules suitable for portable analytical instruments. Field-deployable XRF analyzers incorporating these miniaturized detectors are gaining traction in mining, archaeology, and environmental monitoring applications. The portable analyzers market, currently valued at approximately $2.5 billion, is projected to grow at 8% CAGR through 2030, with SDD-based solutions capturing an increasing share. Manufacturers focusing on size reduction without compromising performance metrics can capitalize on this trend, particularly in regions with growing field science requirements.

SILICON DRIFT DETECTOR SENSOR MARKET TRENDS

Growth in Semiconductor Demand Boosts Silicon Drift Detector Sensor Market

The global Silicon Drift Detector (SDD) Sensor market is experiencing robust growth, driven by increasing demand in advanced material analysis and semiconductor manufacturing. SDDs, widely used for X-ray spectrometry (XRF and EDS) and electron microscopy, have gained traction due to their high energy resolution and quicker data acquisition compared to traditional detectors. The market, valued at $294 million in 2024, is projected to surge to $607 million by 2032, expanding at a CAGR of 11.2%. This rapid growth is fueled by the semiconductor industry’s expansion, which saw analog and sensor segments growing by 20.8% and 16.3% respectively in 2022 despite macroeconomic challenges. The integration of SDDs in high-sensitivity applications, such as failure analysis in semiconductor fabrication, is accelerating adoption.

Other Trends

Advancements in Analytical Instrumentation

The increasing complexity of material characterization in industries such as pharmaceuticals, aerospace, and mining is driving innovation in SDD technology. Companies are focusing on developing detectors with larger active areas (e.g., >100 mm²) for enhanced sensitivity in low-concentration sample analysis. For instance, X-ray fluorescence (XRF) applications now demand SDDs capable of detecting trace elements with minimal interference, boosting the segment’s market share. Electron microscopy, another key application, is projected to grow significantly due to rising R&D investments in nanotechnology and life sciences, where SDDs provide superior resolution for microstructural analysis.

Expansion of Industrial Automation and Quality Control

Industrial automation is transforming quality control processes, particularly in manufacturing sectors requiring real-time elemental analysis. SDDs are increasingly integrated into automated XRF spectrometers for on-site material testing in metal fabrication, recycling, and environmental monitoring. The Asia-Pacific region, despite a semiconductor market contraction of 2% in 2022, remains a critical growth area due to expanding electronics production in China and South Korea. Moreover, regulatory pressures for stricter material compliance (e.g., RoHS and REACH) are compelling manufacturers to adopt SDD-based solutions for precise contaminant detection in finished products, further propelling market demand.

COMPETITIVE LANDSCAPE

Key Industry Players

Leading Manufacturers Drive Innovation in High-Precision Detection Technology

The global silicon drift detector (SDD) sensor market features a competitive yet moderately fragmented landscape, with key players accounting for approximately 65% of market revenue in 2024. Ketek GmbH maintains its leadership position through continuous innovation in radiation detection technology, holding an estimated 18% revenue share. The company’s SDD products are widely adopted in electron microscopy applications, particularly in semiconductor failure analysis laboratories.

Amptek (AMETEK) follows closely with 15% market share, leveraging its expertise in X-ray instrumentation to deliver high-resolution detectors for both industrial and research applications. Their recent product development focuses on improving energy resolution below 125 eV at Mn Kα, which has become an industry benchmark for performance.

Meanwhile, Mirion Technologies has been expanding its presence through strategic acquisitions, including the purchase of a radiation detection division from Thermo Fisher Scientific in 2023. This move strengthened their capability across multiple application segments, from security screening to materials science.

Emerging players like Nuchip Photoelectric are challenging established brands with competitively priced alternatives, particularly in the Asia-Pacific market. Their rapid growth reflects the increasing demand for cost-effective solutions in educational institutions and smaller research facilities.

List of Key Silicon Drift Detector Sensor Manufacturers

  • Ketek GmbH (Germany)
  • Amptek Inc. (AMETEK) (U.S.)
  • Mirion Technologies (U.S.)
  • RaySpec Ltd (UK)
  • PNDetector GmbH (Germany)
  • Nuchip Photoelectric Technology Co., Ltd. (China)
  • Bruker Corporation (U.S.)
  • Oxford Instruments (UK)

Segment Analysis:

By Type

Active Area ≤ 30 mm² Segment Leads Due to High Precision Requirements in Compact Devices

The market is segmented based on type into:

  • Active Area ≤ 30 mm²
  • 30 mm² < Active Area ≤ 100 mm²
  • Active Area > 100 mm²

By Application

EDS Application Dominates Owing to Widespread Use in Material Science and Semiconductor Analysis

The market is segmented based on application into:

  • X-ray Fluorescence (XRF)
  • Energy Dispersive Spectroscopy (EDS)
  • Electron Microscopy
  • Others

By End-Use Industry

Semiconductor Industry Holds Significant Share Due to Increasing Demand for Quality Inspection

The market is segmented based on end-use industry into:

  • Semiconductor
  • Healthcare and Life Sciences
  • Industrial Manufacturing
  • Research Institutions
  • Others

Regional Analysis: Silicon Drift Detector Sensor Market

Asia-Pacific
The Asia-Pacific region dominates the Silicon Drift Detector (SDD) sensor market with over 42% global market share in 2024. This leadership stems from China’s booming semiconductor industry and Japan’s advanced electronics manufacturing ecosystem. China alone contributes nearly 60% of regional demand, with key applications in metal analysis (XRF) and semiconductor quality control (EDS). While India shows promising growth in analytical instrumentation, price sensitivity remains a challenge. South Korea and Taiwan are adoption hotspots for electron microscopy applications, benefiting from their strong semiconductor fabrication facilities. The region’s lower production costs also attract SDD manufacturers to establish local operations, though technology sophistication still trails Western markets.

North America
North America represents the most technologically advanced SDD sensor market, characterized by high-value applications in research laboratories and defense sectors. The U.S. accounts for 82% of regional demand, driven by robust investments in materials science research (notably at DOE national labs) and shale gas exploration (requiring portable XRF analyzers). Stringent safety regulations in the oil & gas industry are accelerating the replacement of older detectors with SDD technologies. Major manufacturers like Amptek maintain R&D centers in Massachusetts, benefiting from academic partnerships with MIT and Harvard. Canada shows growing adoption in mining sector applications, though market penetration remains below potential.

Europe
Europe’s SDD market thrives on precision-focused applications, with Germany, France, and the UK leading adoption. The region holds particular strength in electron microscopy systems, where Zeiss and Thermo Fisher Scientific integrate SDDs into advanced materials characterization tools. EU-funded research initiatives for nanotechnology and clean energy solutions are creating sustained demand. Scandinavian countries demonstrate above-average growth, especially in environmental monitoring applications. However, complex certification processes under CE marking regulations occasionally slow product launches. Eastern Europe shows untapped potential, currently limited by budget constraints in academic and industrial research sectors.

South America
The South American SDD sensor market remains in development stage, concentrated primarily in Brazil’s mining and oil industries. Portable XRF guns for ore analysis represent the largest application segment. Argentina shows growing activity in agricultural soil testing, though economic volatility frequently disrupts capital equipment investments. Regional demand suffers from limited local technical support and high import duties on analytical instruments. Nevertheless, copper mining expansions in Chile and Peru forecast promising medium-term growth, particularly for field-deployable SDD solutions that reduce laboratory dependence.

Middle East & Africa
This emerging market shows concentrated demand in Gulf Cooperation Council (GCC) countries, particularly for petroleum and precious metal analysis. The UAE leads in adoption, with Dubai’s gold trade driving XRF analyzer requirements. Saudi Arabia’s Vision 2030 industrialization plans are beginning to generate demand for quality control instrumentation. Africa’s market remains largely untapped, though South Africa demonstrates steady growth in mining applications. Israel presents a unique case with strong capabilities in detector technology development, though primarily for defense applications rather than commercial SDD systems. Infrastructure limitations and intermittent power supply constrain broader African adoption.

Report Scope

This market research report provides a comprehensive analysis of the Global Silicon Drift Detector Sensor market, covering the forecast period 2025–2032. It offers detailed insights into market dynamics, technological advancements, competitive landscape, and key trends shaping the industry.

Key focus areas of the report include:

  • Market Size & Forecast: Historical data and future projections for revenue, unit shipments, and market value across major regions and segments. The market was valued at USD 294 million in 2024 and is projected to reach USD 607 million by 2032, growing at a CAGR of 11.2%.
  • Segmentation Analysis: Detailed breakdown by product type (Active Area ≤ 30 mm², 30 mm² ≤ Active Area ≤ 100 mm², Active Area ≥ 100 mm²), application (XRF, EDS, Electron Microscopy, Others), and end-user industry to identify high-growth segments.
  • Regional Outlook: Insights into market performance across North America, Europe, Asia-Pacific, Latin America, and Middle East & Africa. In 2024, Asia-Pacific accounted for the largest share, while Europe showed significant growth potential.
  • Competitive Landscape: Profiles of leading market participants including Ketek, RaySpec, Mirion Technologies, PNDetector, Amptek (AMETEK), and Nuchip Photoelectric, with analysis of their market share, product portfolios, and recent developments.
  • Technology Trends & Innovation: Assessment of emerging semiconductor fabrication techniques, integration with AI/ML for enhanced X-ray detection, and improvements in detector resolution and efficiency.
  • Market Drivers & Restraints: Evaluation of factors such as increasing demand for material analysis in semiconductor manufacturing, growth in electron microscopy applications, along with challenges like high production costs and supply chain constraints.
  • Stakeholder Analysis: Strategic insights for sensor manufacturers, analytical instrument OEMs, research institutions, and investors regarding market opportunities and competitive positioning.

Primary and secondary research methods were employed, including interviews with industry experts and analysis of verified market data, to ensure the accuracy and reliability of the findings.

FREQUENTLY ASKED QUESTIONS:

What is the current market size of Global Silicon Drift Detector Sensor Market?

-> Silicon Drift Detector Sensor market was valued at 294 million in 2024 and is projected to reach US$ 607 million by 2032, at a CAGR of 11.2% during the forecast period.

Which key companies operate in Global Silicon Drift Detector Sensor Market?

-> Key players include Ketek, RaySpec, Mirion Technologies, PNDetector, Amptek (AMETEK), and Nuchip Photoelectric.

What are the key growth drivers?

-> Growth is driven by increasing demand for material analysis in semiconductor manufacturing, advancements in electron microscopy, and expanding applications in XRF and EDS technologies.

Which region dominates the market?

-> Asia-Pacific holds the largest market share, while North America shows strong growth due to technological advancements and R&D investments.

What are the emerging trends?

-> Emerging trends include integration of AI for improved detection accuracy, development of higher resolution detectors, and increasing adoption in semiconductor quality control applications.

Silicon Drift Detector Sensor Market, Trends, Business Strategies 2025-2032

Get Sample Report PDF for Exclusive Insights

Report Sample Includes

  • Table of Contents
  • List of Tables & Figures
  • Charts, Research Methodology, and more...
PDF Icon Download Sample Report PDF
SKU: ce941172b6cf
Category:

Download Sample Report

Table of Content

1 Introduction to Research & Analysis Reports
1.1 Silicon Drift Detector Sensor Market Definition
1.2 Market Segments
1.2.1 Segment by Type
1.2.2 Segment by Application
1.3 Global Silicon Drift Detector Sensor Market Overview
1.4 Features & Benefits of This Report
1.5 Methodology & Sources of Information
1.5.1 Research Methodology
1.5.2 Research Process
1.5.3 Base Year
1.5.4 Report Assumptions & Caveats
2 Global Silicon Drift Detector Sensor Overall Market Size
2.1 Global Silicon Drift Detector Sensor Market Size: 2024 VS 2032
2.2 Global Silicon Drift Detector Sensor Market Size, Prospects & Forecasts: 2020-2032
2.3 Global Silicon Drift Detector Sensor Sales: 2020-2032
3 Company Landscape
3.1 Top Silicon Drift Detector Sensor Players in Global Market
3.2 Top Global Silicon Drift Detector Sensor Companies Ranked by Revenue
3.3 Global Silicon Drift Detector Sensor Revenue by Companies
3.4 Global Silicon Drift Detector Sensor Sales by Companies
3.5 Global Silicon Drift Detector Sensor Price by Manufacturer (2020-2025)
3.6 Top 3 and Top 5 Silicon Drift Detector Sensor Companies in Global Market, by Revenue in 2024
3.7 Global Manufacturers Silicon Drift Detector Sensor Product Type
3.8 Tier 1, Tier 2, and Tier 3 Silicon Drift Detector Sensor Players in Global Market
3.8.1 List of Global Tier 1 Silicon Drift Detector Sensor Companies
3.8.2 List of Global Tier 2 and Tier 3 Silicon Drift Detector Sensor Companies
4 Sights by Product
4.1 Overview
4.1.1 Segment by Type – Global Silicon Drift Detector Sensor Market Size Markets, 2024 & 2032
4.1.2 Active Area ? 30 mm2
4.1.3 30 mm2?Active Area?100 mm2
4.1.4 Active Area ? 100 mm2
4.2 Segment by Type – Global Silicon Drift Detector Sensor Revenue & Forecasts
4.2.1 Segment by Type – Global Silicon Drift Detector Sensor Revenue, 2020-2025
4.2.2 Segment by Type – Global Silicon Drift Detector Sensor Revenue, 2026-2032
4.2.3 Segment by Type – Global Silicon Drift Detector Sensor Revenue Market Share, 2020-2032
4.3 Segment by Type – Global Silicon Drift Detector Sensor Sales & Forecasts
4.3.1 Segment by Type – Global Silicon Drift Detector Sensor Sales, 2020-2025
4.3.2 Segment by Type – Global Silicon Drift Detector Sensor Sales, 2026-2032
4.3.3 Segment by Type – Global Silicon Drift Detector Sensor Sales Market Share, 2020-2032
4.4 Segment by Type – Global Silicon Drift Detector Sensor Price (Manufacturers Selling Prices), 2020-2032
5 Sights by Application
5.1 Overview
5.1.1 Segment by Application – Global Silicon Drift Detector Sensor Market Size, 2024 & 2032
5.1.2 XRF
5.1.3 EDS
5.1.4 Electron Microscopy
5.1.5 Others
5.2 Segment by Application – Global Silicon Drift Detector Sensor Revenue & Forecasts
5.2.1 Segment by Application – Global Silicon Drift Detector Sensor Revenue, 2020-2025
5.2.2 Segment by Application – Global Silicon Drift Detector Sensor Revenue, 2026-2032
5.2.3 Segment by Application – Global Silicon Drift Detector Sensor Revenue Market Share, 2020-2032
5.3 Segment by Application – Global Silicon Drift Detector Sensor Sales & Forecasts
5.3.1 Segment by Application – Global Silicon Drift Detector Sensor Sales, 2020-2025
5.3.2 Segment by Application – Global Silicon Drift Detector Sensor Sales, 2026-2032
5.3.3 Segment by Application – Global Silicon Drift Detector Sensor Sales Market Share, 2020-2032
5.4 Segment by Application – Global Silicon Drift Detector Sensor Price (Manufacturers Selling Prices), 2020-2032
6 Sights by Region
6.1 By Region – Global Silicon Drift Detector Sensor Market Size, 2024 & 2032
6.2 By Region – Global Silicon Drift Detector Sensor Revenue & Forecasts
6.2.1 By Region – Global Silicon Drift Detector Sensor Revenue, 2020-2025
6.2.2 By Region – Global Silicon Drift Detector Sensor Revenue, 2026-2032
6.2.3 By Region – Global Silicon Drift Detector Sensor Revenue Market Share, 2020-2032
6.3 By Region – Global Silicon Drift Detector Sensor Sales & Forecasts
6.3.1 By Region – Global Silicon Drift Detector Sensor Sales, 2020-2025
6.3.2 By Region – Global Silicon Drift Detector Sensor Sales, 2026-2032
6.3.3 By Region – Global Silicon Drift Detector Sensor Sales Market Share, 2020-2032
6.4 North America
6.4.1 By Country – North America Silicon Drift Detector Sensor Revenue, 2020-2032
6.4.2 By Country – North America Silicon Drift Detector Sensor Sales, 2020-2032
6.4.3 United States Silicon Drift Detector Sensor Market Size, 2020-2032
6.4.4 Canada Silicon Drift Detector Sensor Market Size, 2020-2032
6.4.5 Mexico Silicon Drift Detector Sensor Market Size, 2020-2032
6.5 Europe
6.5.1 By Country – Europe Silicon Drift Detector Sensor Revenue, 2020-2032
6.5.2 By Country – Europe Silicon Drift Detector Sensor Sales, 2020-2032
6.5.3 Germany Silicon Drift Detector Sensor Market Size, 2020-2032
6.5.4 France Silicon Drift Detector Sensor Market Size, 2020-2032
6.5.5 U.K. Silicon Drift Detector Sensor Market Size, 2020-2032
6.5.6 Italy Silicon Drift Detector Sensor Market Size, 2020-2032
6.5.7 Russia Silicon Drift Detector Sensor Market Size, 2020-2032
6.5.8 Nordic Countries Silicon Drift Detector Sensor Market Size, 2020-2032
6.5.9 Benelux Silicon Drift Detector Sensor Market Size, 2020-2032
6.6 Asia
6.6.1 By Region – Asia Silicon Drift Detector Sensor Revenue, 2020-2032
6.6.2 By Region – Asia Silicon Drift Detector Sensor Sales, 2020-2032
6.6.3 China Silicon Drift Detector Sensor Market Size, 2020-2032
6.6.4 Japan Silicon Drift Detector Sensor Market Size, 2020-2032
6.6.5 South Korea Silicon Drift Detector Sensor Market Size, 2020-2032
6.6.6 Southeast Asia Silicon Drift Detector Sensor Market Size, 2020-2032
6.6.7 India Silicon Drift Detector Sensor Market Size, 2020-2032
6.7 South America
6.7.1 By Country – South America Silicon Drift Detector Sensor Revenue, 2020-2032
6.7.2 By Country – South America Silicon Drift Detector Sensor Sales, 2020-2032
6.7.3 Brazil Silicon Drift Detector Sensor Market Size, 2020-2032
6.7.4 Argentina Silicon Drift Detector Sensor Market Size, 2020-2032
6.8 Middle East & Africa
6.8.1 By Country – Middle East & Africa Silicon Drift Detector Sensor Revenue, 2020-2032
6.8.2 By Country – Middle East & Africa Silicon Drift Detector Sensor Sales, 2020-2032
6.8.3 Turkey Silicon Drift Detector Sensor Market Size, 2020-2032
6.8.4 Israel Silicon Drift Detector Sensor Market Size, 2020-2032
6.8.5 Saudi Arabia Silicon Drift Detector Sensor Market Size, 2020-2032
6.8.6 UAE Silicon Drift Detector Sensor Market Size, 2020-2032
7 Manufacturers & Brands Profiles
7.1 Ketek
7.1.1 Ketek Company Summary
7.1.2 Ketek Business Overview
7.1.3 Ketek Silicon Drift Detector Sensor Major Product Offerings
7.1.4 Ketek Silicon Drift Detector Sensor Sales and Revenue in Global (2020-2025)
7.1.5 Ketek Key News & Latest Developments
7.2 RaySpec
7.2.1 RaySpec Company Summary
7.2.2 RaySpec Business Overview
7.2.3 RaySpec Silicon Drift Detector Sensor Major Product Offerings
7.2.4 RaySpec Silicon Drift Detector Sensor Sales and Revenue in Global (2020-2025)
7.2.5 RaySpec Key News & Latest Developments
7.3 Mirion Technologies
7.3.1 Mirion Technologies Company Summary
7.3.2 Mirion Technologies Business Overview
7.3.3 Mirion Technologies Silicon Drift Detector Sensor Major Product Offerings
7.3.4 Mirion Technologies Silicon Drift Detector Sensor Sales and Revenue in Global (2020-2025)
7.3.5 Mirion Technologies Key News & Latest Developments
7.4 PNDetector
7.4.1 PNDetector Company Summary
7.4.2 PNDetector Business Overview
7.4.3 PNDetector Silicon Drift Detector Sensor Major Product Offerings
7.4.4 PNDetector Silicon Drift Detector Sensor Sales and Revenue in Global (2020-2025)
7.4.5 PNDetector Key News & Latest Developments
7.5 Amptek (AMETEK)
7.5.1 Amptek (AMETEK) Company Summary
7.5.2 Amptek (AMETEK) Business Overview
7.5.3 Amptek (AMETEK) Silicon Drift Detector Sensor Major Product Offerings
7.5.4 Amptek (AMETEK) Silicon Drift Detector Sensor Sales and Revenue in Global (2020-2025)
7.5.5 Amptek (AMETEK) Key News & Latest Developments
7.6 Nuchip Photoelectric
7.6.1 Nuchip Photoelectric Company Summary
7.6.2 Nuchip Photoelectric Business Overview
7.6.3 Nuchip Photoelectric Silicon Drift Detector Sensor Major Product Offerings
7.6.4 Nuchip Photoelectric Silicon Drift Detector Sensor Sales and Revenue in Global (2020-2025)
7.6.5 Nuchip Photoelectric Key News & Latest Developments
8 Global Silicon Drift Detector Sensor Production Capacity, Analysis
8.1 Global Silicon Drift Detector Sensor Production Capacity, 2020-2032
8.2 Silicon Drift Detector Sensor Production Capacity of Key Manufacturers in Global Market
8.3 Global Silicon Drift Detector Sensor Production by Region
9 Key Market Trends, Opportunity, Drivers and Restraints
9.1 Market Opportunities & Trends
9.2 Market Drivers
9.3 Market Restraints
10 Silicon Drift Detector Sensor Supply Chain Analysis
10.1 Silicon Drift Detector Sensor Industry Value Chain
10.2 Silicon Drift Detector Sensor Upstream Market
10.3 Silicon Drift Detector Sensor Downstream and Clients
10.4 Marketing Channels Analysis
10.4.1 Marketing Channels
10.4.2 Silicon Drift Detector Sensor Distributors and Sales Agents in Global
11 Conclusion
12 Appendix
12.1 Note
12.2 Examples of Clients
12.3 DisclaimerList of Tables
Table 1. Key Players of Silicon Drift Detector Sensor in Global Market
Table 2. Top Silicon Drift Detector Sensor Players in Global Market, Ranking by Revenue (2024)
Table 3. Global Silicon Drift Detector Sensor Revenue by Companies, (US$, Mn), 2020-2025
Table 4. Global Silicon Drift Detector Sensor Revenue Share by Companies, 2020-2025
Table 5. Global Silicon Drift Detector Sensor Sales by Companies, (K Units), 2020-2025
Table 6. Global Silicon Drift Detector Sensor Sales Share by Companies, 2020-2025
Table 7. Key Manufacturers Silicon Drift Detector Sensor Price (2020-2025) & (US$/Unit)
Table 8. Global Manufacturers Silicon Drift Detector Sensor Product Type
Table 9. List of Global Tier 1 Silicon Drift Detector Sensor Companies, Revenue (US$, Mn) in 2024 and Market Share
Table 10. List of Global Tier 2 and Tier 3 Silicon Drift Detector Sensor Companies, Revenue (US$, Mn) in 2024 and Market Share
Table 11. Segment by Type – Global Silicon Drift Detector Sensor Revenue, (US$, Mn), 2024 & 2032
Table 12. Segment by Type – Global Silicon Drift Detector Sensor Revenue (US$, Mn), 2020-2025
Table 13. Segment by Type – Global Silicon Drift Detector Sensor Revenue (US$, Mn), 2026-2032
Table 14. Segment by Type – Global Silicon Drift Detector Sensor Sales (K Units), 2020-2025
Table 15. Segment by Type – Global Silicon Drift Detector Sensor Sales (K Units), 2026-2032
Table 16. Segment by Application – Global Silicon Drift Detector Sensor Revenue, (US$, Mn), 2024 & 2032
Table 17. Segment by Application – Global Silicon Drift Detector Sensor Revenue, (US$, Mn), 2020-2025
Table 18. Segment by Application – Global Silicon Drift Detector Sensor Revenue, (US$, Mn), 2026-2032
Table 19. Segment by Application – Global Silicon Drift Detector Sensor Sales, (K Units), 2020-2025
Table 20. Segment by Application – Global Silicon Drift Detector Sensor Sales, (K Units), 2026-2032
Table 21. By Region – Global Silicon Drift Detector Sensor Revenue, (US$, Mn), 2025-2032
Table 22. By Region – Global Silicon Drift Detector Sensor Revenue, (US$, Mn), 2020-2025
Table 23. By Region – Global Silicon Drift Detector Sensor Revenue, (US$, Mn), 2026-2032
Table 24. By Region – Global Silicon Drift Detector Sensor Sales, (K Units), 2020-2025
Table 25. By Region – Global Silicon Drift Detector Sensor Sales, (K Units), 2026-2032
Table 26. By Country – North America Silicon Drift Detector Sensor Revenue, (US$, Mn), 2020-2025
Table 27. By Country – North America Silicon Drift Detector Sensor Revenue, (US$, Mn), 2026-2032
Table 28. By Country – North America Silicon Drift Detector Sensor Sales, (K Units), 2020-2025
Table 29. By Country – North America Silicon Drift Detector Sensor Sales, (K Units), 2026-2032
Table 30. By Country – Europe Silicon Drift Detector Sensor Revenue, (US$, Mn), 2020-2025
Table 31. By Country – Europe Silicon Drift Detector Sensor Revenue, (US$, Mn), 2026-2032
Table 32. By Country – Europe Silicon Drift Detector Sensor Sales, (K Units), 2020-2025
Table 33. By Country – Europe Silicon Drift Detector Sensor Sales, (K Units), 2026-2032
Table 34. By Region – Asia Silicon Drift Detector Sensor Revenue, (US$, Mn), 2020-2025
Table 35. By Region – Asia Silicon Drift Detector Sensor Revenue, (US$, Mn), 2026-2032
Table 36. By Region – Asia Silicon Drift Detector Sensor Sales, (K Units), 2020-2025
Table 37. By Region – Asia Silicon Drift Detector Sensor Sales, (K Units), 2026-2032
Table 38. By Country – South America Silicon Drift Detector Sensor Revenue, (US$, Mn), 2020-2025
Table 39. By Country – South America Silicon Drift Detector Sensor Revenue, (US$, Mn), 2026-2032
Table 40. By Country – South America Silicon Drift Detector Sensor Sales, (K Units), 2020-2025
Table 41. By Country – South America Silicon Drift Detector Sensor Sales, (K Units), 2026-2032
Table 42. By Country – Middle East & Africa Silicon Drift Detector Sensor Revenue, (US$, Mn), 2020-2025
Table 43. By Country – Middle East & Africa Silicon Drift Detector Sensor Revenue, (US$, Mn), 2026-2032
Table 44. By Country – Middle East & Africa Silicon Drift Detector Sensor Sales, (K Units), 2020-2025
Table 45. By Country – Middle East & Africa Silicon Drift Detector Sensor Sales, (K Units), 2026-2032
Table 46. Ketek Company Summary
Table 47. Ketek Silicon Drift Detector Sensor Product Offerings
Table 48. Ketek Silicon Drift Detector Sensor Sales (K Units), Revenue (US$, Mn) and Average Price (US$/Unit) & (2020-2025)
Table 49. Ketek Key News & Latest Developments
Table 50. RaySpec Company Summary
Table 51. RaySpec Silicon Drift Detector Sensor Product Offerings
Table 52. RaySpec Silicon Drift Detector Sensor Sales (K Units), Revenue (US$, Mn) and Average Price (US$/Unit) & (2020-2025)
Table 53. RaySpec Key News & Latest Developments
Table 54. Mirion Technologies Company Summary
Table 55. Mirion Technologies Silicon Drift Detector Sensor Product Offerings
Table 56. Mirion Technologies Silicon Drift Detector Sensor Sales (K Units), Revenue (US$, Mn) and Average Price (US$/Unit) & (2020-2025)
Table 57. Mirion Technologies Key News & Latest Developments
Table 58. PNDetector Company Summary
Table 59. PNDetector Silicon Drift Detector Sensor Product Offerings
Table 60. PNDetector Silicon Drift Detector Sensor Sales (K Units), Revenue (US$, Mn) and Average Price (US$/Unit) & (2020-2025)
Table 61. PNDetector Key News & Latest Developments
Table 62. Amptek (AMETEK) Company Summary
Table 63. Amptek (AMETEK) Silicon Drift Detector Sensor Product Offerings
Table 64. Amptek (AMETEK) Silicon Drift Detector Sensor Sales (K Units), Revenue (US$, Mn) and Average Price (US$/Unit) & (2020-2025)
Table 65. Amptek (AMETEK) Key News & Latest Developments
Table 66. Nuchip Photoelectric Company Summary
Table 67. Nuchip Photoelectric Silicon Drift Detector Sensor Product Offerings
Table 68. Nuchip Photoelectric Silicon Drift Detector Sensor Sales (K Units), Revenue (US$, Mn) and Average Price (US$/Unit) & (2020-2025)
Table 69. Nuchip Photoelectric Key News & Latest Developments
Table 70. Silicon Drift Detector Sensor Capacity of Key Manufacturers in Global Market, 2023-2025 (K Units)
Table 71. Global Silicon Drift Detector Sensor Capacity Market Share of Key Manufacturers, 2023-2025
Table 72. Global Silicon Drift Detector Sensor Production by Region, 2020-2025 (K Units)
Table 73. Global Silicon Drift Detector Sensor Production by Region, 2026-2032 (K Units)
Table 74. Silicon Drift Detector Sensor Market Opportunities & Trends in Global Market
Table 75. Silicon Drift Detector Sensor Market Drivers in Global Market
Table 76. Silicon Drift Detector Sensor Market Restraints in Global Market
Table 77. Silicon Drift Detector Sensor Raw Materials
Table 78. Silicon Drift Detector Sensor Raw Materials Suppliers in Global Market
Table 79. Typical Silicon Drift Detector Sensor Downstream
Table 80. Silicon Drift Detector Sensor Downstream Clients in Global Market
Table 81. Silicon Drift Detector Sensor Distributors and Sales Agents in Global Market

List of Figures
Figure 1. Silicon Drift Detector Sensor Product Picture
Figure 2. Silicon Drift Detector Sensor Segment by Type in 2024
Figure 3. Silicon Drift Detector Sensor Segment by Application in 2024
Figure 4. Global Silicon Drift Detector Sensor Market Overview: 2024
Figure 5. Key Caveats
Figure 6. Global Silicon Drift Detector Sensor Market Size: 2024 VS 2032 (US$, Mn)
Figure 7. Global Silicon Drift Detector Sensor Revenue: 2020-2032 (US$, Mn)
Figure 8. Silicon Drift Detector Sensor Sales in Global Market: 2020-2032 (K Units)
Figure 9. The Top 3 and 5 Players Market Share by Silicon Drift Detector Sensor Revenue in 2024
Figure 10. Segment by Type – Global Silicon Drift Detector Sensor Revenue, (US$, Mn), 2024 & 2032
Figure 11. Segment by Type – Global Silicon Drift Detector Sensor Revenue Market Share, 2020-2032
Figure 12. Segment by Type – Global Silicon Drift Detector Sensor Sales Market Share, 2020-2032
Figure 13. Segment by Type – Global Silicon Drift Detector Sensor Price (US$/Unit), 2020-2032
Figure 14. Segment by Application – Global Silicon Drift Detector Sensor Revenue, (US$, Mn), 2024 & 2032
Figure 15. Segment by Application – Global Silicon Drift Detector Sensor Revenue Market Share, 2020-2032
Figure 16. Segment by Application – Global Silicon Drift Detector Sensor Sales Market Share, 2020-2032
Figure 17. Segment by Application -Global Silicon Drift Detector Sensor Price (US$/Unit), 2020-2032
Figure 18. By Region – Global Silicon Drift Detector Sensor Revenue, (US$, Mn), 2025 & 2032
Figure 19. By Region – Global Silicon Drift Detector Sensor Revenue Market Share, 2020 VS 2024 VS 2032
Figure 20. By Region – Global Silicon Drift Detector Sensor Revenue Market Share, 2020-2032
Figure 21. By Region – Global Silicon Drift Detector Sensor Sales Market Share, 2020-2032
Figure 22. By Country – North America Silicon Drift Detector Sensor Revenue Market Share, 2020-2032
Figure 23. By Country – North America Silicon Drift Detector Sensor Sales Market Share, 2020-2032
Figure 24. United States Silicon Drift Detector Sensor Revenue, (US$, Mn), 2020-2032
Figure 25. Canada Silicon Drift Detector Sensor Revenue, (US$, Mn), 2020-2032
Figure 26. Mexico Silicon Drift Detector Sensor Revenue, (US$, Mn), 2020-2032
Figure 27. By Country – Europe Silicon Drift Detector Sensor Revenue Market Share, 2020-2032
Figure 28. By Country – Europe Silicon Drift Detector Sensor Sales Market Share, 2020-2032
Figure 29. Germany Silicon Drift Detector Sensor Revenue, (US$, Mn), 2020-2032
Figure 30. France Silicon Drift Detector Sensor Revenue, (US$, Mn), 2020-2032
Figure 31. U.K. Silicon Drift Detector Sensor Revenue, (US$, Mn), 2020-2032
Figure 32. Italy Silicon Drift Detector Sensor Revenue, (US$, Mn), 2020-2032
Figure 33. Russia Silicon Drift Detector Sensor Revenue, (US$, Mn), 2020-2032
Figure 34. Nordic Countries Silicon Drift Detector Sensor Revenue, (US$, Mn), 2020-2032
Figure 35. Benelux Silicon Drift Detector Sensor Revenue, (US$, Mn), 2020-2032
Figure 36. By Region – Asia Silicon Drift Detector Sensor Revenue Market Share, 2020-2032
Figure 37. By Region – Asia Silicon Drift Detector Sensor Sales Market Share, 2020-2032
Figure 38. China Silicon Drift Detector Sensor Revenue, (US$, Mn), 2020-2032
Figure 39. Japan Silicon Drift Detector Sensor Revenue, (US$, Mn), 2020-2032
Figure 40. South Korea Silicon Drift Detector Sensor Revenue, (US$, Mn), 2020-2032
Figure 41. Southeast Asia Silicon Drift Detector Sensor Revenue, (US$, Mn), 2020-2032
Figure 42. India Silicon Drift Detector Sensor Revenue, (US$, Mn), 2020-2032
Figure 43. By Country – South America Silicon Drift Detector Sensor Revenue Market Share, 2020-2032
Figure 44. By Country – South America Silicon Drift Detector Sensor Sales, Market Share, 2020-2032
Figure 45. Brazil Silicon Drift Detector Sensor Revenue, (US$, Mn), 2020-2032
Figure 46. Argentina Silicon Drift Detector Sensor Revenue, (US$, Mn), 2020-2032
Figure 47. By Country – Middle East & Africa Silicon Drift Detector Sensor Revenue, Market Share, 2020-2032
Figure 48. By Country – Middle East & Africa Silicon Drift Detector Sensor Sales, Market Share, 2020-2032
Figure 49. Turkey Silicon Drift Detector Sensor Revenue, (US$, Mn), 2020-2032
Figure 50. Israel Silicon Drift Detector Sensor Revenue, (US$, Mn), 2020-2032
Figure 51. Saudi Arabia Silicon Drift Detector Sensor Revenue, (US$, Mn), 2020-2032
Figure 52. UAE Silicon Drift Detector Sensor Revenue, (US$, Mn), 2020-2032
Figure 53. Global Silicon Drift Detector Sensor Production Capacity (K Units), 2020-2032
Figure 54. The Percentage of Production Silicon Drift Detector Sensor by Region, 2024 VS 2032
Figure 55. Silicon Drift Detector Sensor Industry Value Chain
Figure 56. Marketing Channels