
MARKET INSIGHTS
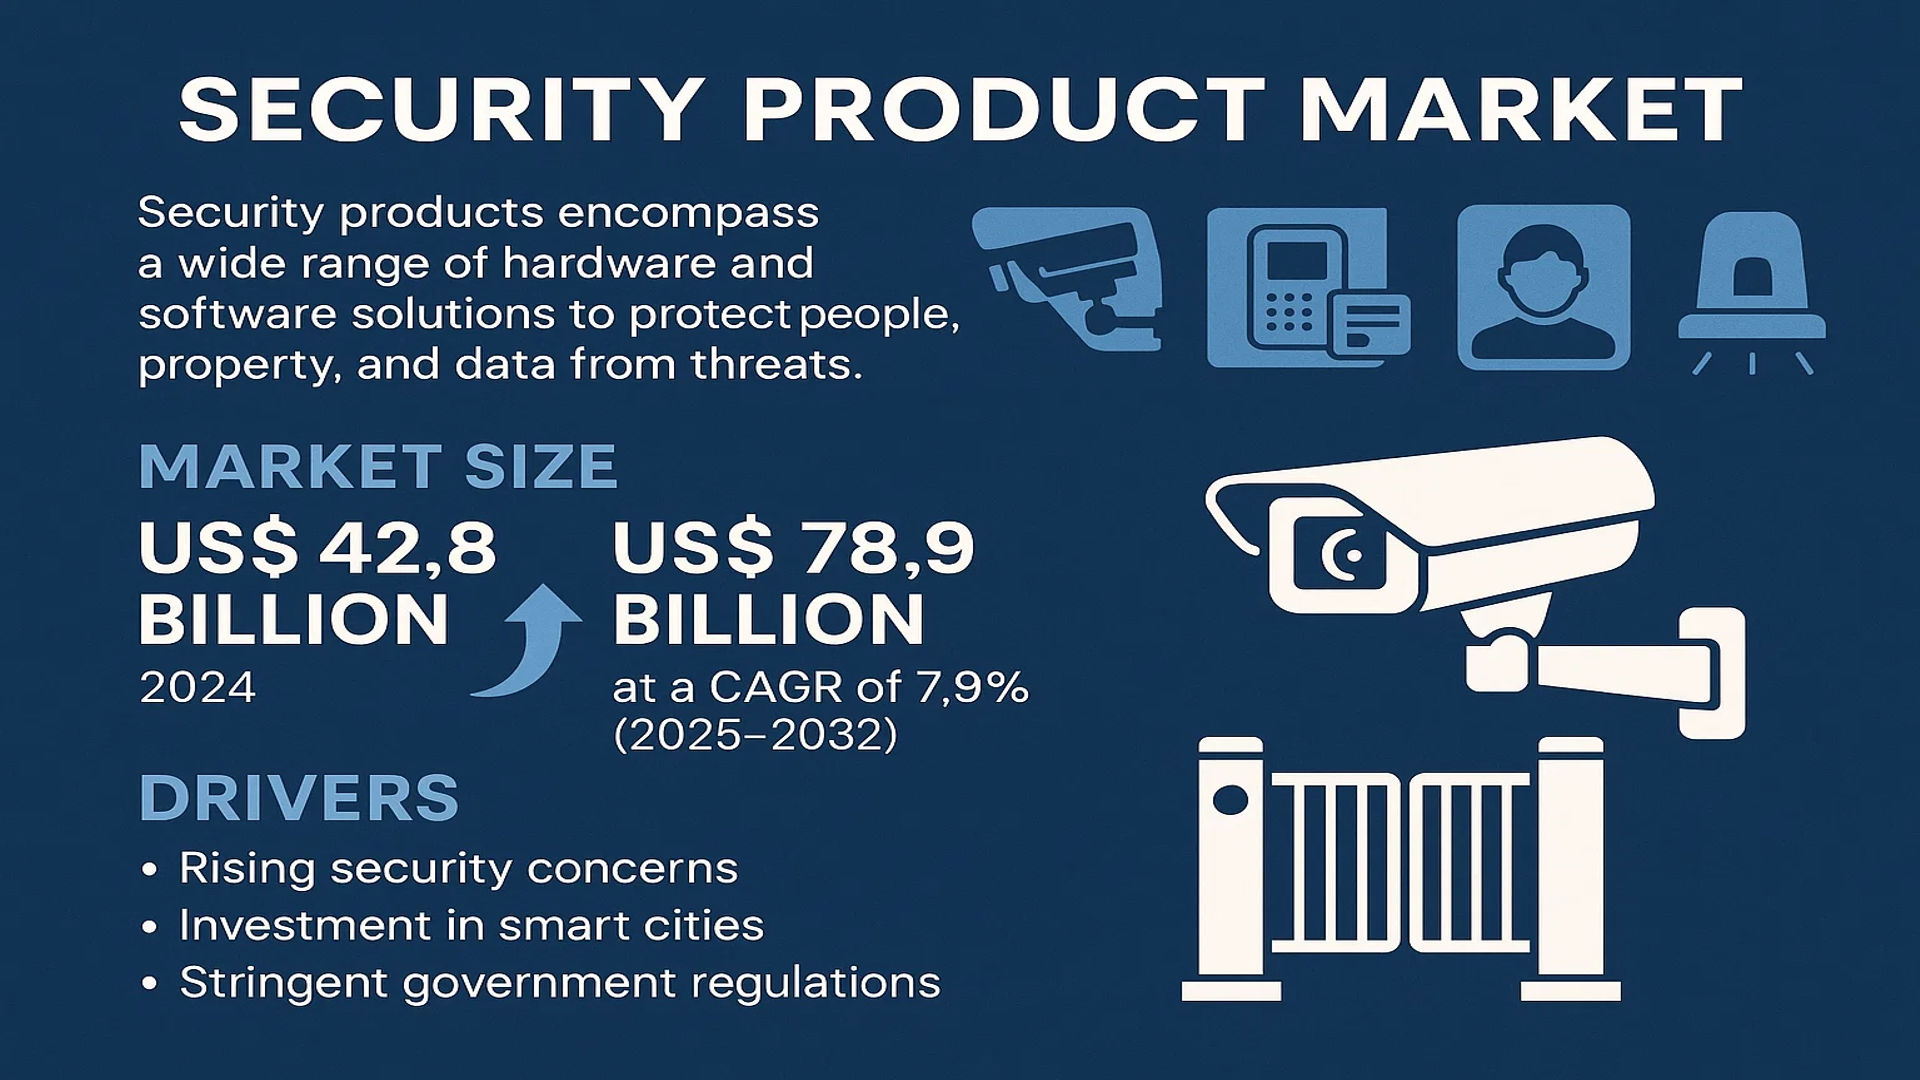
The global Security Product Market size was valued at US$ 42.8 billion in 2024 and is projected to reach US$ 78.9 billion by 2032, at a CAGR of 7.9% during the forecast period 2025-2032.
Security products encompass a wide range of hardware and software solutions designed to protect people, property, and data from threats. These products facilitate the monitoring, detection, and prevention of unauthorized access or malicious activities, encompassing various systems such as surveillance cameras, access control systems, intrusion detection systems, and alarm systems. The product portfolio includes security cameras, smart access control systems, biometric scanners, fire alarms, and perimeter security solutions.
The market is experiencing robust growth driven by several factors, including rising security concerns globally, increased investment in smart city infrastructure, and stringent government regulations for public safety. Furthermore, the growing adoption of Internet of Things (IoT) and artificial intelligence (AI) in security systems is significantly contributing to market expansion. In Japan, for instance, key players like Panasonic hold a significant market share of over 10%, with SONY and HITACHI also being major contributors. The increasing incidence of security breaches and the subsequent demand for advanced, integrated security solutions are expected to continue fueling market growth throughout the forecast period.
MARKET DYNAMICS
MARKET DRIVERS
Rising Security Threats and Increasing Crime Rates to Propel Market Growth
The global security product market is experiencing robust growth driven by escalating security concerns across commercial, residential, and infrastructure sectors. Rising crime rates worldwide have created an urgent need for advanced security solutions, with reported incidents increasing by approximately 15% in urban centers over the past five years. This trend is particularly pronounced in emerging economies where urbanization rates exceed 65%, creating dense population centers that require sophisticated security infrastructure. The market has responded with innovative solutions including AI-powered surveillance systems, biometric access controls, and integrated security platforms that provide comprehensive protection. Furthermore, government initiatives mandating enhanced security measures in public spaces and critical infrastructure have created substantial demand, with public sector investments growing at an annual rate of nearly 12%.
Technological Advancements and IoT Integration to Accelerate Market Expansion
Technological innovation represents a fundamental driver for the security product market, with the integration of Internet of Things (IoT) technologies revolutionizing traditional security systems. Modern security solutions now incorporate cloud computing, artificial intelligence, and machine learning algorithms that enable predictive analytics and real-time threat detection. The adoption of smart security devices has increased by over 40% annually, driven by their ability to provide remote monitoring, automated alerts, and seamless integration with other smart home or building systems. Recent developments include edge computing capabilities that process data locally, reducing latency and enhancing response times. The convergence of physical and cybersecurity has also created new product categories, with hybrid security systems gaining significant market traction.
Growing Smart City Initiatives and Infrastructure Development to Fuel Demand
Global smart city initiatives are creating substantial opportunities for security product manufacturers, with projected investments exceeding $2.5 trillion by 2025. These urban development projects incorporate comprehensive security ecosystems that include surveillance networks, access control systems, and emergency response coordination platforms. The integration of security infrastructure with city management systems enables coordinated responses to incidents and efficient resource allocation. Additionally, major infrastructure projects worldwide are incorporating advanced security measures as standard components, driven by regulatory requirements and insurance considerations. The transportation sector alone accounts for approximately 30% of security product demand, with airports, railways, and ports implementing multi-layered security solutions.
MARKET CHALLENGES
High Implementation and Maintenance Costs to Constrain Market Penetration
The security product market faces significant challenges related to the substantial costs associated with implementing and maintaining advanced security systems. Comprehensive security solutions require considerable capital investment, with enterprise-level systems often costing millions of dollars to install and configure. This financial barrier is particularly pronounced in price-sensitive markets and among small to medium-sized enterprises, where security budgets may be limited. The ongoing maintenance, software updates, and potential system upgrades create additional financial burdens, with annual maintenance costs typically representing 15-20% of the initial investment. These expenses can deter potential customers from adopting the latest security technologies, instead opting for less comprehensive or outdated solutions.
Other Challenges
Cybersecurity Vulnerabilities
The increasing connectivity of security products creates significant cybersecurity risks, with networked devices potentially serving as entry points for malicious actors. Instances of security system breaches have increased by over 200% in the past three years, highlighting the vulnerability of interconnected security ecosystems. These concerns are particularly acute in critical infrastructure applications where security failures could have catastrophic consequences.
Privacy Concerns and Regulatory Compliance
Growing privacy regulations worldwide present challenges for security product manufacturers and users. Regulations governing data collection, storage, and usage vary significantly across jurisdictions, creating compliance complexities for multinational deployments. Public concerns about surveillance and data privacy have also impacted market acceptance in certain regions.
MARKET RESTRAINTS
Technical Complexity and Integration Challenges to Hinder Market Growth
The increasing technical sophistication of security products presents significant integration challenges that restrain market growth. Modern security systems often require compatibility with existing infrastructure, legacy systems, and various technology platforms, creating complex implementation scenarios. The integration process can be time-consuming and technically demanding, requiring specialized expertise that may not be readily available. Additionally, interoperability issues between different manufacturers’ products can create system vulnerabilities and reduce overall effectiveness. These technical challenges are particularly evident in large-scale deployments where multiple security subsystems must work together seamlessly.
Furthermore, the rapid pace of technological advancement creates obsolescence concerns, as security products may become outdated within relatively short timeframes. This rapid evolution necessitates frequent system updates and replacements, adding to the total cost of ownership and creating implementation hesitancy among potential customers.
MARKET OPPORTUNITIES
Emerging Markets and Untapped Applications to Create Substantial Growth Opportunities
Developing regions represent significant growth opportunities for the security product market, with urbanization rates exceeding 3% annually in many emerging economies. These markets are experiencing rapid infrastructure development and increasing security awareness, creating demand for both basic and advanced security solutions. The middle-class expansion in these regions, projected to reach nearly 5.5 billion people by 2030, is driving residential security product adoption as homeowners seek to protect their properties and families.
Additionally, new application areas are emerging beyond traditional security roles, including health and safety monitoring, environmental protection, and operational efficiency applications. The integration of security systems with business intelligence platforms creates additional value propositions, enabling organizations to derive operational insights from security data. These expanded use cases open new market segments and revenue streams for security product manufacturers.
The convergence of physical and logical security systems also presents significant opportunities, with unified security platforms gaining market acceptance. These integrated solutions provide comprehensive protection across both physical and digital domains, addressing modern security challenges holistically.
SECURITY PRODUCT MARKET TRENDS
Integration of Artificial Intelligence and Machine Learning to Emerge as a Dominant Trend
The global security product market is undergoing a profound transformation driven by the widespread integration of Artificial Intelligence (AI) and Machine Learning (ML). These technologies are moving beyond basic motion detection to enable advanced capabilities like behavioral analytics, anomaly detection, and predictive threat assessment. Modern AI-powered security cameras can now differentiate between a human, vehicle, and animal with an accuracy exceeding 99%, drastically reducing false alarms and improving response efficiency. Furthermore, machine learning algorithms continuously analyze vast datasets from connected devices, allowing security systems to learn normal patterns of activity and instantly flag deviations that could indicate a security breach. This shift towards intelligent, data-driven security is not just enhancing performance but is also creating new service-based revenue models, such as Security-as-a-Service (SaaS), which is projected to be a significant growth vector. The demand for these smart, automated solutions is a primary catalyst for the market’s projected growth from US$ 42.8 billion in 2024 to US$ 78.9 billion by 2032.
Other Trends
Convergence of Physical and Cybersecurity
As physical security devices become increasingly connected to corporate networks and the internet, the line between physical and cybersecurity has blurred, creating a critical market trend. This convergence is driving demand for integrated security solutions that protect both the physical perimeter and the digital data flowing from IoT devices like IP cameras and smart access control systems. The rising frequency of cyber-attacks targeting IoT devices, with millions of attempted breaches recorded annually, has made robust cybersecurity features a non-negotiable requirement in modern security products. Manufacturers are now embedding advanced encryption protocols, secure boot capabilities, and regular firmware update mechanisms directly into hardware. This holistic approach to security is becoming a key differentiator for end-users in the commercial and infrastructure sectors, who are prioritizing vendors that can offer a unified defense strategy against multifaceted threats.
Rapid Adoption of Cloud-Based Solutions and Hybrid Models
The shift towards cloud-based management platforms is accelerating, fundamentally changing how security systems are deployed and operated. This trend offers significant advantages, including remote accessibility, scalable storage, and reduced upfront capital expenditure on on-premises servers. The hybrid cloud model, which combines local storage for immediate, high-bandwidth recording with cloud backup for redundancy and remote viewing, is particularly gaining traction. This model effectively balances performance needs with cost considerations and ensures business continuity. Growth in this segment is further fueled by the expansion of smart city projects and critical infrastructure upgrades globally, where centralized, cloud-managed security platforms are essential for monitoring distributed assets. The ability to leverage cloud analytics for city-wide surveillance or multi-site commercial operations is creating substantial demand for sophisticated, networked security products that seamlessly integrate with these platforms.
COMPETITIVE LANDSCAPE
Key Industry Players
Companies Strive to Strengthen their Product Portfolio to Sustain Competition
The global security product market exhibits a semi-consolidated structure, characterized by a dynamic mix of multinational corporations, specialized regional players, and emerging technology firms. Intense competition is fueled by rapid technological advancements, particularly in AI integration, IoT connectivity, and cybersecurity features. Market leaders leverage their extensive R&D capabilities and global distribution networks to maintain dominance, while smaller players often compete through niche specialization and cost leadership strategies.
Panasonic Corporation stands as the global market leader, commanding a significant share exceeding 10% as of 2024. This dominance is largely attributed to its comprehensive and technologically advanced product portfolio, which spans high-definition surveillance systems, advanced access control solutions, and integrated security platforms. Their strong brand recognition and extensive global supply chain, particularly across North America, Europe, and Asia-Pacific, further solidify their top position.
SONY Corporation and Hitachi Ltd. also hold substantial market shares, collectively forming the top three manufacturers globally. Sony’s strength lies in its superior imaging sensor technology, which is critical for high-performance security cameras, while Hitachi leverages its expertise in infrastructure solutions to provide large-scale, integrated security systems for commercial and public applications.
Furthermore, these leading companies are aggressively pursuing growth through strategic initiatives. Continuous investment in research and development is paramount, focusing on areas like artificial intelligence for behavioral analytics, cloud-based security management, and cybersecurity hardening for connected devices. Geographical expansion into emerging markets and a consistent stream of innovative product launches are expected to be key drivers for market share growth throughout the forecast period up to 2032.
Meanwhile, other significant players like FUJIFILM Holdings Corporation and AIPHONE Co., Ltd. are strengthening their positions through targeted strategies. Fujifilm is capitalizing on its optical and imaging heritage to develop specialized surveillance solutions, while Aiphone excels in the intercom and access control segment. Their efforts in forming strategic partnerships, engaging in mergers and acquisitions, and tailoring products for specific vertical markets ensure their continued relevance and growth within the competitive landscape.
List of Key Security Product Companies Profiled
- Panasonic Corporation (Japan)
- SONY Corporation (Japan)
- Hitachi Ltd. (Japan)
- FUJIFILM Holdings Corporation (Japan)
- AIPHONE Co., Ltd. (Japan)
Segment Analysis:
By Type
Security Camera Segment Dominates the Market Due to Rising Demand for Surveillance and Public Safety
The market is segmented based on type into:
- Security Camera
- Subtypes: Dome, Bullet, PTZ, and others
- Smart Access Control
- Subtypes: Biometric, Card-based, and others
- Intrusion Detection Systems
- Fire Protection Systems
- Others
By Application
Commercial Segment Leads Due to High Adoption in Corporate Security and Retail Loss Prevention
The market is segmented based on application into:
- Infrastructure
- Commercial
- Residential
- Government
- Industrial
Regional Analysis: Security Product Market
Asia-Pacific
The Asia-Pacific region dominates the global security product market, accounting for over 40% of worldwide revenue. This leadership position is driven by massive urbanization, government-led smart city initiatives, and rising security consciousness. China, the world’s largest market for security cameras, continues its extensive public and private surveillance network expansion. Japan remains a hub for high-quality manufacturing, with established players like Panasonic, Sony, and Hitachi leading in technological innovation for both domestic use and export. India represents one of the fastest-growing markets globally, fueled by infrastructure development and increasing commercial real estate. While cost-competitiveness drives demand for mid-range products, there is a noticeable and growing premium segment adopting AI-powered analytics and integrated smart access systems.
North America
Characterized by high technological adoption and stringent security regulations, the North American market is a leader in innovation. The United States is the largest regional market, driven by demand across commercial, residential, and critical infrastructure sectors. Recent developments include a significant shift towards cloud-based Video Surveillance as a Service (VSaaS) and the integration of cybersecurity measures with physical security products. The commercial segment, particularly in retail and corporate environments, heavily invests in advanced access control and analytics-driven surveillance to mitigate risks and enhance operational efficiency. Furthermore, rising concerns over personal safety are propelling robust growth in the residential security segment, with a strong preference for smart, connected DIY systems.
Europe
The European market is strongly influenced by robust data privacy regulations, including the General Data Protection Regulation (GDPR), which shapes product development and deployment. This has accelerated the adoption of privacy-centric security solutions, such as edge computing and on-premise storage options. Western European nations, including Germany, the UK, and France, have mature markets with a focus on upgrading existing systems to more advanced, networked solutions. The Eastern European market is experiencing growth, driven by new commercial construction and increasing public sector investment. A key trend across the region is the convergence of physical and information security, leading to demand for products that offer strong encryption and cyber-hardened features.
South America
The security product market in South America is growing steadily, though it faces challenges related to economic volatility and currency fluctuations. Brazil is the largest market in the region, driven by high crime rates in urban centers which spur demand for residential and commercial security systems. There is a noticeable price sensitivity, which makes the market highly competitive and favors value-oriented products. However, in major metropolitan areas and within the industrial sector, there is a growing adoption of more sophisticated integrated systems. Political instability in certain countries can impact public sector investments, making growth somewhat inconsistent, though the long-term outlook remains positive due to fundamental security needs.
Middle East & Africa
This is an emerging market with significant potential, largely driven by large-scale infrastructure projects, particularly in the Gulf Cooperation Council (GCC) countries. Governments in the UAE and Saudi Arabia are major procurers of high-end security solutions for smart city projects, critical infrastructure protection, and large-scale events. The market is bifurcated, with a high-end segment demanding the latest technology and a more price-sensitive segment in other parts of the region. South Africa has a well-developed market due to its high security needs, acting as a gateway for products into the rest of the continent. While growth is promising, it can be hampered by geopolitical tensions and reliance on oil-based economies.
Report Scope
This market research report provides a comprehensive analysis of the global and regional Security Product markets, covering the forecast period 2025–2032. It offers detailed insights into market dynamics, technological advancements, competitive landscape, and key trends shaping the industry.
Key focus areas of the report include:
- Market Size & Forecast: Historical data and future projections for revenue, unit shipments, and market value across major regions and segments.
- Segmentation Analysis: Detailed breakdown by product type, technology, application, and end-user industry to identify high-growth segments and investment opportunities.
- Regional Outlook: Insights into market performance across North America, Europe, Asia-Pacific, Latin America, and the Middle East & Africa, including country-level analysis where relevant.
- Competitive Landscape: Profiles of leading market participants, including their product offerings, R&D focus, manufacturing capacity, pricing strategies, and recent developments such as mergers, acquisitions, and partnerships.
- Technology Trends & Innovation: Assessment of emerging technologies, integration of AI/IoT, semiconductor design trends, fabrication techniques, and evolving industry standards.
- Market Drivers & Restraints: Evaluation of factors driving market growth along with challenges, supply chain constraints, regulatory issues, and market-entry barriers.
- Stakeholder Analysis: Insights for component suppliers, OEMs, system integrators, investors, and policymakers regarding the evolving ecosystem and strategic opportunities.
Primary and secondary research methods are employed, including interviews with industry experts, data from verified sources, and real-time market intelligence to ensure the accuracy and reliability of the insights presented.
FREQUENTLY ASKED QUESTIONS:
What is the current market size of Global Security Product Market?
-> Security Product Market size was valued at US$ 42.8 billion in 2024 and is projected to reach US$ 78.9 billion by 2032, at a CAGR of 7.9% during the forecast period 2025-2032.
Which key companies operate in Global Security Product Market?
-> Key players include Panasonic, SONY, HITACHI, FUJIFILM, and AIPHONE, among others.
What are the key growth drivers?
-> Key growth drivers include rising security concerns, urbanization, technological advancements, and increasing infrastructure investments.
Which region dominates the market?
-> Asia-Pacific is the fastest-growing region, while North America remains a dominant market.
What are the emerging trends?
-> Emerging trends include AI-powered surveillance, cloud-based security solutions, IoT integration, and biometric access control systems.

Get Sample Report PDF for Exclusive Insights
Report Sample Includes
- Table of Contents
- List of Tables & Figures
- Charts, Research Methodology, and more...
 Download Sample Report PDF



