Rugged Smartphone and Tablets Market, Size, Trends, Business Strategies 2025-2032

Global Rugged Smartphone and Tablets market size was estimated at USD 1371 million in 2023 and is projected to reach USD 2130.52 million by 2030, CAGR of 6.50%

PDF Icon Download Sample Report PDF
  • Quick Dispatch

    All Orders

  • Secure Payment

    100% Secure Payment

Price range: $1,500.00 through $4,250.00

Clear

Rugged Smartphone and Tablets Market Overview

The rugged smartphone and tablet market encompasses devices specifically designed to withstand harsh environments, extreme temperatures, water exposure, dust, and physical shocks. These devices are essential for sectors such as construction, military, field services, manufacturing, and emergency services, where reliability in demanding conditions is a priority.

This report provides a deep insight into the global Rugged Smartphone and Tablets market covering all its essential aspects. This ranges from a macro overview of the market to micro details of the market size, competitive landscape, development trend, niche market, key market drivers and challenges, SWOT analysis, value chain analysis, etc.

The analysis helps the reader to shape the competition within the industries and strategies for the competitive environment to enhance the potential profit. Furthermore, it provides a simple framework for evaluating and accessing the position of the business organization. The report structure also focuses on the competitive landscape of the Global Rugged Smartphone and Tablets Market, this report introduces in detail the market share, market performance, product situation, operation situation, etc. of the main players, which helps the readers in the industry to identify the main competitors and deeply understand the competition pattern of the market.
In a word, this report is a must-read for industry players, investors, researchers, consultants, business strategists, and all those who have any kind of stake or are planning to foray into the Rugged Smartphone and Tablets market in any manner.

Rugged Smartphone and Tablets Market Analysis:

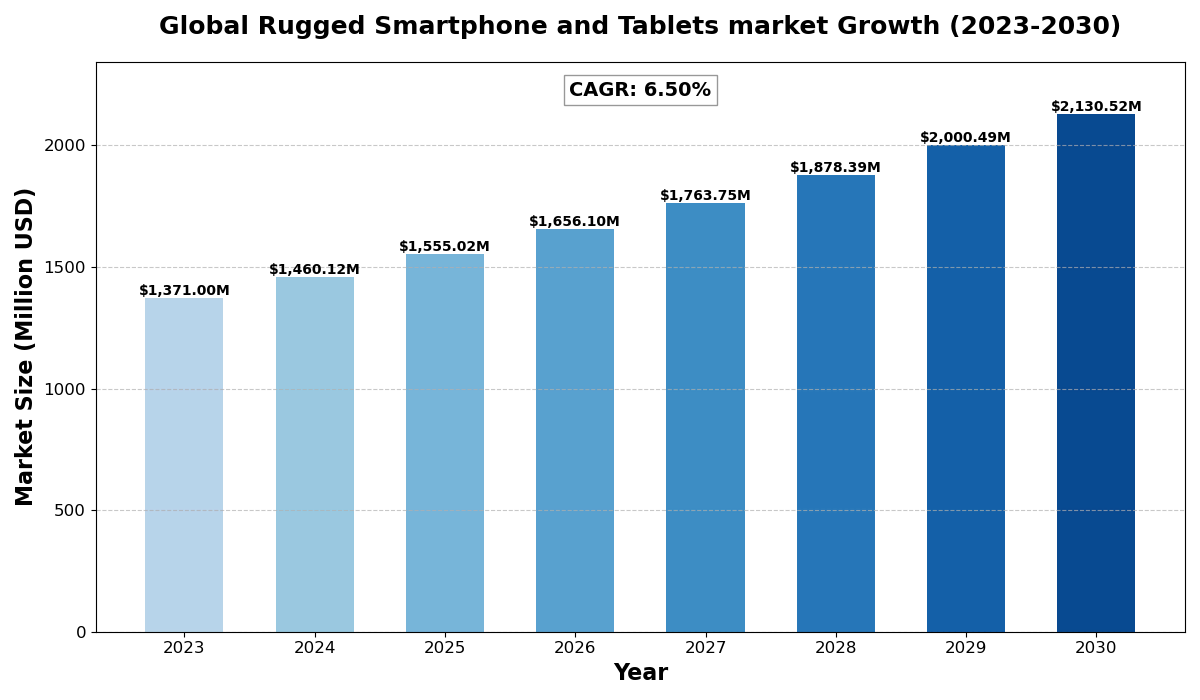
The global Rugged Smartphone and Tablets market size was estimated at USD 1371 million in 2023 and is projected to reach USD 2130.52 million by 2030, exhibiting a CAGR of 6.50% during the forecast period.

North America Rugged Smartphone and Tablets market size was USD 357.24 million in 2023, at a CAGR of 5.57% during the forecast period of 2025 through 2030.

Rugged Smartphone and Tablets Key Market Trends  :

  1. Growing Demand for Durable Devices – Industries such as construction, logistics, and defense are increasingly adopting rugged smartphones and tablets for their durability and resistance to harsh conditions.

  2. Integration of 5G and AI Capabilities – The adoption of 5G technology and AI-powered features is enhancing connectivity, performance, and real-time data processing in rugged devices.

  3. Expansion in Military and Defense Sectors – Rugged devices are being widely used in military operations for secure communication, navigation, and tactical planning.

  4. Advancements in Battery Life and Energy Efficiency – Improvements in battery technology are enabling rugged smartphones and tablets to operate longer in remote and demanding environments.

  5. Increased Adoption in Outdoor and Industrial Applications – The rise of adventure tourism, fieldwork, and industrial automation is driving the need for reliable, shockproof, and weather-resistant mobile devices.

Rugged Smartphone and Tablets Market Regional Analysis :

semi insight

  • North America:Strong demand driven by EVs, 5G infrastructure, and renewable energy, with the U.S. leading the market.
  • Europe:Growth fueled by automotive electrification, renewable energy, and strong regulatory support, with Germany as a key player.
  • Asia-Pacific:Dominates the market due to large-scale manufacturing in China and Japan, with growing demand from EVs, 5G, and semiconductors.
  • South America:Emerging market, driven by renewable energy and EV adoption, with Brazil leading growth.
  • Middle East & Africa:Gradual growth, mainly due to investments in renewable energy and EV infrastructure, with Saudi Arabia and UAE as key contributors.

Rugged Smartphone and Tablets Market Segmentation

The research report includes specific segments by region (country), manufacturers, Type, and Application. Market segmentation creates subsets of a market based on product type, end-user or application, Geographic, and other factors. By understanding the market segments, the decision-maker can leverage this targeting in the product, sales, and marketing strategies. Market segments can power your product development cycles by informing how you create product offerings for different segments.

Key Company

  • Silfex Inc.
  • Hana Materials Inc.
  • Worldex Industry & Trading Co.
  • Ltd.
  • SK Enpulse
  • Mitsubishi Materials
  • CoorsTek
  • SiFusion
  • KC Parts Tech.
  • Ltd.
  • RS Technologies Co.
  • Ltd.
  • ThinkonSemi (Fujian Dynafine)
  • Techno Quartz Inc.
  • Chongqing Genori Technology Co.
  • Ltd
  • Ruijiexinsheng Electronic Technology (WuXi) Co.
  • Ltd
  • One Semicon Co.,Ltd
  • Coma Technology Co.
  • Ltd.
  • BC&C
  • K-max
  • DS Techno
  • Ronda Semiconductor
  • SICREAT(Suzhou) Semitech Co.,Ltd.

Market Segmentation (by Type)

  • Silicon Electrodes
  • Silicon Rings

Market Segmentation (by Application)

  • OEM
  • Wafer FAB

Drivers

  • Rising Demand from Industrial Sectors – Industries such as oil & gas, mining, and emergency services rely on rugged devices for their reliability in extreme conditions.
  • Growth in Remote and Field Work Applications – Workers in remote locations, including first responders and utility workers, require durable mobile solutions.
  • Advancements in Waterproof and Drop-Resistant Technologies – Manufacturers are developing more robust materials and designs to enhance the durability of rugged devices.

Restraints

  • High Cost of Rugged Devices – Rugged smartphones and tablets tend to be more expensive than regular consumer devices, limiting their adoption in cost-sensitive markets.
  • Limited Availability of Rugged Consumer Models – While rugged devices are common in industrial and military sectors, they have a smaller market presence among general consumers.
  • Bulkier and Heavier Designs – Compared to standard smartphones and tablets, rugged devices are often bulkier, making them less attractive for everyday use.

Opportunities

  • Adoption in Smart Cities and Infrastructure Projects – The deployment of rugged devices for infrastructure monitoring and public safety applications is expected to rise.
  • Growth in Outdoor Recreation Market – The increasing popularity of adventure sports and extreme outdoor activities is driving demand for rugged mobile devices.
  • Innovations in Rugged Device Design – Lighter and more ergonomic rugged devices with enhanced usability features can attract new customer segments.

Challenges

  • Limited Brand Recognition – Apart from a few well-known brands, many rugged device manufacturers struggle with market penetration and consumer awareness.
  • Compatibility with Consumer Apps and Ecosystems – Some rugged devices may lack compatibility with mainstream applications and services, limiting their appeal.
  • Supply Chain Disruptions – Global semiconductor shortages and disruptions in raw material supply can impact the production of rugged smartphones and tablets.

Key Benefits of This Market Research:

  • Industry drivers, restraints, and opportunities covered in the study
  • Neutral perspective on the market performance
  • Recent industry trends and developments
  • Competitive landscape & strategies of key players
  • Potential & niche segments and regions exhibiting promising growth covered
  • Historical, current, and projected market size, in terms of value
  • In-depth analysis of the Rugged Smartphone and Tablets Market
  • Overview of the regional outlook of the Rugged Smartphone and Tablets Market:

Key Reasons to Buy this Report:

  • Access to date statistics compiled by our researchers. These provide you with historical and forecast data, which is analyzed to tell you why your market is set to change
  • This enables you to anticipate market changes to remain ahead of your competitors
  • You will be able to copy data from the Excel spreadsheet straight into your marketing plans, business presentations, or other strategic documents
  • The concise analysis, clear graph, and table format will enable you to pinpoint the information you require quickly
  • Provision of market value data for each segment and sub-segment
  • Indicates the region and segment that is expected to witness the fastest growth as well as to dominate the market
  • Provides insight into the market through Value Chain
  • Market dynamics scenario, along with growth opportunities of the market in the years to come
  • 6-month post-sales analyst support

Customization of the Report
In case of any queries or customization requirements, please connect with our sales team, who will ensure that your requirements are met.

FAQs

What is driving the growth of the rugged smartphone and tablets market?
The market is driven by rising industrial demand, the need for durable mobile devices in extreme conditions, and advancements in waterproof and shock-resistant technology.


Who are the key players in the rugged smartphone and tablets industry?
Leading companies include Samsung, Kyocera, Caterpillar, Doogee, Crosscall, Sonim, RugGear, and Juniper Systems.


What are the main applications of rugged smartphones and tablets?
These devices are used in outdoor sports, industrial fieldwork, emergency response, military operations, and construction.


What are the challenges faced by the rugged smartphone and tablets market?
Challenges include high device costs, limited consumer adoption, bulkier designs, and supply chain constraints affecting production.


What is the projected market growth for rugged smartphones and tablets?
The global market was valued at USD 1,371 million in 2023 and is expected to reach USD 2,130.52 million by 2030, growing at a CAGR of 6.50%.

Rugged Smartphone and Tablets Market, Size, Trends, Business Strategies 2025-2032

Get Sample Report PDF for Exclusive Insights

Report Sample Includes

  • Table of Contents
  • List of Tables & Figures
  • Charts, Research Methodology, and more...
PDF Icon Download Sample Report PDF

Download Sample Report

Table of Content

Table of Contents
1 Research Methodology and Statistical Scope
1.1 Market Definition and Statistical Scope of Rugged Smartphone and Tablets
1.2 Key Market Segments
1.2.1 Rugged Smartphone and Tablets Segment by Type
1.2.2 Rugged Smartphone and Tablets Segment by Application
1.3 Methodology & Sources of Information
1.3.1 Research Methodology
1.3.2 Research Process
1.3.3 Market Breakdown and Data Triangulation
1.3.4 Base Year
1.3.5 Report Assumptions & Caveats
2 Rugged Smartphone and Tablets Market Overview
2.1 Global Market Overview
2.1.1 Global Rugged Smartphone and Tablets Market Size (M USD) Estimates and Forecasts (2019-2030)
2.1.2 Global Rugged Smartphone and Tablets Sales Estimates and Forecasts (2019-2030)
2.2 Market Segment Executive Summary
2.3 Global Market Size by Region
3 Rugged Smartphone and Tablets Market Competitive Landscape
3.1 Global Rugged Smartphone and Tablets Sales by Manufacturers (2019-2025)
3.2 Global Rugged Smartphone and Tablets Revenue Market Share by Manufacturers (2019-2025)
3.3 Rugged Smartphone and Tablets Market Share by Company Type (Tier 1, Tier 2, and Tier 3)
3.4 Global Rugged Smartphone and Tablets Average Price by Manufacturers (2019-2025)
3.5 Manufacturers Rugged Smartphone and Tablets Sales Sites, Area Served, Product Type
3.6 Rugged Smartphone and Tablets Market Competitive Situation and Trends
3.6.1 Rugged Smartphone and Tablets Market Concentration Rate
3.6.2 Global 5 and 10 Largest Rugged Smartphone and Tablets Players Market Share by Revenue
3.6.3 Mergers & Acquisitions, Expansion
4 Rugged Smartphone and Tablets Industry Chain Analysis
4.1 Rugged Smartphone and Tablets Industry Chain Analysis
4.2 Market Overview of Key Raw Materials
4.3 Midstream Market Analysis
4.4 Downstream Customer Analysis
5 The Development and Dynamics of Rugged Smartphone and Tablets Market
5.1 Key Development Trends
5.2 Driving Factors
5.3 Market Challenges
5.4 Market Restraints
5.5 Industry News
5.5.1 New Product Developments
5.5.2 Mergers & Acquisitions
5.5.3 Expansions
5.5.4 Collaboration/Supply Contracts
5.6 Industry Policies
6 Rugged Smartphone and Tablets Market Segmentation by Type
6.1 Evaluation Matrix of Segment Market Development Potential (Type)
6.2 Global Rugged Smartphone and Tablets Sales Market Share by Type (2019-2025)
6.3 Global Rugged Smartphone and Tablets Market Size Market Share by Type (2019-2025)
6.4 Global Rugged Smartphone and Tablets Price by Type (2019-2025)
7 Rugged Smartphone and Tablets Market Segmentation by Application
7.1 Evaluation Matrix of Segment Market Development Potential (Application)
7.2 Global Rugged Smartphone and Tablets Market Sales by Application (2019-2025)
7.3 Global Rugged Smartphone and Tablets Market Size (M USD) by Application (2019-2025)
7.4 Global Rugged Smartphone and Tablets Sales Growth Rate by Application (2019-2025)
8 Rugged Smartphone and Tablets Market Segmentation by Region
8.1 Global Rugged Smartphone and Tablets Sales by Region
8.1.1 Global Rugged Smartphone and Tablets Sales by Region
8.1.2 Global Rugged Smartphone and Tablets Sales Market Share by Region
8.2 North America
8.2.1 North America Rugged Smartphone and Tablets Sales by Country
8.2.2 U.S.
8.2.3 Canada
8.2.4 Mexico
8.3 Europe
8.3.1 Europe Rugged Smartphone and Tablets Sales by Country
8.3.2 Germany
8.3.3 France
8.3.4 U.K.
8.3.5 Italy
8.3.6 Russia
8.4 Asia Pacific
8.4.1 Asia Pacific Rugged Smartphone and Tablets Sales by Region
8.4.2 China
8.4.3 Japan
8.4.4 South Korea
8.4.5 India
8.4.6 Southeast Asia
8.5 South America
8.5.1 South America Rugged Smartphone and Tablets Sales by Country
8.5.2 Brazil
8.5.3 Argentina
8.5.4 Columbia
8.6 Middle East and Africa
8.6.1 Middle East and Africa Rugged Smartphone and Tablets Sales by Region
8.6.2 Saudi Arabia
8.6.3 UAE
8.6.4 Egypt
8.6.5 Nigeria
8.6.6 South Africa
9 Key Companies Profile
9.1 Samsung
9.1.1 Samsung Rugged Smartphone and Tablets Basic Information
9.1.2 Samsung Rugged Smartphone and Tablets Product Overview
9.1.3 Samsung Rugged Smartphone and Tablets Product Market Performance
9.1.4 Samsung Business Overview
9.1.5 Samsung Rugged Smartphone and Tablets SWOT Analysis
9.1.6 Samsung Recent Developments
9.2 Aijiemo
9.2.1 Aijiemo Rugged Smartphone and Tablets Basic Information
9.2.2 Aijiemo Rugged Smartphone and Tablets Product Overview
9.2.3 Aijiemo Rugged Smartphone and Tablets Product Market Performance
9.2.4 Aijiemo Business Overview
9.2.5 Aijiemo Rugged Smartphone and Tablets SWOT Analysis
9.2.6 Aijiemo Recent Developments
9.3 Kyocera Corporation
9.3.1 Kyocera Corporation Rugged Smartphone and Tablets Basic Information
9.3.2 Kyocera Corporation Rugged Smartphone and Tablets Product Overview
9.3.3 Kyocera Corporation Rugged Smartphone and Tablets Product Market Performance
9.3.4 Kyocera Corporation Rugged Smartphone and Tablets SWOT Analysis
9.3.5 Kyocera Corporation Business Overview
9.3.6 Kyocera Corporation Recent Developments
9.4 Caterpillar (USA)
9.4.1 Caterpillar (USA) Rugged Smartphone and Tablets Basic Information
9.4.2 Caterpillar (USA) Rugged Smartphone and Tablets Product Overview
9.4.3 Caterpillar (USA) Rugged Smartphone and Tablets Product Market Performance
9.4.4 Caterpillar (USA) Business Overview
9.4.5 Caterpillar (USA) Recent Developments
9.5 Doogee
9.5.1 Doogee Rugged Smartphone and Tablets Basic Information
9.5.2 Doogee Rugged Smartphone and Tablets Product Overview
9.5.3 Doogee Rugged Smartphone and Tablets Product Market Performance
9.5.4 Doogee Business Overview
9.5.5 Doogee Recent Developments
9.6 Crosscall
9.6.1 Crosscall Rugged Smartphone and Tablets Basic Information
9.6.2 Crosscall Rugged Smartphone and Tablets Product Overview
9.6.3 Crosscall Rugged Smartphone and Tablets Product Market Performance
9.6.4 Crosscall Business Overview
9.6.5 Crosscall Recent Developments
9.7 Sonim
9.7.1 Sonim Rugged Smartphone and Tablets Basic Information
9.7.2 Sonim Rugged Smartphone and Tablets Product Overview
9.7.3 Sonim Rugged Smartphone and Tablets Product Market Performance
9.7.4 Sonim Business Overview
9.7.5 Sonim Recent Developments
9.8 RugGear
9.8.1 RugGear Rugged Smartphone and Tablets Basic Information
9.8.2 RugGear Rugged Smartphone and Tablets Product Overview
9.8.3 RugGear Rugged Smartphone and Tablets Product Market Performance
9.8.4 RugGear Business Overview
9.8.5 RugGear Recent Developments
9.9 Runbo
9.9.1 Runbo Rugged Smartphone and Tablets Basic Information
9.9.2 Runbo Rugged Smartphone and Tablets Product Overview
9.9.3 Runbo Rugged Smartphone and Tablets Product Market Performance
9.9.4 Runbo Business Overview
9.9.5 Runbo Recent Developments
9.10 Juniper Systems
9.10.1 Juniper Systems Rugged Smartphone and Tablets Basic Information
9.10.2 Juniper Systems Rugged Smartphone and Tablets Product Overview
9.10.3 Juniper Systems Rugged Smartphone and Tablets Product Market Performance
9.10.4 Juniper Systems Business Overview
9.10.5 Juniper Systems Recent Developments
10 Rugged Smartphone and Tablets Market Forecast by Region
10.1 Global Rugged Smartphone and Tablets Market Size Forecast
10.2 Global Rugged Smartphone and Tablets Market Forecast by Region
10.2.1 North America Market Size Forecast by Country
10.2.2 Europe Rugged Smartphone and Tablets Market Size Forecast by Country
10.2.3 Asia Pacific Rugged Smartphone and Tablets Market Size Forecast by Region
10.2.4 South America Rugged Smartphone and Tablets Market Size Forecast by Country
10.2.5 Middle East and Africa Forecasted Consumption of Rugged Smartphone and Tablets by Country
11 Forecast Market by Type and by Application (2025-2030)
11.1 Global Rugged Smartphone and Tablets Market Forecast by Type (2025-2030)
11.1.1 Global Forecasted Sales of Rugged Smartphone and Tablets by Type (2025-2030)
11.1.2 Global Rugged Smartphone and Tablets Market Size Forecast by Type (2025-2030)
11.1.3 Global Forecasted Price of Rugged Smartphone and Tablets by Type (2025-2030)
11.2 Global Rugged Smartphone and Tablets Market Forecast by Application (2025-2030)
11.2.1 Global Rugged Smartphone and Tablets Sales (K Units) Forecast by Application
11.2.2 Global Rugged Smartphone and Tablets Market Size (M USD) Forecast by Application (2025-2030)
12 Conclusion and Key FindingsList of Tables
Table 1. Introduction of the Type
Table 2. Introduction of the Application
Table 3. Market Size (M USD) Segment Executive Summary
Table 4. Rugged Smartphone and Tablets Market Size Comparison by Region (M USD)
Table 5. Global Rugged Smartphone and Tablets Sales (K Units) by Manufacturers (2019-2025)
Table 6. Global Rugged Smartphone and Tablets Sales Market Share by Manufacturers (2019-2025)
Table 7. Global Rugged Smartphone and Tablets Revenue (M USD) by Manufacturers (2019-2025)
Table 8. Global Rugged Smartphone and Tablets Revenue Share by Manufacturers (2019-2025)
Table 9. Company Type (Tier 1, Tier 2, and Tier 3) & (based on the Revenue in Rugged Smartphone and Tablets as of 2022)
Table 10. Global Market Rugged Smartphone and Tablets Average Price (USD/Unit) of Key Manufacturers (2019-2025)
Table 11. Manufacturers Rugged Smartphone and Tablets Sales Sites and Area Served
Table 12. Manufacturers Rugged Smartphone and Tablets Product Type
Table 13. Global Rugged Smartphone and Tablets Manufacturers Market Concentration Ratio (CR5 and HHI)
Table 14. Mergers & Acquisitions, Expansion Plans
Table 15. Industry Chain Map of Rugged Smartphone and Tablets
Table 16. Market Overview of Key Raw Materials
Table 17. Midstream Market Analysis
Table 18. Downstream Customer Analysis
Table 19. Key Development Trends
Table 20. Driving Factors
Table 21. Rugged Smartphone and Tablets Market Challenges
Table 22. Global Rugged Smartphone and Tablets Sales by Type (K Units)
Table 23. Global Rugged Smartphone and Tablets Market Size by Type (M USD)
Table 24. Global Rugged Smartphone and Tablets Sales (K Units) by Type (2019-2025)
Table 25. Global Rugged Smartphone and Tablets Sales Market Share by Type (2019-2025)
Table 26. Global Rugged Smartphone and Tablets Market Size (M USD) by Type (2019-2025)
Table 27. Global Rugged Smartphone and Tablets Market Size Share by Type (2019-2025)
Table 28. Global Rugged Smartphone and Tablets Price (USD/Unit) by Type (2019-2025)
Table 29. Global Rugged Smartphone and Tablets Sales (K Units) by Application
Table 30. Global Rugged Smartphone and Tablets Market Size by Application
Table 31. Global Rugged Smartphone and Tablets Sales by Application (2019-2025) & (K Units)
Table 32. Global Rugged Smartphone and Tablets Sales Market Share by Application (2019-2025)
Table 33. Global Rugged Smartphone and Tablets Sales by Application (2019-2025) & (M USD)
Table 34. Global Rugged Smartphone and Tablets Market Share by Application (2019-2025)
Table 35. Global Rugged Smartphone and Tablets Sales Growth Rate by Application (2019-2025)
Table 36. Global Rugged Smartphone and Tablets Sales by Region (2019-2025) & (K Units)
Table 37. Global Rugged Smartphone and Tablets Sales Market Share by Region (2019-2025)
Table 38. North America Rugged Smartphone and Tablets Sales by Country (2019-2025) & (K Units)
Table 39. Europe Rugged Smartphone and Tablets Sales by Country (2019-2025) & (K Units)
Table 40. Asia Pacific Rugged Smartphone and Tablets Sales by Region (2019-2025) & (K Units)
Table 41. South America Rugged Smartphone and Tablets Sales by Country (2019-2025) & (K Units)
Table 42. Middle East and Africa Rugged Smartphone and Tablets Sales by Region (2019-2025) & (K Units)
Table 43. Samsung Rugged Smartphone and Tablets Basic Information
Table 44. Samsung Rugged Smartphone and Tablets Product Overview
Table 45. Samsung Rugged Smartphone and Tablets Sales (K Units), Revenue (M USD), Price (USD/Unit) and Gross Margin (2019-2025)
Table 46. Samsung Business Overview
Table 47. Samsung Rugged Smartphone and Tablets SWOT Analysis
Table 48. Samsung Recent Developments
Table 49. Aijiemo Rugged Smartphone and Tablets Basic Information
Table 50. Aijiemo Rugged Smartphone and Tablets Product Overview
Table 51. Aijiemo Rugged Smartphone and Tablets Sales (K Units), Revenue (M USD), Price (USD/Unit) and Gross Margin (2019-2025)
Table 52. Aijiemo Business Overview
Table 53. Aijiemo Rugged Smartphone and Tablets SWOT Analysis
Table 54. Aijiemo Recent Developments
Table 55. Kyocera Corporation Rugged Smartphone and Tablets Basic Information
Table 56. Kyocera Corporation Rugged Smartphone and Tablets Product Overview
Table 57. Kyocera Corporation Rugged Smartphone and Tablets Sales (K Units), Revenue (M USD), Price (USD/Unit) and Gross Margin (2019-2025)
Table 58. Kyocera Corporation Rugged Smartphone and Tablets SWOT Analysis
Table 59. Kyocera Corporation Business Overview
Table 60. Kyocera Corporation Recent Developments
Table 61. Caterpillar (USA) Rugged Smartphone and Tablets Basic Information
Table 62. Caterpillar (USA) Rugged Smartphone and Tablets Product Overview
Table 63. Caterpillar (USA) Rugged Smartphone and Tablets Sales (K Units), Revenue (M USD), Price (USD/Unit) and Gross Margin (2019-2025)
Table 64. Caterpillar (USA) Business Overview
Table 65. Caterpillar (USA) Recent Developments
Table 66. Doogee Rugged Smartphone and Tablets Basic Information
Table 67. Doogee Rugged Smartphone and Tablets Product Overview
Table 68. Doogee Rugged Smartphone and Tablets Sales (K Units), Revenue (M USD), Price (USD/Unit) and Gross Margin (2019-2025)
Table 69. Doogee Business Overview
Table 70. Doogee Recent Developments
Table 71. Crosscall Rugged Smartphone and Tablets Basic Information
Table 72. Crosscall Rugged Smartphone and Tablets Product Overview
Table 73. Crosscall Rugged Smartphone and Tablets Sales (K Units), Revenue (M USD), Price (USD/Unit) and Gross Margin (2019-2025)
Table 74. Crosscall Business Overview
Table 75. Crosscall Recent Developments
Table 76. Sonim Rugged Smartphone and Tablets Basic Information
Table 77. Sonim Rugged Smartphone and Tablets Product Overview
Table 78. Sonim Rugged Smartphone and Tablets Sales (K Units), Revenue (M USD), Price (USD/Unit) and Gross Margin (2019-2025)
Table 79. Sonim Business Overview
Table 80. Sonim Recent Developments
Table 81. RugGear Rugged Smartphone and Tablets Basic Information
Table 82. RugGear Rugged Smartphone and Tablets Product Overview
Table 83. RugGear Rugged Smartphone and Tablets Sales (K Units), Revenue (M USD), Price (USD/Unit) and Gross Margin (2019-2025)
Table 84. RugGear Business Overview
Table 85. RugGear Recent Developments
Table 86. Runbo Rugged Smartphone and Tablets Basic Information
Table 87. Runbo Rugged Smartphone and Tablets Product Overview
Table 88. Runbo Rugged Smartphone and Tablets Sales (K Units), Revenue (M USD), Price (USD/Unit) and Gross Margin (2019-2025)
Table 89. Runbo Business Overview
Table 90. Runbo Recent Developments
Table 91. Juniper Systems Rugged Smartphone and Tablets Basic Information
Table 92. Juniper Systems Rugged Smartphone and Tablets Product Overview
Table 93. Juniper Systems Rugged Smartphone and Tablets Sales (K Units), Revenue (M USD), Price (USD/Unit) and Gross Margin (2019-2025)
Table 94. Juniper Systems Business Overview
Table 95. Juniper Systems Recent Developments
Table 96. Global Rugged Smartphone and Tablets Sales Forecast by Region (2025-2030) & (K Units)
Table 97. Global Rugged Smartphone and Tablets Market Size Forecast by Region (2025-2030) & (M USD)
Table 98. North America Rugged Smartphone and Tablets Sales Forecast by Country (2025-2030) & (K Units)
Table 99. North America Rugged Smartphone and Tablets Market Size Forecast by Country (2025-2030) & (M USD)
Table 100. Europe Rugged Smartphone and Tablets Sales Forecast by Country (2025-2030) & (K Units)
Table 101. Europe Rugged Smartphone and Tablets Market Size Forecast by Country (2025-2030) & (M USD)
Table 102. Asia Pacific Rugged Smartphone and Tablets Sales Forecast by Region (2025-2030) & (K Units)
Table 103. Asia Pacific Rugged Smartphone and Tablets Market Size Forecast by Region (2025-2030) & (M USD)
Table 104. South America Rugged Smartphone and Tablets Sales Forecast by Country (2025-2030) & (K Units)
Table 105. South America Rugged Smartphone and Tablets Market Size Forecast by Country (2025-2030) & (M USD)
Table 106. Middle East and Africa Rugged Smartphone and Tablets Consumption Forecast by Country (2025-2030) & (Units)
Table 107. Middle East and Africa Rugged Smartphone and Tablets Market Size Forecast by Country (2025-2030) & (M USD)
Table 108. Global Rugged Smartphone and Tablets Sales Forecast by Type (2025-2030) & (K Units)
Table 109. Global Rugged Smartphone and Tablets Market Size Forecast by Type (2025-2030) & (M USD)
Table 110. Global Rugged Smartphone and Tablets Price Forecast by Type (2025-2030) & (USD/Unit)
Table 111. Global Rugged Smartphone and Tablets Sales (K Units) Forecast by Application (2025-2030)
Table 112. Global Rugged Smartphone and Tablets Market Size Forecast by Application (2025-2030) & (M USD)
List of Figures
Figure 1. Product Picture of Rugged Smartphone and Tablets
Figure 2. Data Triangulation
Figure 3. Key Caveats
Figure 4. Global Rugged Smartphone and Tablets Market Size (M USD), 2019-2030
Figure 5. Global Rugged Smartphone and Tablets Market Size (M USD) (2019-2030)
Figure 6. Global Rugged Smartphone and Tablets Sales (K Units) & (2019-2030)
Figure 7. Evaluation Matrix of Segment Market Development Potential (Type)
Figure 8. Evaluation Matrix of Segment Market Development Potential (Application)
Figure 9. Evaluation Matrix of Regional Market Development Potential
Figure 10. Rugged Smartphone and Tablets Market Size by Country (M USD)
Figure 11. Rugged Smartphone and Tablets Sales Share by Manufacturers in 2023
Figure 12. Global Rugged Smartphone and Tablets Revenue Share by Manufacturers in 2023
Figure 13. Rugged Smartphone and Tablets Market Share by Company Type (Tier 1, Tier 2 and Tier 3): 2023
Figure 14. Global Market Rugged Smartphone and Tablets Average Price (USD/Unit) of Key Manufacturers in 2023
Figure 15. The Global 5 and 10 Largest Players: Market Share by Rugged Smartphone and Tablets Revenue in 2023
Figure 16. Evaluation Matrix of Segment Market Development Potential (Type)
Figure 17. Global Rugged Smartphone and Tablets Market Share by Type
Figure 18. Sales Market Share of Rugged Smartphone and Tablets by Type (2019-2025)
Figure 19. Sales Market Share of Rugged Smartphone and Tablets by Type in 2023
Figure 20. Market Size Share of Rugged Smartphone and Tablets by Type (2019-2025)
Figure 21. Market Size Market Share of Rugged Smartphone and Tablets by Type in 2023
Figure 22. Evaluation Matrix of Segment Market Development Potential (Application)
Figure 23. Global Rugged Smartphone and Tablets Market Share by Application
Figure 24. Global Rugged Smartphone and Tablets Sales Market Share by Application (2019-2025)
Figure 25. Global Rugged Smartphone and Tablets Sales Market Share by Application in 2023
Figure 26. Global Rugged Smartphone and Tablets Market Share by Application (2019-2025)
Figure 27. Global Rugged Smartphone and Tablets Market Share by Application in 2023
Figure 28. Global Rugged Smartphone and Tablets Sales Growth Rate by Application (2019-2025)
Figure 29. Global Rugged Smartphone and Tablets Sales Market Share by Region (2019-2025)
Figure 30. North America Rugged Smartphone and Tablets Sales and Growth Rate (2019-2025) & (K Units)
Figure 31. North America Rugged Smartphone and Tablets Sales Market Share by Country in 2023
Figure 32. U.S. Rugged Smartphone and Tablets Sales and Growth Rate (2019-2025) & (K Units)
Figure 33. Canada Rugged Smartphone and Tablets Sales (K Units) and Growth Rate (2019-2025)
Figure 34. Mexico Rugged Smartphone and Tablets Sales (Units) and Growth Rate (2019-2025)
Figure 35. Europe Rugged Smartphone and Tablets Sales and Growth Rate (2019-2025) & (K Units)
Figure 36. Europe Rugged Smartphone and Tablets Sales Market Share by Country in 2023
Figure 37. Germany Rugged Smartphone and Tablets Sales and Growth Rate (2019-2025) & (K Units)
Figure 38. France Rugged Smartphone and Tablets Sales and Growth Rate (2019-2025) & (K Units)
Figure 39. U.K. Rugged Smartphone and Tablets Sales and Growth Rate (2019-2025) & (K Units)
Figure 40. Italy Rugged Smartphone and Tablets Sales and Growth Rate (2019-2025) & (K Units)
Figure 41. Russia Rugged Smartphone and Tablets Sales and Growth Rate (2019-2025) & (K Units)
Figure 42. Asia Pacific Rugged Smartphone and Tablets Sales and Growth Rate (K Units)
Figure 43. Asia Pacific Rugged Smartphone and Tablets Sales Market Share by Region in 2023
Figure 44. China Rugged Smartphone and Tablets Sales and Growth Rate (2019-2025) & (K Units)
Figure 45. Japan Rugged Smartphone and Tablets Sales and Growth Rate (2019-2025) & (K Units)
Figure 46. South Korea Rugged Smartphone and Tablets Sales and Growth Rate (2019-2025) & (K Units)
Figure 47. India Rugged Smartphone and Tablets Sales and Growth Rate (2019-2025) & (K Units)
Figure 48. Southeast Asia Rugged Smartphone and Tablets Sales and Growth Rate (2019-2025) & (K Units)
Figure 49. South America Rugged Smartphone and Tablets Sales and Growth Rate (K Units)
Figure 50. South America Rugged Smartphone and Tablets Sales Market Share by Country in 2023
Figure 51. Brazil Rugged Smartphone and Tablets Sales and Growth Rate (2019-2025) & (K Units)
Figure 52. Argentina Rugged Smartphone and Tablets Sales and Growth Rate (2019-2025) & (K Units)
Figure 53. Columbia Rugged Smartphone and Tablets Sales and Growth Rate (2019-2025) & (K Units)
Figure 54. Middle East and Africa Rugged Smartphone and Tablets Sales and Growth Rate (K Units)
Figure 55. Middle East and Africa Rugged Smartphone and Tablets Sales Market Share by Region in 2023
Figure 56. Saudi Arabia Rugged Smartphone and Tablets Sales and Growth Rate (2019-2025) & (K Units)
Figure 57. UAE Rugged Smartphone and Tablets Sales and Growth Rate (2019-2025) & (K Units)
Figure 58. Egypt Rugged Smartphone and Tablets Sales and Growth Rate (2019-2025) & (K Units)
Figure 59. Nigeria Rugged Smartphone and Tablets Sales and Growth Rate (2019-2025) & (K Units)
Figure 60. South Africa Rugged Smartphone and Tablets Sales and Growth Rate (2019-2025) & (K Units)
Figure 61. Global Rugged Smartphone and Tablets Sales Forecast by Volume (2019-2030) & (K Units)
Figure 62. Global Rugged Smartphone and Tablets Market Size Forecast by Value (2019-2030) & (M USD)
Figure 63. Global Rugged Smartphone and Tablets Sales Market Share Forecast by Type (2025-2030)
Figure 64. Global Rugged Smartphone and Tablets Market Share Forecast by Type (2025-2030)
Figure 65. Global Rugged Smartphone and Tablets Sales Forecast by Application (2025-2030)
Figure 66. Global Rugged Smartphone and Tablets Market Share Forecast by Application (2025-2030)