Retail Touch Screen Display Market, Global Business Strategies 2025-2032

Retail Touch Screen Display Market was valued at 886 million in 2024 and is projected to reach US$ 1111 million by 2032, at a CAGR of 3.4% during the forecast period

PDF Icon Download Sample Report PDF
  • Quick Dispatch

    All Orders

  • Secure Payment

    100% Secure Payment

Price range: $1,500.00 through $4,250.00

Clear

MARKET INSIGHTS

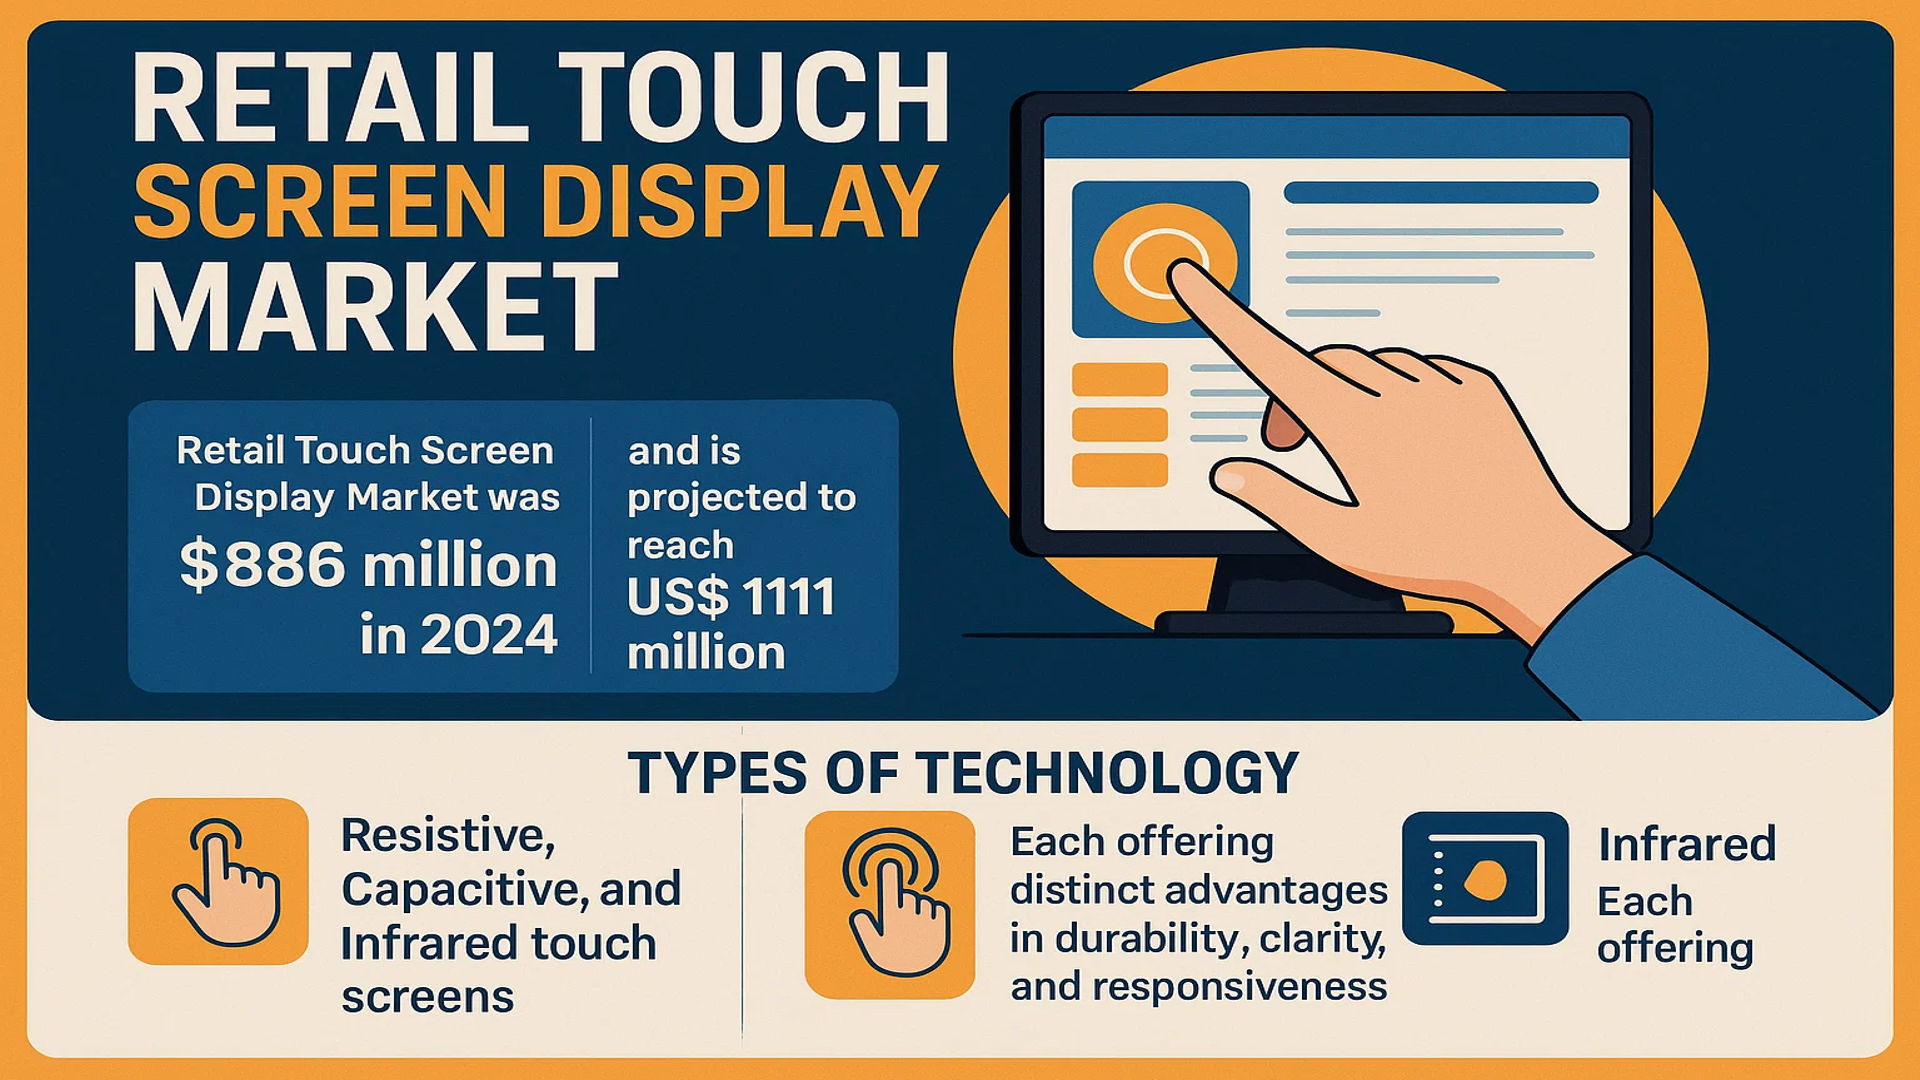
The global Retail Touch Screen Display Market was valued at 886 million in 2024 and is projected to reach US$ 1111 million by 2032, at a CAGR of 3.4% during the forecast period.

A retail touch screen display is an input device layered atop an electronic visual display, enabling users to interact with an information processing system through simple or multi-touch gestures using a stylus or fingers. These displays are fundamental components in modern retail environments, facilitating a wide range of applications from transaction processing to immersive customer engagement. The primary types of technology employed include Resistive, Capacitive, and Infrared touch screens, each offering distinct advantages in durability, clarity, and responsiveness.

The market’s steady growth is underpinned by the global retail sector’s ongoing digital transformation, driven by the demand for enhanced customer experiences and operational efficiency. The United States is the largest regional market, accounting for over 25% of global revenue, while Europe and China collectively represent over 40%. In terms of product technology, Resistive Touch Screens dominate, holding a market share exceeding 50% due to their cost-effectiveness and durability in high-traffic retail settings. The leading application segment is Point of Sale (POS) Equipment, followed closely by Interactive Point of Purchase (IPOP) systems, as retailers increasingly adopt self-service kiosks and interactive signage. Key players such as 3M, Elo Touch, and NEC continue to drive innovation and market consolidation.

Retail Touch Screen Display Market

MARKET DYNAMICS

MARKET DRIVERS

Rising Demand for Enhanced Customer Experience and Interactive Retail Solutions

The global retail industry is increasingly adopting touch screen displays to create immersive and interactive shopping experiences. Modern consumers expect seamless, engaging interactions with brands, driving retailers to invest in technologies that facilitate direct product exploration, information access, and personalized recommendations. Touch screen displays enable customers to browse catalogs, check inventory, compare products, and access detailed specifications without staff assistance. This technology significantly reduces perceived wait times and increases customer satisfaction. The integration of touch screens in point-of-sale systems, interactive kiosks, and digital signage has become a critical differentiator for retailers seeking to enhance brand perception and drive sales. The ability to provide real-time information and personalized content through these interfaces has transformed traditional retail spaces into dynamic, responsive environments.

Growth of Omnichannel Retailing and Digital Transformation Initiatives

Omnichannel retail strategies are accelerating the adoption of touch screen displays as bridges between physical and digital shopping experiences. Retailers are implementing these displays to create cohesive customer journeys that integrate online and offline channels. Touch screens in physical stores allow customers to access online inventories, place orders for out-of-stock items, and check alternative product options seamlessly. This integration reduces lost sales opportunities and improves inventory turnover. The digital transformation of retail operations, supported by investments in smart store technologies, is driving substantial demand for interactive displays. The capability to update content remotely, collect customer interaction data, and deliver targeted promotions makes touch screens invaluable tools for modern retailers implementing data-driven strategies.

Technological Advancements and Declining Production Costs

Continuous improvements in touch screen technology, including enhanced durability, better responsiveness, and reduced power consumption, are driving market expansion. Manufacturers have developed more robust displays capable of withstanding high-traffic retail environments while maintaining optical clarity and touch sensitivity. The evolution from resistive to capacitive and infrared technologies has improved user experience through multi-touch capabilities, gesture recognition, and enhanced accuracy. Simultaneously, economies of scale in manufacturing have significantly reduced production costs, making touch screen solutions more accessible to retailers across various segments. The development of larger format displays with higher resolutions has enabled more compelling visual merchandising applications, while smaller, more affordable units have expanded deployment opportunities in space-constrained environments.

MARKET RESTRAINTS

High Initial Investment and Maintenance Costs Limiting Small Retailer Adoption

Despite declining component costs, the comprehensive implementation of touch screen display systems requires significant capital investment that many smaller retailers find prohibitive. A complete interactive display solution includes not only the hardware but also content management systems, installation services, network infrastructure, and ongoing technical support. For multi-location retailers, the costs scale considerably, creating substantial barriers to widespread adoption. Maintenance expenses further compound these challenges, as touch screens in high-traffic retail environments require regular cleaning, calibration, and occasional repairs. The need for specialized technical expertise to address malfunctions adds to operational costs and complexity. These financial considerations particularly affect small and medium-sized retailers operating with limited capital budgets, restricting market penetration in certain segments.

Technical Reliability and Durability Concerns in High-Traffic Environments

Retail environments present unique challenges for electronic equipment, including constant public use, potential misuse, and varying environmental conditions. Touch screens must withstand thousands of interactions daily while maintaining performance accuracy and visual quality. Concerns about screen damage, calibration drift, and responsiveness degradation over time make some retailers hesitant to invest extensively in these technologies. The presence of liquids, cleaning chemicals, and physical impacts in retail settings creates durability issues that can affect product lifespan and reliability. Additionally, technical malfunctions can disrupt customer experiences and require immediate attention, creating operational challenges for retail staff untrained in troubleshooting sophisticated display systems.

Cybersecurity Risks and Data Privacy Considerations

As touch screen displays become more connected and integrated with retail management systems, they present potential vulnerabilities to cybersecurity threats. These devices often collect and process customer data, including touch patterns, browsing behaviors, and sometimes personal information, raising significant privacy concerns. Retailers must implement robust security measures to protect both customer data and internal systems from unauthorized access. Compliance with data protection regulations adds complexity and cost to deployment, particularly for international retailers operating across multiple jurisdictions with varying requirements. The potential for system breaches or data leaks creates apprehension among some retailers, slowing adoption rates despite the technology’s benefits.

MARKET CHALLENGES

Integration Complexity with Legacy Systems and Infrastructure

Many retailers operate with established point-of-sale systems, inventory management platforms, and customer relationship management tools that were not designed to interface with modern touch screen displays. Integrating new interactive technologies with these legacy systems presents significant technical challenges requiring custom solutions and extensive testing. The compatibility issues between different generations of technology can lead to implementation delays, increased costs, and functional limitations. Retailers must often choose between comprehensive system upgrades or developing complex integration frameworks, both of which require substantial investment and technical expertise. This integration complexity particularly affects established retail chains with deeply embedded existing technologies.

Other Challenges

Content Management and Update Requirements
Maintaining relevant, engaging content across multiple touch screen displays requires dedicated resources and continuous effort. Retailers must develop content strategies, create visually appealing materials, and ensure information remains current across all locations. The need for regular content updates to reflect changing promotions, inventory, and seasonal offerings creates ongoing operational demands. Without effective content management systems and processes, touch screen displays can quickly become outdated, reducing their effectiveness and potentially creating negative customer experiences.

Staff Training and Change Management
Implementing touch screen technologies often requires significant changes to staff roles and procedures. Employees must learn to troubleshoot basic technical issues, guide customers in using the systems, and integrate the technology into their sales approaches. Resistance to change and varying levels of technical proficiency among staff can hinder effective implementation. Comprehensive training programs and ongoing support are essential but add to the overall cost and complexity of deployment.

MARKET OPPORTUNITIES

Expansion into Emerging Markets and Untapped Retail Segments

Significant growth opportunities exist in emerging markets where retail modernization is accelerating and consumer expectations are evolving rapidly. As developing economies experience retail sector growth and increased competition, merchants are seeking technologies that differentiate their offerings and improve operational efficiency. The relatively lower penetration of touch screen displays in these markets presents substantial expansion potential for manufacturers and solution providers. Additionally, retail segments beyond traditional clothing and electronics, such as grocery, furniture, and automotive retail, are increasingly recognizing the value of interactive displays. These previously underserved segments represent considerable opportunity for market growth as awareness of technology benefits spreads across the retail industry.

Advancements in Augmented Reality and Interactive Technologies

The integration of augmented reality capabilities with touch screen displays creates new possibilities for immersive retail experiences. Technologies that allow customers to visualize products in different contexts, customize options in real-time, and access enhanced product information through interactive displays are gaining traction. These advanced applications provide retailers with opportunities to differentiate their offerings and create more engaging customer interactions. The development of more sophisticated gesture control, voice integration, and personalized content delivery systems further expands the potential applications of touch screen technology in retail environments. These technological innovations open new market segments and application possibilities beyond traditional interactive displays.

Sustainability Initiatives and Energy-Efficient Solutions

Growing emphasis on sustainability in retail operations creates opportunities for manufacturers developing energy-efficient touch screen solutions. Displays with lower power consumption, longer lifespans, and recyclable components align with corporate sustainability goals and environmental regulations. The ability to reduce energy costs while demonstrating environmental responsibility provides compelling value propositions for retailers. Additionally, the development of displays using more sustainable materials and manufacturing processes addresses increasing consumer and regulatory pressure for environmentally conscious business practices. These sustainability considerations are becoming important factors in purchasing decisions, creating competitive advantages for manufacturers prioritizing eco-friendly innovations.

RETAIL TOUCH SCREEN DISPLAY MARKET TRENDS

Integration of Advanced Interactive Technologies to Emerge as a Dominant Trend

The global retail touch screen display market is experiencing a paradigm shift driven by the integration of advanced interactive technologies. Retailers are increasingly adopting high-resolution capacitive and infrared touch screens to enhance customer engagement and streamline operations. This trend is particularly evident in the Point of Sale (POS) Equipment segment, which accounts for over 40% of market applications. The demand for more intuitive and responsive interfaces has led to innovations such as multi-touch capabilities, gesture recognition, and improved durability. Furthermore, the rise of omnichannel retail strategies necessitates seamless digital interactions, making touch screens indispensable. The market is projected to grow from 886 million in 2024 to 1111 million by 2032, reflecting a compound annual growth rate of 3.4%. This growth is underpinned by continuous technological advancements that improve user experience and operational efficiency.

Other Trends

Expansion of Interactive Point of Purchase (IPOP) Solutions

The expansion of Interactive Point of Purchase (IPOP) solutions is significantly driving market growth. IPOP displays, which include interactive kiosks and digital signage, are becoming essential tools for enhancing in-store customer experiences and boosting sales. These solutions allow retailers to provide personalized promotions, product information, and navigation assistance, thereby increasing consumer engagement. The adoption of IPOP is particularly strong in North America and Europe, where retailers invest heavily in digital transformation. The resistive touch screen segment, which holds over 50% market share due to its cost-effectiveness and reliability, is widely used in these applications. Additionally, the integration of AI and data analytics with IPOP systems enables retailers to gather valuable consumer insights and tailor marketing strategies effectively.

Growing Demand for Enhanced Retail Brand Experience

The growing emphasis on creating immersive retail brand experiences is another key trend propelling the touch screen display market. Retailers are leveraging large-format touch screens and interactive tables to offer unique, engaging environments that differentiate their brands. These technologies facilitate virtual try-ons, interactive catalogs, and gamified shopping experiences, which are especially popular in sectors like fashion, electronics, and automotive. The capacitive touch screen segment, known for its superior clarity and responsiveness, is increasingly preferred for these high-end applications. Moreover, the post-pandemic recovery has accelerated investments in touchless and hygienic solutions, such as infrared touch screens, which allow interaction without physical contact. This focus on customer safety and experience is expected to sustain market growth, with significant contributions from emerging markets in Asia-Pacific.

COMPETITIVE LANDSCAPE

Key Industry Players

Companies Focus on Technological Innovation and Strategic Partnerships to Maintain Market Position

The global retail touch screen display market exhibits a semi-consolidated structure, characterized by the presence of multinational corporations, specialized technology firms, and emerging regional players competing intensely. 3M Company stands as a dominant force, leveraging its extensive R&D capabilities and robust global distribution network to secure a significant market share. The company’s diverse portfolio, which includes advanced projected capacitive (PCAP) and resistive touch solutions, caters to various retail applications from point-of-sale systems to interactive kiosks.

Elo Touch Solutions and NEC Display Solutions are also major contributors, collectively holding a substantial portion of the market. Elo’s strength lies in its dedicated focus on commercial-grade touch displays, known for durability and high performance in demanding retail environments. Meanwhile, NEC capitalizes on its strong brand reputation and integrated display technologies, particularly in large-format digital signage and POS systems. Both companies benefit from established relationships with retail chains and system integrators worldwide.

Market competition is further intensified by strategic activities such as mergers, acquisitions, and partnerships. For instance, the acquisition of Planar Systems by Leyard Optoelectronic has strengthened its product offerings and global reach. Similarly, companies are heavily investing in developing more intuitive, energy-efficient, and durable touch technologies to meet the evolving demands of modern retail, including enhanced multi-touch capabilities and improved optical clarity.

Meanwhile, Asian manufacturers like TPK Holding and Chimei Innolux compete aggressively on cost-efficiency and scale, supplying touch sensors and modules to numerous brands and OEMs. Their growth is propelled by massive production capacities and continuous innovation in touch panel manufacturing. These players are increasingly focusing on expanding their footprint in North American and European markets through competitive pricing and reliable supply chains.

List of Key Retail Touch Screen Display Companies Profiled

Segment Analysis:

By Type

Resistive Touch Screen Segment Dominates the Market Due to its Cost-Effectiveness and High Durability

The market is segmented based on type into:

  • Resistive Touch Screen
  • Capacitive Touch Screen
  • Infrared Touch Screen
  • Other

By Application

Point of Sale (POS) Equipment Segment Leads Due to its Critical Role in Streamlining Retail Transactions

The market is segmented based on application into:

  • Interactive Point of Purchase (IPOP)
  • Retail Brand Experience (Table)
  • Point of Sale (POS) Equipment
  • ATM
  • Others

By End User

Retail Stores Segment Leads the Market Owing to Widespread Adoption for Enhanced Customer Engagement

The market is segmented based on end user into:

  • Retail Stores
    • Subtypes: Supermarkets, Hypermarkets, Specialty Stores, and others
  • Hospitality
  • Banking & Financial Services
  • Transportation Hubs
  • Others

By Screen Size

Medium-Sized Displays (15-30 inches) Segment Leads Due to Optimal Versatility Across Retail Applications

The market is segmented based on screen size into:

  • Small (Below 15 inches)
  • Medium (15-30 inches)
  • Large (Above 30 inches)

Regional Analysis: Retail Touch Screen Display Market

North America
The United States is the largest market globally, holding over 25% of the total market share. This dominance is driven by a highly developed retail sector, widespread adoption of advanced point-of-sale (POS) systems, and significant investments in interactive kiosks and digital signage. The region is characterized by a strong preference for capacitive touch screen technology due to its superior responsiveness and multi-touch capabilities. Major players like 3M and Elo Touch Solutions have a significant presence here, fueling innovation. The market is mature but continues to grow steadily, supported by the ongoing retail digitalization trend and the need for enhanced customer engagement solutions.

Europe
Europe represents a substantial market, collectively holding a share of over 40% when combined with specific key countries. The region is characterized by stringent quality standards and a high adoption rate of retail technology. Countries like Germany, the UK, and France are at the forefront, driven by a robust retail infrastructure and a focus on creating immersive brand experiences. The demand is particularly strong for Interactive Point of Purchase (IPOP) displays and advanced POS equipment. European retailers are increasingly integrating touch screens for self-service kiosks and information terminals, with a noticeable shift towards more durable and higher-resolution displays to withstand high traffic environments.

Asia-Pacific
Led overwhelmingly by China, the Asia-Pacific region is a powerhouse of both consumption and manufacturing. China alone commands a massive share of the global market, driven by its vast manufacturing base for electronic components and a rapidly modernizing retail landscape. The region shows a distinct product preference, with resistive touch screens still holding the majority share due to their cost-effectiveness, particularly in price-sensitive markets. However, there is a palpable and accelerating shift towards capacitive technology, especially in premium retail segments and urban centers in countries like Japan and South Korea. The growth is fueled by massive urbanization, the expansion of organized retail, and the proliferation of ATMs and self-service kiosks.

South America
The market in South America is in a growth phase, presenting emerging opportunities for display suppliers. Countries like Brazil and Argentina are seeing gradual modernization of their retail sectors. The adoption of touch screen displays is primarily driven by the need for basic POS equipment and simple interactive kiosks. However, economic volatility and budgetary constraints often mean that retailers prioritize cost-effective solutions, which can slow the adoption of the latest high-end capacitive or infrared technologies. The market potential is significant but is closely tied to regional economic stability and increased investment in retail infrastructure.

Middle East & Africa
This is an emerging market with notable growth potential, particularly in the Gulf Cooperation Council (GCC) nations like the UAE and Saudi Arabia. Development is fueled by investments in luxury retail, shopping malls, and tourism infrastructure, which demand high-quality digital signage and interactive brand experience tables. However, progress across the broader region is uneven. While demand for durable displays is rising, wider adoption is often tempered by funding limitations and a less developed retail ecosystem in many nations. The long-term outlook remains positive, anchored by urban development projects and a growing focus on enhancing the retail customer journey.

Report Scope

This market research report provides a comprehensive analysis of the global and regional Retail Touch Screen Display markets, covering the forecast period 2025–2032. It offers detailed insights into market dynamics, technological advancements, competitive landscape, and key trends shaping the industry.

Key focus areas of the report include:

  • Market Size & Forecast: Historical data and future projections for revenue, unit shipments, and market value across major regions and segments.
  • Segmentation Analysis: Detailed breakdown by product type, technology, application, and end-user industry to identify high-growth segments and investment opportunities.
  • Regional Outlook: Insights into market performance across North America, Europe, Asia-Pacific, Latin America, and the Middle East & Africa, including country-level analysis where relevant.
  • Competitive Landscape: Profiles of leading market participants, including their product offerings, R&D focus, manufacturing capacity, pricing strategies, and recent developments such as mergers, acquisitions, and partnerships.
  • Technology Trends & Innovation: Assessment of emerging technologies, integration of AI/IoT, semiconductor design trends, fabrication techniques, and evolving industry standards.
  • Market Drivers & Restraints: Evaluation of factors driving market growth along with challenges, supply chain constraints, regulatory issues, and market-entry barriers.
  • Stakeholder Analysis: Insights for component suppliers, OEMs, system integrators, investors, and policymakers regarding the evolving ecosystem and strategic opportunities.

Primary and secondary research methods are employed, including interviews with industry experts, data from verified sources, and real-time market intelligence to ensure the accuracy and reliability of the insights presented.

FREQUENTLY ASKED QUESTIONS:

What is the current market size of Global Retail Touch Screen Display Market?

-> Retail Touch Screen Display Market was valued at 886 million in 2024 and is projected to reach US$ 1111 million by 2032, at a CAGR of 3.4% during the forecast period.

Which key companies operate in Global Retail Touch Screen Display Market?

-> Key players include 3M, Elo Touch, Planar Systems, Touch International, and NEC, among others.

What are the key growth drivers?

-> Key growth drivers include digital transformation in retail, demand for interactive customer experiences, and expansion of self-service kiosks and POS systems.

Which region dominates the market?

-> North America is the largest market, with a share over 25%, while Asia-Pacific is the fastest-growing region.

What are the emerging trends?

-> Emerging trends include integration of AI-powered analytics, adoption of larger and bezel-less displays, and increased use of capacitive touch technology.

Retail Touch Screen Display Market, Global Business Strategies 2025-2032

Get Sample Report PDF for Exclusive Insights

Report Sample Includes

  • Table of Contents
  • List of Tables & Figures
  • Charts, Research Methodology, and more...
PDF Icon Download Sample Report PDF

Download Sample Report

Table of Content

1 Introduction to Research & Analysis Reports
1.1 Retail Touch Screen Display Market Definition
1.2 Market Segments
1.2.1 Segment by Type
1.2.2 Segment by Application
1.3 Global Retail Touch Screen Display Market Overview
1.4 Features & Benefits of This Report
1.5 Methodology & Sources of Information
1.5.1 Research Methodology
1.5.2 Research Process
1.5.3 Base Year
1.5.4 Report Assumptions & Caveats
2 Global Retail Touch Screen Display Overall Market Size
2.1 Global Retail Touch Screen Display Market Size: 2024 VS 2032
2.2 Global Retail Touch Screen Display Market Size, Prospects & Forecasts: 2020-2032
2.3 Global Retail Touch Screen Display Sales: 2020-2032
3 Company Landscape
3.1 Top Retail Touch Screen Display Players in Global Market
3.2 Top Global Retail Touch Screen Display Companies Ranked by Revenue
3.3 Global Retail Touch Screen Display Revenue by Companies
3.4 Global Retail Touch Screen Display Sales by Companies
3.5 Global Retail Touch Screen Display Price by Manufacturer (2020-2025)
3.6 Top 3 and Top 5 Retail Touch Screen Display Companies in Global Market, by Revenue in 2024
3.7 Global Manufacturers Retail Touch Screen Display Product Type
3.8 Tier 1, Tier 2, and Tier 3 Retail Touch Screen Display Players in Global Market
3.8.1 List of Global Tier 1 Retail Touch Screen Display Companies
3.8.2 List of Global Tier 2 and Tier 3 Retail Touch Screen Display Companies
4 Sights by Product
4.1 Overview
4.1.1 Segment by Type – Global Retail Touch Screen Display Market Size Markets, 2024 & 2032
4.1.2 Resistive Touch Screen
4.1.3 Capacitive Touch Screen
4.1.4 Infrared Touch Screen
4.1.5 Other
4.2 Segment by Type – Global Retail Touch Screen Display Revenue & Forecasts
4.2.1 Segment by Type – Global Retail Touch Screen Display Revenue, 2020-2025
4.2.2 Segment by Type – Global Retail Touch Screen Display Revenue, 2026-2032
4.2.3 Segment by Type – Global Retail Touch Screen Display Revenue Market Share, 2020-2032
4.3 Segment by Type – Global Retail Touch Screen Display Sales & Forecasts
4.3.1 Segment by Type – Global Retail Touch Screen Display Sales, 2020-2025
4.3.2 Segment by Type – Global Retail Touch Screen Display Sales, 2026-2032
4.3.3 Segment by Type – Global Retail Touch Screen Display Sales Market Share, 2020-2032
4.4 Segment by Type – Global Retail Touch Screen Display Price (Manufacturers Selling Prices), 2020-2032
5 Sights by Application
5.1 Overview
5.1.1 Segment by Application – Global Retail Touch Screen Display Market Size, 2024 & 2032
5.1.2 Interactive Point of Purchase (IPOP)
5.1.3 Retail Brand Experience (Table)
5.1.4 Point of Sale (POS) Equipment
5.1.5 ATM
5.1.6 Others
5.2 Segment by Application – Global Retail Touch Screen Display Revenue & Forecasts
5.2.1 Segment by Application – Global Retail Touch Screen Display Revenue, 2020-2025
5.2.2 Segment by Application – Global Retail Touch Screen Display Revenue, 2026-2032
5.2.3 Segment by Application – Global Retail Touch Screen Display Revenue Market Share, 2020-2032
5.3 Segment by Application – Global Retail Touch Screen Display Sales & Forecasts
5.3.1 Segment by Application – Global Retail Touch Screen Display Sales, 2020-2025
5.3.2 Segment by Application – Global Retail Touch Screen Display Sales, 2026-2032
5.3.3 Segment by Application – Global Retail Touch Screen Display Sales Market Share, 2020-2032
5.4 Segment by Application – Global Retail Touch Screen Display Price (Manufacturers Selling Prices), 2020-2032
6 Sights by Region
6.1 By Region – Global Retail Touch Screen Display Market Size, 2024 & 2032
6.2 By Region – Global Retail Touch Screen Display Revenue & Forecasts
6.2.1 By Region – Global Retail Touch Screen Display Revenue, 2020-2025
6.2.2 By Region – Global Retail Touch Screen Display Revenue, 2026-2032
6.2.3 By Region – Global Retail Touch Screen Display Revenue Market Share, 2020-2032
6.3 By Region – Global Retail Touch Screen Display Sales & Forecasts
6.3.1 By Region – Global Retail Touch Screen Display Sales, 2020-2025
6.3.2 By Region – Global Retail Touch Screen Display Sales, 2026-2032
6.3.3 By Region – Global Retail Touch Screen Display Sales Market Share, 2020-2032
6.4 North America
6.4.1 By Country – North America Retail Touch Screen Display Revenue, 2020-2032
6.4.2 By Country – North America Retail Touch Screen Display Sales, 2020-2032
6.4.3 United States Retail Touch Screen Display Market Size, 2020-2032
6.4.4 Canada Retail Touch Screen Display Market Size, 2020-2032
6.4.5 Mexico Retail Touch Screen Display Market Size, 2020-2032
6.5 Europe
6.5.1 By Country – Europe Retail Touch Screen Display Revenue, 2020-2032
6.5.2 By Country – Europe Retail Touch Screen Display Sales, 2020-2032
6.5.3 Germany Retail Touch Screen Display Market Size, 2020-2032
6.5.4 France Retail Touch Screen Display Market Size, 2020-2032
6.5.5 U.K. Retail Touch Screen Display Market Size, 2020-2032
6.5.6 Italy Retail Touch Screen Display Market Size, 2020-2032
6.5.7 Russia Retail Touch Screen Display Market Size, 2020-2032
6.5.8 Nordic Countries Retail Touch Screen Display Market Size, 2020-2032
6.5.9 Benelux Retail Touch Screen Display Market Size, 2020-2032
6.6 Asia
6.6.1 By Region – Asia Retail Touch Screen Display Revenue, 2020-2032
6.6.2 By Region – Asia Retail Touch Screen Display Sales, 2020-2032
6.6.3 China Retail Touch Screen Display Market Size, 2020-2032
6.6.4 Japan Retail Touch Screen Display Market Size, 2020-2032
6.6.5 South Korea Retail Touch Screen Display Market Size, 2020-2032
6.6.6 Southeast Asia Retail Touch Screen Display Market Size, 2020-2032
6.6.7 India Retail Touch Screen Display Market Size, 2020-2032
6.7 South America
6.7.1 By Country – South America Retail Touch Screen Display Revenue, 2020-2032
6.7.2 By Country – South America Retail Touch Screen Display Sales, 2020-2032
6.7.3 Brazil Retail Touch Screen Display Market Size, 2020-2032
6.7.4 Argentina Retail Touch Screen Display Market Size, 2020-2032
6.8 Middle East & Africa
6.8.1 By Country – Middle East & Africa Retail Touch Screen Display Revenue, 2020-2032
6.8.2 By Country – Middle East & Africa Retail Touch Screen Display Sales, 2020-2032
6.8.3 Turkey Retail Touch Screen Display Market Size, 2020-2032
6.8.4 Israel Retail Touch Screen Display Market Size, 2020-2032
6.8.5 Saudi Arabia Retail Touch Screen Display Market Size, 2020-2032
6.8.6 UAE Retail Touch Screen Display Market Size, 2020-2032
7 Manufacturers & Brands Profiles
7.1 3M
7.1.1 3M Company Summary
7.1.2 3M Business Overview
7.1.3 3M Retail Touch Screen Display Major Product Offerings
7.1.4 3M Retail Touch Screen Display Sales and Revenue in Global (2020-2025)
7.1.5 3M Key News & Latest Developments
7.2 Elo Touch
7.2.1 Elo Touch Company Summary
7.2.2 Elo Touch Business Overview
7.2.3 Elo Touch Retail Touch Screen Display Major Product Offerings
7.2.4 Elo Touch Retail Touch Screen Display Sales and Revenue in Global (2020-2025)
7.2.5 Elo Touch Key News & Latest Developments
7.3 Planar Systems
7.3.1 Planar Systems Company Summary
7.3.2 Planar Systems Business Overview
7.3.3 Planar Systems Retail Touch Screen Display Major Product Offerings
7.3.4 Planar Systems Retail Touch Screen Display Sales and Revenue in Global (2020-2025)
7.3.5 Planar Systems Key News & Latest Developments
7.4 Touch International
7.4.1 Touch International Company Summary
7.4.2 Touch International Business Overview
7.4.3 Touch International Retail Touch Screen Display Major Product Offerings
7.4.4 Touch International Retail Touch Screen Display Sales and Revenue in Global (2020-2025)
7.4.5 Touch International Key News & Latest Developments
7.5 NEC
7.5.1 NEC Company Summary
7.5.2 NEC Business Overview
7.5.3 NEC Retail Touch Screen Display Major Product Offerings
7.5.4 NEC Retail Touch Screen Display Sales and Revenue in Global (2020-2025)
7.5.5 NEC Key News & Latest Developments
7.6 TPK
7.6.1 TPK Company Summary
7.6.2 TPK Business Overview
7.6.3 TPK Retail Touch Screen Display Major Product Offerings
7.6.4 TPK Retail Touch Screen Display Sales and Revenue in Global (2020-2025)
7.6.5 TPK Key News & Latest Developments
7.7 Flatvision
7.7.1 Flatvision Company Summary
7.7.2 Flatvision Business Overview
7.7.3 Flatvision Retail Touch Screen Display Major Product Offerings
7.7.4 Flatvision Retail Touch Screen Display Sales and Revenue in Global (2020-2025)
7.7.5 Flatvision Key News & Latest Developments
7.8 Chimei Innolux
7.8.1 Chimei Innolux Company Summary
7.8.2 Chimei Innolux Business Overview
7.8.3 Chimei Innolux Retail Touch Screen Display Major Product Offerings
7.8.4 Chimei Innolux Retail Touch Screen Display Sales and Revenue in Global (2020-2025)
7.8.5 Chimei Innolux Key News & Latest Developments
7.9 AOPEN Inc
7.9.1 AOPEN Inc Company Summary
7.9.2 AOPEN Inc Business Overview
7.9.3 AOPEN Inc Retail Touch Screen Display Major Product Offerings
7.9.4 AOPEN Inc Retail Touch Screen Display Sales and Revenue in Global (2020-2025)
7.9.5 AOPEN Inc Key News & Latest Developments
7.10 Flytech
7.10.1 Flytech Company Summary
7.10.2 Flytech Business Overview
7.10.3 Flytech Retail Touch Screen Display Major Product Offerings
7.10.4 Flytech Retail Touch Screen Display Sales and Revenue in Global (2020-2025)
7.10.5 Flytech Key News & Latest Developments
7.11 FEC
7.11.1 FEC Company Summary
7.11.2 FEC Business Overview
7.11.3 FEC Retail Touch Screen Display Major Product Offerings
7.11.4 FEC Retail Touch Screen Display Sales and Revenue in Global (2020-2025)
7.11.5 FEC Key News & Latest Developments
7.12 Sharp
7.12.1 Sharp Company Summary
7.12.2 Sharp Business Overview
7.12.3 Sharp Retail Touch Screen Display Major Product Offerings
7.12.4 Sharp Retail Touch Screen Display Sales and Revenue in Global (2020-2025)
7.12.5 Sharp Key News & Latest Developments
7.13 Posiflex
7.13.1 Posiflex Company Summary
7.13.2 Posiflex Business Overview
7.13.3 Posiflex Retail Touch Screen Display Major Product Offerings
7.13.4 Posiflex Retail Touch Screen Display Sales and Revenue in Global (2020-2025)
7.13.5 Posiflex Key News & Latest Developments
7.14 Hisense
7.14.1 Hisense Company Summary
7.14.2 Hisense Business Overview
7.14.3 Hisense Retail Touch Screen Display Major Product Offerings
7.14.4 Hisense Retail Touch Screen Display Sales and Revenue in Global (2020-2025)
7.14.5 Hisense Key News & Latest Developments
7.15 Sed Electronics
7.15.1 Sed Electronics Company Summary
7.15.2 Sed Electronics Business Overview
7.15.3 Sed Electronics Retail Touch Screen Display Major Product Offerings
7.15.4 Sed Electronics Retail Touch Screen Display Sales and Revenue in Global (2020-2025)
7.15.5 Sed Electronics Key News & Latest Developments
7.16 Bigtide
7.16.1 Bigtide Company Summary
7.16.2 Bigtide Business Overview
7.16.3 Bigtide Retail Touch Screen Display Major Product Offerings
7.16.4 Bigtide Retail Touch Screen Display Sales and Revenue in Global (2020-2025)
7.16.5 Bigtide Key News & Latest Developments
7.17 Sinocan
7.17.1 Sinocan Company Summary
7.17.2 Sinocan Business Overview
7.17.3 Sinocan Retail Touch Screen Display Major Product Offerings
7.17.4 Sinocan Retail Touch Screen Display Sales and Revenue in Global (2020-2025)
7.17.5 Sinocan Key News & Latest Developments
7.18 Galaxy
7.18.1 Galaxy Company Summary
7.18.2 Galaxy Business Overview
7.18.3 Galaxy Retail Touch Screen Display Major Product Offerings
7.18.4 Galaxy Retail Touch Screen Display Sales and Revenue in Global (2020-2025)
7.18.5 Galaxy Key News & Latest Developments
7.19 Amongo
7.19.1 Amongo Company Summary
7.19.2 Amongo Business Overview
7.19.3 Amongo Retail Touch Screen Display Major Product Offerings
7.19.4 Amongo Retail Touch Screen Display Sales and Revenue in Global (2020-2025)
7.19.5 Amongo Key News & Latest Developments
7.20 Top electronic
7.20.1 Top electronic Company Summary
7.20.2 Top electronic Business Overview
7.20.3 Top electronic Retail Touch Screen Display Major Product Offerings
7.20.4 Top electronic Retail Touch Screen Display Sales and Revenue in Global (2020-2025)
7.20.5 Top electronic Key News & Latest Developments
7.21 Shenzhen L&M
7.21.1 Shenzhen L&M Company Summary
7.21.2 Shenzhen L&M Business Overview
7.21.3 Shenzhen L&M Retail Touch Screen Display Major Product Offerings
7.21.4 Shenzhen L&M Retail Touch Screen Display Sales and Revenue in Global (2020-2025)
7.21.5 Shenzhen L&M Key News & Latest Developments
8 Global Retail Touch Screen Display Production Capacity, Analysis
8.1 Global Retail Touch Screen Display Production Capacity, 2020-2032
8.2 Retail Touch Screen Display Production Capacity of Key Manufacturers in Global Market
8.3 Global Retail Touch Screen Display Production by Region
9 Key Market Trends, Opportunity, Drivers and Restraints
9.1 Market Opportunities & Trends
9.2 Market Drivers
9.3 Market Restraints
10 Retail Touch Screen Display Supply Chain Analysis
10.1 Retail Touch Screen Display Industry Value Chain
10.2 Retail Touch Screen Display Upstream Market
10.3 Retail Touch Screen Display Downstream and Clients
10.4 Marketing Channels Analysis
10.4.1 Marketing Channels
10.4.2 Retail Touch Screen Display Distributors and Sales Agents in Global
11 Conclusion
12 Appendix
12.1 Note
12.2 Examples of Clients
12.3 DisclaimerList of Tables
Table 1. Key Players of Retail Touch Screen Display in Global Market
Table 2. Top Retail Touch Screen Display Players in Global Market, Ranking by Revenue (2024)
Table 3. Global Retail Touch Screen Display Revenue by Companies, (US$, Mn), 2020-2025
Table 4. Global Retail Touch Screen Display Revenue Share by Companies, 2020-2025
Table 5. Global Retail Touch Screen Display Sales by Companies, (K Units), 2020-2025
Table 6. Global Retail Touch Screen Display Sales Share by Companies, 2020-2025
Table 7. Key Manufacturers Retail Touch Screen Display Price (2020-2025) & (K USD/Unit)
Table 8. Global Manufacturers Retail Touch Screen Display Product Type
Table 9. List of Global Tier 1 Retail Touch Screen Display Companies, Revenue (US$, Mn) in 2024 and Market Share
Table 10. List of Global Tier 2 and Tier 3 Retail Touch Screen Display Companies, Revenue (US$, Mn) in 2024 and Market Share
Table 11. Segment by Type – Global Retail Touch Screen Display Revenue, (US$, Mn), 2024 & 2032
Table 12. Segment by Type – Global Retail Touch Screen Display Revenue (US$, Mn), 2020-2025
Table 13. Segment by Type – Global Retail Touch Screen Display Revenue (US$, Mn), 2026-2032
Table 14. Segment by Type – Global Retail Touch Screen Display Sales (K Units), 2020-2025
Table 15. Segment by Type – Global Retail Touch Screen Display Sales (K Units), 2026-2032
Table 16. Segment by Application – Global Retail Touch Screen Display Revenue, (US$, Mn), 2024 & 2032
Table 17. Segment by Application – Global Retail Touch Screen Display Revenue, (US$, Mn), 2020-2025
Table 18. Segment by Application – Global Retail Touch Screen Display Revenue, (US$, Mn), 2026-2032
Table 19. Segment by Application – Global Retail Touch Screen Display Sales, (K Units), 2020-2025
Table 20. Segment by Application – Global Retail Touch Screen Display Sales, (K Units), 2026-2032
Table 21. By Region – Global Retail Touch Screen Display Revenue, (US$, Mn), 2025-2032
Table 22. By Region – Global Retail Touch Screen Display Revenue, (US$, Mn), 2020-2025
Table 23. By Region – Global Retail Touch Screen Display Revenue, (US$, Mn), 2026-2032
Table 24. By Region – Global Retail Touch Screen Display Sales, (K Units), 2020-2025
Table 25. By Region – Global Retail Touch Screen Display Sales, (K Units), 2026-2032
Table 26. By Country – North America Retail Touch Screen Display Revenue, (US$, Mn), 2020-2025
Table 27. By Country – North America Retail Touch Screen Display Revenue, (US$, Mn), 2026-2032
Table 28. By Country – North America Retail Touch Screen Display Sales, (K Units), 2020-2025
Table 29. By Country – North America Retail Touch Screen Display Sales, (K Units), 2026-2032
Table 30. By Country – Europe Retail Touch Screen Display Revenue, (US$, Mn), 2020-2025
Table 31. By Country – Europe Retail Touch Screen Display Revenue, (US$, Mn), 2026-2032
Table 32. By Country – Europe Retail Touch Screen Display Sales, (K Units), 2020-2025
Table 33. By Country – Europe Retail Touch Screen Display Sales, (K Units), 2026-2032
Table 34. By Region – Asia Retail Touch Screen Display Revenue, (US$, Mn), 2020-2025
Table 35. By Region – Asia Retail Touch Screen Display Revenue, (US$, Mn), 2026-2032
Table 36. By Region – Asia Retail Touch Screen Display Sales, (K Units), 2020-2025
Table 37. By Region – Asia Retail Touch Screen Display Sales, (K Units), 2026-2032
Table 38. By Country – South America Retail Touch Screen Display Revenue, (US$, Mn), 2020-2025
Table 39. By Country – South America Retail Touch Screen Display Revenue, (US$, Mn), 2026-2032
Table 40. By Country – South America Retail Touch Screen Display Sales, (K Units), 2020-2025
Table 41. By Country – South America Retail Touch Screen Display Sales, (K Units), 2026-2032
Table 42. By Country – Middle East & Africa Retail Touch Screen Display Revenue, (US$, Mn), 2020-2025
Table 43. By Country – Middle East & Africa Retail Touch Screen Display Revenue, (US$, Mn), 2026-2032
Table 44. By Country – Middle East & Africa Retail Touch Screen Display Sales, (K Units), 2020-2025
Table 45. By Country – Middle East & Africa Retail Touch Screen Display Sales, (K Units), 2026-2032
Table 46. 3M Company Summary
Table 47. 3M Retail Touch Screen Display Product Offerings
Table 48. 3M Retail Touch Screen Display Sales (K Units), Revenue (US$, Mn) and Average Price (K USD/Unit) & (2020-2025)
Table 49. 3M Key News & Latest Developments
Table 50. Elo Touch Company Summary
Table 51. Elo Touch Retail Touch Screen Display Product Offerings
Table 52. Elo Touch Retail Touch Screen Display Sales (K Units), Revenue (US$, Mn) and Average Price (K USD/Unit) & (2020-2025)
Table 53. Elo Touch Key News & Latest Developments
Table 54. Planar Systems Company Summary
Table 55. Planar Systems Retail Touch Screen Display Product Offerings
Table 56. Planar Systems Retail Touch Screen Display Sales (K Units), Revenue (US$, Mn) and Average Price (K USD/Unit) & (2020-2025)
Table 57. Planar Systems Key News & Latest Developments
Table 58. Touch International Company Summary
Table 59. Touch International Retail Touch Screen Display Product Offerings
Table 60. Touch International Retail Touch Screen Display Sales (K Units), Revenue (US$, Mn) and Average Price (K USD/Unit) & (2020-2025)
Table 61. Touch International Key News & Latest Developments
Table 62. NEC Company Summary
Table 63. NEC Retail Touch Screen Display Product Offerings
Table 64. NEC Retail Touch Screen Display Sales (K Units), Revenue (US$, Mn) and Average Price (K USD/Unit) & (2020-2025)
Table 65. NEC Key News & Latest Developments
Table 66. TPK Company Summary
Table 67. TPK Retail Touch Screen Display Product Offerings
Table 68. TPK Retail Touch Screen Display Sales (K Units), Revenue (US$, Mn) and Average Price (K USD/Unit) & (2020-2025)
Table 69. TPK Key News & Latest Developments
Table 70. Flatvision Company Summary
Table 71. Flatvision Retail Touch Screen Display Product Offerings
Table 72. Flatvision Retail Touch Screen Display Sales (K Units), Revenue (US$, Mn) and Average Price (K USD/Unit) & (2020-2025)
Table 73. Flatvision Key News & Latest Developments
Table 74. Chimei Innolux Company Summary
Table 75. Chimei Innolux Retail Touch Screen Display Product Offerings
Table 76. Chimei Innolux Retail Touch Screen Display Sales (K Units), Revenue (US$, Mn) and Average Price (K USD/Unit) & (2020-2025)
Table 77. Chimei Innolux Key News & Latest Developments
Table 78. AOPEN Inc Company Summary
Table 79. AOPEN Inc Retail Touch Screen Display Product Offerings
Table 80. AOPEN Inc Retail Touch Screen Display Sales (K Units), Revenue (US$, Mn) and Average Price (K USD/Unit) & (2020-2025)
Table 81. AOPEN Inc Key News & Latest Developments
Table 82. Flytech Company Summary
Table 83. Flytech Retail Touch Screen Display Product Offerings
Table 84. Flytech Retail Touch Screen Display Sales (K Units), Revenue (US$, Mn) and Average Price (K USD/Unit) & (2020-2025)
Table 85. Flytech Key News & Latest Developments
Table 86. FEC Company Summary
Table 87. FEC Retail Touch Screen Display Product Offerings
Table 88. FEC Retail Touch Screen Display Sales (K Units), Revenue (US$, Mn) and Average Price (K USD/Unit) & (2020-2025)
Table 89. FEC Key News & Latest Developments
Table 90. Sharp Company Summary
Table 91. Sharp Retail Touch Screen Display Product Offerings
Table 92. Sharp Retail Touch Screen Display Sales (K Units), Revenue (US$, Mn) and Average Price (K USD/Unit) & (2020-2025)
Table 93. Sharp Key News & Latest Developments
Table 94. Posiflex Company Summary
Table 95. Posiflex Retail Touch Screen Display Product Offerings
Table 96. Posiflex Retail Touch Screen Display Sales (K Units), Revenue (US$, Mn) and Average Price (K USD/Unit) & (2020-2025)
Table 97. Posiflex Key News & Latest Developments
Table 98. Hisense Company Summary
Table 99. Hisense Retail Touch Screen Display Product Offerings
Table 100. Hisense Retail Touch Screen Display Sales (K Units), Revenue (US$, Mn) and Average Price (K USD/Unit) & (2020-2025)
Table 101. Hisense Key News & Latest Developments
Table 102. Sed Electronics Company Summary
Table 103. Sed Electronics Retail Touch Screen Display Product Offerings
Table 104. Sed Electronics Retail Touch Screen Display Sales (K Units), Revenue (US$, Mn) and Average Price (K USD/Unit) & (2020-2025)
Table 105. Sed Electronics Key News & Latest Developments
Table 106. Bigtide Company Summary
Table 107. Bigtide Retail Touch Screen Display Product Offerings
Table 108. Bigtide Retail Touch Screen Display Sales (K Units), Revenue (US$, Mn) and Average Price (K USD/Unit) & (2020-2025)
Table 109. Bigtide Key News & Latest Developments
Table 110. Sinocan Company Summary
Table 111. Sinocan Retail Touch Screen Display Product Offerings
Table 112. Sinocan Retail Touch Screen Display Sales (K Units), Revenue (US$, Mn) and Average Price (K USD/Unit) & (2020-2025)
Table 113. Sinocan Key News & Latest Developments
Table 114. Galaxy Company Summary
Table 115. Galaxy Retail Touch Screen Display Product Offerings
Table 116. Galaxy Retail Touch Screen Display Sales (K Units), Revenue (US$, Mn) and Average Price (K USD/Unit) & (2020-2025)
Table 117. Galaxy Key News & Latest Developments
Table 118. Amongo Company Summary
Table 119. Amongo Retail Touch Screen Display Product Offerings
Table 120. Amongo Retail Touch Screen Display Sales (K Units), Revenue (US$, Mn) and Average Price (K USD/Unit) & (2020-2025)
Table 121. Amongo Key News & Latest Developments
Table 122. Top electronic Company Summary
Table 123. Top electronic Retail Touch Screen Display Product Offerings
Table 124. Top electronic Retail Touch Screen Display Sales (K Units), Revenue (US$, Mn) and Average Price (K USD/Unit) & (2020-2025)
Table 125. Top electronic Key News & Latest Developments
Table 126. Shenzhen L&M Company Summary
Table 127. Shenzhen L&M Retail Touch Screen Display Product Offerings
Table 128. Shenzhen L&M Retail Touch Screen Display Sales (K Units), Revenue (US$, Mn) and Average Price (K USD/Unit) & (2020-2025)
Table 129. Shenzhen L&M Key News & Latest Developments
Table 130. Retail Touch Screen Display Capacity of Key Manufacturers in Global Market, 2023-2025 (K Units)
Table 131. Global Retail Touch Screen Display Capacity Market Share of Key Manufacturers, 2023-2025
Table 132. Global Retail Touch Screen Display Production by Region, 2020-2025 (K Units)
Table 133. Global Retail Touch Screen Display Production by Region, 2026-2032 (K Units)
Table 134. Retail Touch Screen Display Market Opportunities & Trends in Global Market
Table 135. Retail Touch Screen Display Market Drivers in Global Market
Table 136. Retail Touch Screen Display Market Restraints in Global Market
Table 137. Retail Touch Screen Display Raw Materials
Table 138. Retail Touch Screen Display Raw Materials Suppliers in Global Market
Table 139. Typical Retail Touch Screen Display Downstream
Table 140. Retail Touch Screen Display Downstream Clients in Global Market
Table 141. Retail Touch Screen Display Distributors and Sales Agents in Global Market

List of Figures
Figure 1. Retail Touch Screen Display Product Picture
Figure 2. Retail Touch Screen Display Segment by Type in 2024
Figure 3. Retail Touch Screen Display Segment by Application in 2024
Figure 4. Global Retail Touch Screen Display Market Overview: 2024
Figure 5. Key Caveats
Figure 6. Global Retail Touch Screen Display Market Size: 2024 VS 2032 (US$, Mn)
Figure 7. Global Retail Touch Screen Display Revenue: 2020-2032 (US$, Mn)
Figure 8. Retail Touch Screen Display Sales in Global Market: 2020-2032 (K Units)
Figure 9. The Top 3 and 5 Players Market Share by Retail Touch Screen Display Revenue in 2024
Figure 10. Segment by Type – Global Retail Touch Screen Display Revenue, (US$, Mn), 2024 & 2032
Figure 11. Segment by Type – Global Retail Touch Screen Display Revenue Market Share, 2020-2032
Figure 12. Segment by Type – Global Retail Touch Screen Display Sales Market Share, 2020-2032
Figure 13. Segment by Type – Global Retail Touch Screen Display Price (K USD/Unit), 2020-2032
Figure 14. Segment by Application – Global Retail Touch Screen Display Revenue, (US$, Mn), 2024 & 2032
Figure 15. Segment by Application – Global Retail Touch Screen Display Revenue Market Share, 2020-2032
Figure 16. Segment by Application – Global Retail Touch Screen Display Sales Market Share, 2020-2032
Figure 17. Segment by Application -Global Retail Touch Screen Display Price (K USD/Unit), 2020-2032
Figure 18. By Region – Global Retail Touch Screen Display Revenue, (US$, Mn), 2025 & 2032
Figure 19. By Region – Global Retail Touch Screen Display Revenue Market Share, 2020 VS 2024 VS 2032
Figure 20. By Region – Global Retail Touch Screen Display Revenue Market Share, 2020-2032
Figure 21. By Region – Global Retail Touch Screen Display Sales Market Share, 2020-2032
Figure 22. By Country – North America Retail Touch Screen Display Revenue Market Share, 2020-2032
Figure 23. By Country – North America Retail Touch Screen Display Sales Market Share, 2020-2032
Figure 24. United States Retail Touch Screen Display Revenue, (US$, Mn), 2020-2032
Figure 25. Canada Retail Touch Screen Display Revenue, (US$, Mn), 2020-2032
Figure 26. Mexico Retail Touch Screen Display Revenue, (US$, Mn), 2020-2032
Figure 27. By Country – Europe Retail Touch Screen Display Revenue Market Share, 2020-2032
Figure 28. By Country – Europe Retail Touch Screen Display Sales Market Share, 2020-2032
Figure 29. Germany Retail Touch Screen Display Revenue, (US$, Mn), 2020-2032
Figure 30. France Retail Touch Screen Display Revenue, (US$, Mn), 2020-2032
Figure 31. U.K. Retail Touch Screen Display Revenue, (US$, Mn), 2020-2032
Figure 32. Italy Retail Touch Screen Display Revenue, (US$, Mn), 2020-2032
Figure 33. Russia Retail Touch Screen Display Revenue, (US$, Mn), 2020-2032
Figure 34. Nordic Countries Retail Touch Screen Display Revenue, (US$, Mn), 2020-2032
Figure 35. Benelux Retail Touch Screen Display Revenue, (US$, Mn), 2020-2032
Figure 36. By Region – Asia Retail Touch Screen Display Revenue Market Share, 2020-2032
Figure 37. By Region – Asia Retail Touch Screen Display Sales Market Share, 2020-2032
Figure 38. China Retail Touch Screen Display Revenue, (US$, Mn), 2020-2032
Figure 39. Japan Retail Touch Screen Display Revenue, (US$, Mn), 2020-2032
Figure 40. South Korea Retail Touch Screen Display Revenue, (US$, Mn), 2020-2032
Figure 41. Southeast Asia Retail Touch Screen Display Revenue, (US$, Mn), 2020-2032
Figure 42. India Retail Touch Screen Display Revenue, (US$, Mn), 2020-2032
Figure 43. By Country – South America Retail Touch Screen Display Revenue Market Share, 2020-2032
Figure 44. By Country – South America Retail Touch Screen Display Sales, Market Share, 2020-2032
Figure 45. Brazil Retail Touch Screen Display Revenue, (US$, Mn), 2020-2032
Figure 46. Argentina Retail Touch Screen Display Revenue, (US$, Mn), 2020-2032
Figure 47. By Country – Middle East & Africa Retail Touch Screen Display Revenue, Market Share, 2020-2032
Figure 48. By Country – Middle East & Africa Retail Touch Screen Display Sales, Market Share, 2020-2032
Figure 49. Turkey Retail Touch Screen Display Revenue, (US$, Mn), 2020-2032
Figure 50. Israel Retail Touch Screen Display Revenue, (US$, Mn), 2020-2032
Figure 51. Saudi Arabia Retail Touch Screen Display Revenue, (US$, Mn), 2020-2032
Figure 52. UAE Retail Touch Screen Display Revenue, (US$, Mn), 2020-2032
Figure 53. Global Retail Touch Screen Display Production Capacity (K Units), 2020-2032
Figure 54. The Percentage of Production Retail Touch Screen Display by Region, 2024 VS 2032
Figure 55. Retail Touch Screen Display Industry Value Chain
Figure 56. Marketing Channels