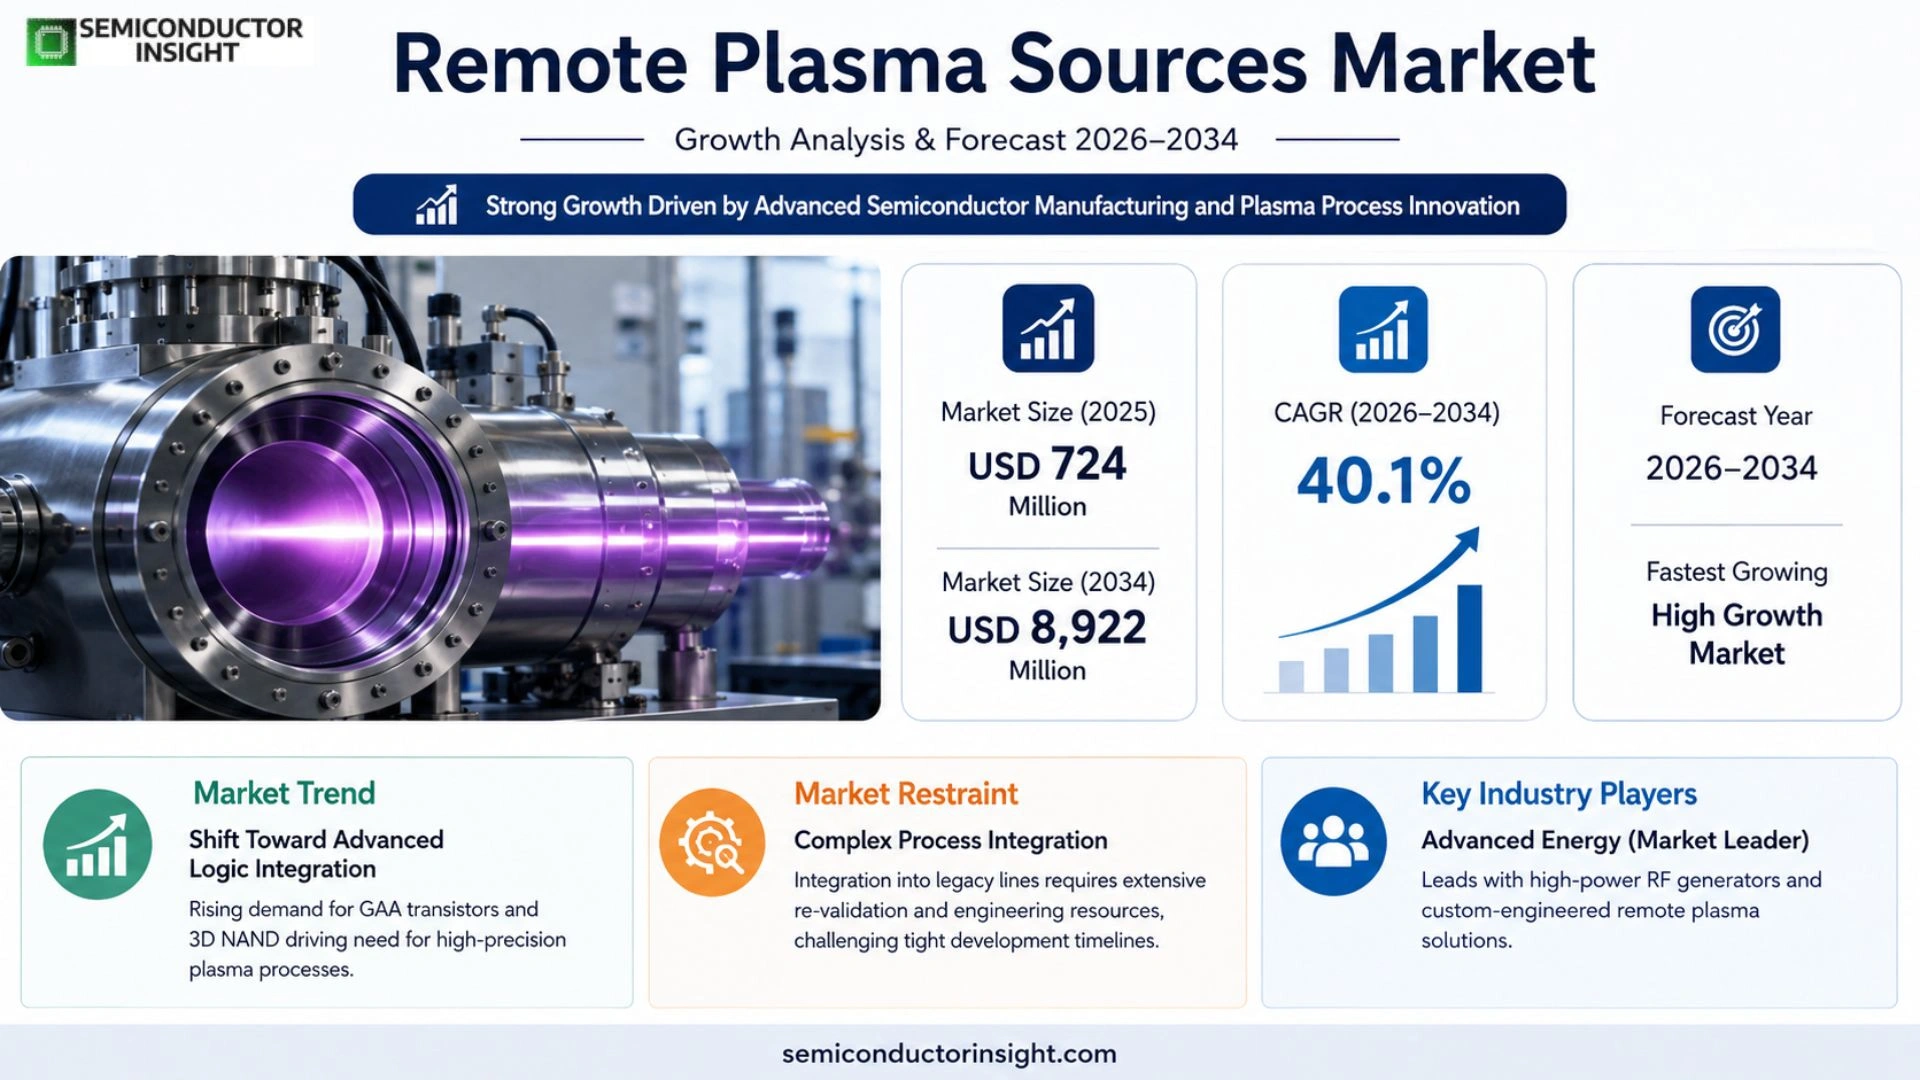
Remote Plasma Sources Market, Emerging Trends, Technological Advancements, and Business Strategies 2026-2034

Remote Plasma Sources Market size was valued at USD 507 million in 2026. The market is projected to grow from USD 507 million in 2026 to USD 2,438 million by 2033, exhibiting a CAGR of 25.4% during the forecast period.

PDF Icon Download Sample Report PDF
  • Quick Dispatch

    All Orders

  • Secure Payment

    100% Secure Payment

Price range: $1,500.00 through $4,250.00

Clear

Market Insights

Global Remote Plasma Sources Market size was valued at USD 507 million in 2026. The market is projected to grow from USD 507 million in 2026 to USD 2,438 million by 2033, exhibiting a CAGR of 25.4% during the forecast period.

A remote plasma source (RPS) is a device used to generate plasma for surface treatment, material modification, and thin film deposition in vacuum environments. Unlike traditional plasma sources, RPS generates plasma remotely and delivers it to the target surface without direct contact, minimizing thermal and chemical damage while ensuring uniform treatment. This technology is widely adopted in semiconductor manufacturing, where precision and process stability are critical.

The market growth is driven by increasing demand for advanced semiconductor fabrication processes such as atomic layer deposition (ALD), etching, and cleaning applications. In 2026, global production of remote plasma sources reached approximately 15,768 units, with an average price of USD 35,230 per unit and a gross profit margin of around 42%. Key players like Advanced Energy, MKS Instruments, and Veeco are investing in R&D to enhance system efficiency and expand their product portfolios. The shift toward next-generation semiconductor architectures like GAA (gate-all-around) and ultra-high-layer 3D NAND further accelerates adoption due to RPS’s superior process control capabilities.

Xyz market size & forecast

MARKET DRIVERS

Increasing Demand in Semiconductor Manufacturing

Remote Plasma Sources Market is experiencing steady growth due to heightened demand in semiconductor fabrication. Advanced chip manufacturing processes, including atomic layer deposition (ALD) and plasma-enhanced chemical vapor deposition (PECVD), heavily rely on remote plasma sources for precision and efficiency. Global semiconductor industry, valued at over USD 600 billion, continues to drive adoption.

Growth in Renewable Energy Applications

Solar panel production utilizes remote plasma technology for thin-film deposition, enhancing energy efficiency. With solar energy capacity expected to grow by 8% annually, manufacturers are investing in advanced plasma systems to meet production demands while reducing environmental impact.

Emerging applications in medical device sterilization and automotive coatings further contribute to market expansion, with plasma technology offering superior performance over traditional methods.

MARKET CHALLENGES

High Initial Investment Requirements

The capital-intensive nature of remote plasma source systems presents a significant barrier to entry for small and medium enterprises. Advanced systems can cost upwards of USD 500,000, requiring substantial ROI justification.

Other Challenges

Technical Complexity
Operating and maintaining remote plasma sources demands specialized expertise, creating a skills gap that slows adoption in emerging markets.

Regulatory Compliance
Stringent safety and emissions standards for plasma-based processes increase compliance costs by approximately 15-20% for equipment manufacturers.

MARKET RESTRAINTS

Supply Chain Disruptions for Critical Components

Remote Plasma Sources Market faces constraints from semiconductor shortages affecting RF generators and quartz components. Lead times for precision parts have extended to 6-8 months, delaying system deliveries.

MARKET OPPORTUNITIES

Expansion in Emerging Economies

Countries like India and Brazil are establishing semiconductor fabrication facilities, creating a USD 2.1 billion opportunity for remote plasma source providers by 2027. Government incentives for local electronics manufacturing further accelerate demand.

Development of Hybrid Plasma Technologies

Innovations combining remote plasma sources with AI-driven process control are gaining traction, improving yield rates by 12-15% in production environments. This technological leap opens new application avenues in aerospace and biomedical sectors.
Remote Plasma Sources Market Trends

Transition from Optional to Essential Modules in Semiconductor Manufacturing

Remote Plasma Sources Market is witnessing a significant transformation as these devices evolve from supplemental equipment to fundamental components in advanced semiconductor processes. With a projected market value of USD 2.43 billion by 2033, growing at a 25.4% CAGR, RPS adoption is accelerating due to semiconductor industry demands for precise, low-damage plasma processing. The technology’s ability to decouple plasma generation from wafer surfaces reduces thermal and chemical damage during ALD, cleaning, and surface modification processes.

Other Trends

Process Determinism in Advanced Nodes

As semiconductor structures become more complex with GAA transistors and high-layer 3D NAND, Remote Plasma Sources are emerging as critical enablers of process consistency. The market is seeing increased demand for RPS solutions that offer better control over free radical concentrations and reduced ion bombardment compared to traditional in-situ plasma systems. This is particularly crucial for atomic layer deposition applications where process window stability directly impacts yield rates.

Product Segmentation and Regional Growth

Remote Plasma Sources Market segmentation shows clear preferences, with microwave-based systems holding 38% market share and planar RPS configurations leading in structural forms. Geographically, Asia dominates with 62% market share in 2026, driven by semiconductor fabrication expansion in China, South Korea, and Taiwan. CVD applications account for the largest application segment at 45%, followed by etching processes at 32% market share. Major suppliers like MKS Instruments and Advanced Energy are investing in system integration capabilities to address growing demand for complete plasma processing solutions.

COMPETITIVE LANDSCAPE

Key Industry Players

Remote Plasma Sources Market Dominated by Specialized Semiconductor Equipment Providers

Remote Plasma Sources Market is consolidated among a few specialized equipment manufacturers with strong R&D capabilities. Advanced Energy and MKS Instruments collectively hold over 35% global market share, leveraging their extensive semiconductor equipment portfolios and partnerships with leading foundries. These companies dominate high-end applications like ALD and CVD through proprietary RF and microwave excitation technologies that ensure plasma uniformity and process repeatability.

Niche players like Samco-ucp and Muegge GmbH are gaining traction with innovative solutions for memory and logic device manufacturing. Emerging Chinese suppliers such as Shenzhou Semiconductor and Shanghai Lizhao Technology are expanding their presence through cost-competitive offerings, supported by government initiatives for semiconductor equipment localization. The competitive intensity is increasing as players develop integrated systems combining remote plasma sources with advanced process control software.

List of Key Remote Plasma Sources Companies Profiled

  • Advanced Energy
  • New Power Plasma
  • Samco-ucp
  • MKS Instruments
  • Muegge GmbH
  • PIE Scientific
  • EN2CORE Technology
  • Veeco
  • Shenzhou Semiconductor
  • CSL
  • Shanghai Lizhao Technology
  • Plasma-Therm
  • Oxford Instruments
  • ULVAC Technologies
  • SPTS Technologies

Segment Analysis:

Segment Category Sub-Segments Key Insights
By Type
  • Remote Plasma Cleaner
  • Remote Plasma Processor
Remote Plasma Processor dominates as the leading segment due to:

  • Higher adoption in semiconductor manufacturing for ALD and CVD processes
  • Superior capability for atomic-level material modification
  • Growing demand for precise surface treatment in advanced node fabrication
By Application
  • CVD
  • ALD/LPCVD
  • ETCH
  • Others
ALD/LPCVD emerges as the key growth segment because:

  • Critical for advanced semiconductor nodes requiring atomic layer precision
  • Reduced plasma damage compared to traditional methods
  • Increasing adoption in 3D NAND and GAA structure manufacturing
By End User
  • Semiconductor Foundries
  • IDMs (Integrated Device Manufacturers)
  • Research Institutions
Semiconductor Foundries demonstrate strongest demand:

  • High-volume production environment requires consistent RPS performance
  • Leading adopters of advanced process technologies
  • Increasing investment in next-generation fabrication facilities
By Technology
  • Radio Frequency RPS
  • Microwave RPS
  • Other Technologies
Radio Frequency RPS maintains technology leadership:

  • Proven reliability in semiconductor manufacturing environments
  • Better control over plasma generation parameters
  • Wider adoption across established and emerging applications
By Process Integration
  • Standalone Systems
  • Integrated Modules
  • Cluster Tool Configurations
Integrated Modules show strongest growth potential:

  • Increasing demand for process flow optimization
  • Better system-level synergy with other semiconductor equipment
  • Space efficiency benefits in modern fabrication facilities

Regional Analysis: Remote Plasma Sources Market

Asia-Pacific

The Asia-Pacific region dominates the Remote Plasma Sources market, driven by semiconductor manufacturing expansion in countries like South Korea, Taiwan, and China. This region benefits from strong government support for electronics manufacturing and increasing investments in flat panel display production. Major OEMs are establishing R&D centers in Japan and Singapore, fostering technology innovation in plasma source components. The growing adoption of remote plasma cleaning systems in photovoltaic manufacturing further propels market growth. With established semiconductor clusters in Shanghai and Hsinchu, equipment manufacturers are developing advanced plasma sources tailored for next-generation chip fabrication processes. The region’s competitive manufacturing costs and skilled workforce continue attracting global semiconductor equipment suppliers.

Semiconductor Equipment Hub
Taiwan and South Korea lead in semiconductor equipment adoption, with foundries increasingly using remote plasma sources for wafer cleaning and chamber conditioning. The maturity of 300mm wafer fabs drives specialized plasma system requirements.
Government Initiatives
China’s Made in China 2026 program supports local semiconductor equipment development, creating opportunities for domestic remote plasma source manufacturers. Subsidies for display panel production further stimulate market growth.
Technology Innovation
Japanese manufacturers lead in developing compact, high-efficiency remote plasma sources with improved power delivery systems. Collaborative R&D between equipment makers and semiconductor firms drives product innovation.
Supply Chain Advantages
The region’s established semiconductor ecosystem ensures quick access to components for plasma source assembly. Localized production reduces lead times and costs for equipment manufacturers compared to other regions.

North America
North America remains a key innovation center for remote plasma source technologies, with California’s Silicon Valley housing specialized R&D facilities. The region benefits from strong university-industry collaborations in plasma physics and material science. Aerospace and defense applications drive demand for specialized plasma cleaning systems. Leading semiconductor equipment manufacturers maintain technology development centers in Oregon and Arizona, focusing on next-generation plasma sources for advanced packaging applications.

Europe
Europe exhibits steady growth in the Remote Plasma Sources market, particularly in Germany and the Netherlands where semiconductor equipment clusters exist. The region focuses on precision engineering solutions with Dutch firms leading in specialized plasma systems for EUV lithography. Environmental regulations drive adoption of cleaner plasma technologies in industrial applications. Collaborative research initiatives between equipment makers and research institutions foster innovation in low-power plasma sources.

Middle East & Africa
The Middle East shows emerging potential in the Remote Plasma Sources market, particularly for oil and gas applications. Plasma surface treatment systems gain traction in petrochemical plants for equipment maintenance. Limited local semiconductor manufacturing restricts growth in microelectronics applications, though research institutions in Saudi Arabia are exploring plasma technologies for specialized industrial uses.

South America
South America represents a developing market for remote plasma sources, with Brazil showing potential in industrial cleaning applications. The region’s growing electronics manufacturing sector creates opportunities for basic plasma cleaning systems. Challenges include limited local technical expertise and reliance on imported semiconductor equipment, though regional trade agreements may improve technology access.

Report Scope

This market research report provides a comprehensive analysis of the Remote Plasma Sources Market, covering the forecast period 2026–2033. It offers detailed insights into market dynamics, technological advancements, competitive landscape, and key trends shaping the industry.

Key focus areas of the report include:

  • Market Overview: The report begins with an overview outlining its current market scenario, key growth indicators, and industry transformation drivers. It discusses macroeconomic factors, demand–supply balance, regulatory landscape, and the strategic role of semiconductors in powering advancements across industries such as automotive, telecommunications, consumer electronics, and industrial automation.
  • Market Size & Forecast: Historical data and future projections for revenue, unit shipments, and market value across major regions and segments.
  • Segmentation Analysis: Detailed breakdown by product type, technology, application, and end-user industry to identify high-growth segments and investment opportunities.
  • Regional Insights: Insights into market performance across North America, Europe, Asia, South America, and the Middle East & Africa, including country-level analysis where relevant.
  • Competitive Landscape: Profiles of leading market participants, including their product offerings, R&D focus, manufacturing capacity, pricing strategies, and recent developments such as mergers, acquisitions, and partnerships.
  • Technology Trends & Innovation: Assessment of emerging technologies, integration of AI/IoT, semiconductor design trends, fabrication techniques, and evolving industry standards.
  • Market Drivers & Restraints: Evaluation of factors driving market growth along with challenges, supply chain constraints, regulatory issues, and market-entry barriers.
  • Stakeholder Insights: Insights for component suppliers, OEMs, system integrators, investors, and policymakers regarding the evolving ecosystem and strategic opportunities.

Primary and secondary research methods are employed, including interviews with industry experts, data from verified sources, and real-time market intelligence to ensure the accuracy and reliability of the insights presented.

FREQUENTLY ASKED QUESTIONS:

What is the current market size of Remote Plasma Sources Market?

-> Remote Plasma Sources Market size was valued at USD 507 million in 2026. The market is projected to grow from USD 507 million in 2026 to USD 2,438 million by 2033, exhibiting a CAGR of 25.4% during the forecast period.

Which key companies operate in Remote Plasma Sources Market?

-> Key players include Advanced Energy, New Power Plasma, Samco-ucp, MKS Instruments, Muegge GmbH, PIE Scientific, EN2CORE Technology, Veeco, Shenzhou Semiconductor, CSL, and Shanghai Lizhao Technology, among others.

What are the key growth drivers?

-> Key growth drivers include increasing penetration of advanced processes, expansion of semiconductor applications, enhanced equipment localization, and demand for low plasma damage and high free radical controllability in semiconductor manufacturing.

Which region dominates the market?

-> Asia is the dominant market for Remote Plasma Sources, with key contributions from China, Japan, and South Korea.

What are the emerging trends?

-> Emerging trends include integration into ALD/LPCVD processes, evolution towards GAA structures in advanced logic devices, and increasing focus on reliability and system-level synergy capabilities.

Remote Plasma Sources Market, Emerging Trends, Technological Advancements, and Business Strategies 2026-2034

Get Sample Report PDF for Exclusive Insights

Report Sample Includes

  • Table of Contents
  • List of Tables & Figures
  • Charts, Research Methodology, and more...

PDF Icon Download Sample Report PDF

Download Sample Report

Table of Content

1 Introduction to Research & Analysis Reports
1.1 Remote Plasma Sources Market Definition
1.2 Market Segments
1.2.1 Segment by Type
1.2.2 Segment by Application
1.3 Global Remote Plasma Sources Market Overview
1.4 Features & Benefits of This Report
1.5 Methodology & Sources of Information
1.5.1 Research Methodology
1.5.2 Research Process
1.5.3 Base Year
1.5.4 Report Assumptions & Caveats
2 Global Remote Plasma Sources Overall Market Size
2.1 Global Remote Plasma Sources Market Size: 2024 VS 2031
2.2 Global Remote Plasma Sources Market Size, Prospects & Forecasts: 2020-2031
2.3 Global Remote Plasma Sources Sales: 2020-2031
3 Company Landscape
3.1 Top Remote Plasma Sources Players in Global Market
3.2 Top Global Remote Plasma Sources Companies Ranked by Revenue
3.3 Global Remote Plasma Sources Revenue by Companies
3.4 Global Remote Plasma Sources Sales by Companies
3.5 Global Remote Plasma Sources Price by Manufacturer (2020-2025)
3.6 Top 3 and Top 5 Remote Plasma Sources Companies in Global Market, by Revenue in 2024
3.7 Global Manufacturers Remote Plasma Sources Product Type
3.8 Tier 1, Tier 2, and Tier 3 Remote Plasma Sources Players in Global Market
3.8.1 List of Global Tier 1 Remote Plasma Sources Companies
3.8.2 List of Global Tier 2 and Tier 3 Remote Plasma Sources Companies
4 Sights by Product
4.1 Overview
4.1.1 Segment by Type – Global Remote Plasma Sources Market Size Markets, 2024 & 2031
4.1.2 Remote Plasma Cleaner
4.1.3 Remote Plasma Processor
4.2 Segment by Type – Global Remote Plasma Sources Revenue & Forecasts
4.2.1 Segment by Type – Global Remote Plasma Sources Revenue, 2020-2025
4.2.2 Segment by Type – Global Remote Plasma Sources Revenue, 2026-2031
4.2.3 Segment by Type – Global Remote Plasma Sources Revenue Market Share, 2020-2031
4.3 Segment by Type – Global Remote Plasma Sources Sales & Forecasts
4.3.1 Segment by Type – Global Remote Plasma Sources Sales, 2020-2025
4.3.2 Segment by Type – Global Remote Plasma Sources Sales, 2026-2031
4.3.3 Segment by Type – Global Remote Plasma Sources Sales Market Share, 2020-2031
4.4 Segment by Type – Global Remote Plasma Sources Price (Manufacturers Selling Prices), 2020-2031
5 Sights by Application
5.1 Overview
5.1.1 Segment by Application – Global Remote Plasma Sources Market Size, 2024 & 2031
5.1.2 CVD
5.1.3 ALD/LPCVD
5.1.4 ETCH
5.1.5 Others
5.2 Segment by Application – Global Remote Plasma Sources Revenue & Forecasts
5.2.1 Segment by Application – Global Remote Plasma Sources Revenue, 2020-2025
5.2.2 Segment by Application – Global Remote Plasma Sources Revenue, 2026-2031
5.2.3 Segment by Application – Global Remote Plasma Sources Revenue Market Share, 2020-2031
5.3 Segment by Application – Global Remote Plasma Sources Sales & Forecasts
5.3.1 Segment by Application – Global Remote Plasma Sources Sales, 2020-2025
5.3.2 Segment by Application – Global Remote Plasma Sources Sales, 2026-2031
5.3.3 Segment by Application – Global Remote Plasma Sources Sales Market Share, 2020-2031
5.4 Segment by Application – Global Remote Plasma Sources Price (Manufacturers Selling Prices), 2020-2031
6 Sights by Region
6.1 By Region – Global Remote Plasma Sources Market Size, 2024 & 2031
6.2 By Region – Global Remote Plasma Sources Revenue & Forecasts
6.2.1 By Region – Global Remote Plasma Sources Revenue, 2020-2025
6.2.2 By Region – Global Remote Plasma Sources Revenue, 2026-2031
6.2.3 By Region – Global Remote Plasma Sources Revenue Market Share, 2020-2031
6.3 By Region – Global Remote Plasma Sources Sales & Forecasts
6.3.1 By Region – Global Remote Plasma Sources Sales, 2020-2025
6.3.2 By Region – Global Remote Plasma Sources Sales, 2026-2031
6.3.3 By Region – Global Remote Plasma Sources Sales Market Share, 2020-2031
6.4 North America
6.4.1 By Country – North America Remote Plasma Sources Revenue, 2020-2031
6.4.2 By Country – North America Remote Plasma Sources Sales, 2020-2031
6.4.3 United States Remote Plasma Sources Market Size, 2020-2031
6.4.4 Canada Remote Plasma Sources Market Size, 2020-2031
6.4.5 Mexico Remote Plasma Sources Market Size, 2020-2031
6.5 Europe
6.5.1 By Country – Europe Remote Plasma Sources Revenue, 2020-2031
6.5.2 By Country – Europe Remote Plasma Sources Sales, 2020-2031
6.5.3 Germany Remote Plasma Sources Market Size, 2020-2031
6.5.4 France Remote Plasma Sources Market Size, 2020-2031
6.5.5 U.K. Remote Plasma Sources Market Size, 2020-2031
6.5.6 Italy Remote Plasma Sources Market Size, 2020-2031
6.5.7 Russia Remote Plasma Sources Market Size, 2020-2031
6.5.8 Nordic Countries Remote Plasma Sources Market Size, 2020-2031
6.5.9 Benelux Remote Plasma Sources Market Size, 2020-2031
6.6 Asia
6.6.1 By Region – Asia Remote Plasma Sources Revenue, 2020-2031
6.6.2 By Region – Asia Remote Plasma Sources Sales, 2020-2031
6.6.3 China Remote Plasma Sources Market Size, 2020-2031
6.6.4 Japan Remote Plasma Sources Market Size, 2020-2031
6.6.5 South Korea Remote Plasma Sources Market Size, 2020-2031
6.6.6 Southeast Asia Remote Plasma Sources Market Size, 2020-2031
6.6.7 India Remote Plasma Sources Market Size, 2020-2031
6.7 South America
6.7.1 By Country – South America Remote Plasma Sources Revenue, 2020-2031
6.7.2 By Country – South America Remote Plasma Sources Sales, 2020-2031
6.7.3 Brazil Remote Plasma Sources Market Size, 2020-2031
6.7.4 Argentina Remote Plasma Sources Market Size, 2020-2031
6.8 Middle East & Africa
6.8.1 By Country – Middle East & Africa Remote Plasma Sources Revenue, 2020-2031
6.8.2 By Country – Middle East & Africa Remote Plasma Sources Sales, 2020-2031
6.8.3 Turkey Remote Plasma Sources Market Size, 2020-2031
6.8.4 Israel Remote Plasma Sources Market Size, 2020-2031
6.8.5 Saudi Arabia Remote Plasma Sources Market Size, 2020-2031
6.8.6 UAE Remote Plasma Sources Market Size, 2020-2031
7 Manufacturers & Brands Profiles
7.1 Advanced Energy
7.1.1 Advanced Energy Company Summary
7.1.2 Advanced Energy Business Overview
7.1.3 Advanced Energy Remote Plasma Sources Major Product Offerings
7.1.4 Advanced Energy Remote Plasma Sources Sales and Revenue in Global (2020-2025)
7.1.5 Advanced Energy Key News & Latest Developments
7.2 New Power Plasma
7.2.1 New Power Plasma Company Summary
7.2.2 New Power Plasma Business Overview
7.2.3 New Power Plasma Remote Plasma Sources Major Product Offerings
7.2.4 New Power Plasma Remote Plasma Sources Sales and Revenue in Global (2020-2025)
7.2.5 New Power Plasma Key News & Latest Developments
7.3 Samco-ucp
7.3.1 Samco-ucp Company Summary
7.3.2 Samco-ucp Business Overview
7.3.3 Samco-ucp Remote Plasma Sources Major Product Offerings
7.3.4 Samco-ucp Remote Plasma Sources Sales and Revenue in Global (2020-2025)
7.3.5 Samco-ucp Key News & Latest Developments
7.4 MKS Instruments
7.4.1 MKS Instruments Company Summary
7.4.2 MKS Instruments Business Overview
7.4.3 MKS Instruments Remote Plasma Sources Major Product Offerings
7.4.4 MKS Instruments Remote Plasma Sources Sales and Revenue in Global (2020-2025)
7.4.5 MKS Instruments Key News & Latest Developments
7.5 Muegge GmbH
7.5.1 Muegge GmbH Company Summary
7.5.2 Muegge GmbH Business Overview
7.5.3 Muegge GmbH Remote Plasma Sources Major Product Offerings
7.5.4 Muegge GmbH Remote Plasma Sources Sales and Revenue in Global (2020-2025)
7.5.5 Muegge GmbH Key News & Latest Developments
7.6 PIE Scientific
7.6.1 PIE Scientific Company Summary
7.6.2 PIE Scientific Business Overview
7.6.3 PIE Scientific Remote Plasma Sources Major Product Offerings
7.6.4 PIE Scientific Remote Plasma Sources Sales and Revenue in Global (2020-2025)
7.6.5 PIE Scientific Key News & Latest Developments
7.7 Adtec Plasma Technology
7.7.1 Adtec Plasma Technology Company Summary
7.7.2 Adtec Plasma Technology Business Overview
7.7.3 Adtec Plasma Technology Remote Plasma Sources Major Product Offerings
7.7.4 Adtec Plasma Technology Remote Plasma Sources Sales and Revenue in Global (2020-2025)
7.7.5 Adtec Plasma Technology Key News & Latest Developments
8 Global Remote Plasma Sources Production Capacity, Analysis
8.1 Global Remote Plasma Sources Production Capacity, 2020-2031
8.2 Remote Plasma Sources Production Capacity of Key Manufacturers in Global Market
8.3 Global Remote Plasma Sources Production by Region
9 Key Market Trends, Opportunity, Drivers and Restraints
9.1 Market Opportunities & Trends
9.2 Market Drivers
9.3 Market Restraints
10 Remote Plasma Sources Supply Chain Analysis
10.1 Remote Plasma Sources Industry Value Chain
10.2 Remote Plasma Sources Upstream Market
10.3 Remote Plasma Sources Downstream and Clients
10.4 Marketing Channels Analysis
10.4.1 Marketing Channels
10.4.2 Remote Plasma Sources Distributors and Sales Agents in Global
11 Conclusion
12 Appendix
12.1 Note
12.2 Examples of Clients
12.3 DisclaimerList of Tables
Table 1. Key Players of Remote Plasma Sources in Global Market
Table 2. Top Remote Plasma Sources Players in Global Market, Ranking by Revenue (2024)
Table 3. Global Remote Plasma Sources Revenue by Companies, (US$, Mn), 2020-2025
Table 4. Global Remote Plasma Sources Revenue Share by Companies, 2020-2025
Table 5. Global Remote Plasma Sources Sales by Companies, (Units), 2020-2025
Table 6. Global Remote Plasma Sources Sales Share by Companies, 2020-2025
Table 7. Key Manufacturers Remote Plasma Sources Price (2020-2025) & (K US$/Unit)
Table 8. Global Manufacturers Remote Plasma Sources Product Type
Table 9. List of Global Tier 1 Remote Plasma Sources Companies, Revenue (US$, Mn) in 2024 and Market Share
Table 10. List of Global Tier 2 and Tier 3 Remote Plasma Sources Companies, Revenue (US$, Mn) in 2024 and Market Share
Table 11. Segment by Type – Global Remote Plasma Sources Revenue, (US$, Mn), 2024 & 2031
Table 12. Segment by Type – Global Remote Plasma Sources Revenue (US$, Mn), 2020-2025
Table 13. Segment by Type – Global Remote Plasma Sources Revenue (US$, Mn), 2026-2031
Table 14. Segment by Type – Global Remote Plasma Sources Sales (Units), 2020-2025
Table 15. Segment by Type – Global Remote Plasma Sources Sales (Units), 2026-2031
Table 16. Segment by Application – Global Remote Plasma Sources Revenue, (US$, Mn), 2024 & 2031
Table 17. Segment by Application – Global Remote Plasma Sources Revenue, (US$, Mn), 2020-2025
Table 18. Segment by Application – Global Remote Plasma Sources Revenue, (US$, Mn), 2026-2031
Table 19. Segment by Application – Global Remote Plasma Sources Sales, (Units), 2020-2025
Table 20. Segment by Application – Global Remote Plasma Sources Sales, (Units), 2026-2031
Table 21. By Region – Global Remote Plasma Sources Revenue, (US$, Mn), 2025-2031
Table 22. By Region – Global Remote Plasma Sources Revenue, (US$, Mn), 2020-2025
Table 23. By Region – Global Remote Plasma Sources Revenue, (US$, Mn), 2026-2031
Table 24. By Region – Global Remote Plasma Sources Sales, (Units), 2020-2025
Table 25. By Region – Global Remote Plasma Sources Sales, (Units), 2026-2031
Table 26. By Country – North America Remote Plasma Sources Revenue, (US$, Mn), 2020-2025
Table 27. By Country – North America Remote Plasma Sources Revenue, (US$, Mn), 2026-2031
Table 28. By Country – North America Remote Plasma Sources Sales, (Units), 2020-2025
Table 29. By Country – North America Remote Plasma Sources Sales, (Units), 2026-2031
Table 30. By Country – Europe Remote Plasma Sources Revenue, (US$, Mn), 2020-2025
Table 31. By Country – Europe Remote Plasma Sources Revenue, (US$, Mn), 2026-2031
Table 32. By Country – Europe Remote Plasma Sources Sales, (Units), 2020-2025
Table 33. By Country – Europe Remote Plasma Sources Sales, (Units), 2026-2031
Table 34. By Region – Asia Remote Plasma Sources Revenue, (US$, Mn), 2020-2025
Table 35. By Region – Asia Remote Plasma Sources Revenue, (US$, Mn), 2026-2031
Table 36. By Region – Asia Remote Plasma Sources Sales, (Units), 2020-2025
Table 37. By Region – Asia Remote Plasma Sources Sales, (Units), 2026-2031
Table 38. By Country – South America Remote Plasma Sources Revenue, (US$, Mn), 2020-2025
Table 39. By Country – South America Remote Plasma Sources Revenue, (US$, Mn), 2026-2031
Table 40. By Country – South America Remote Plasma Sources Sales, (Units), 2020-2025
Table 41. By Country – South America Remote Plasma Sources Sales, (Units), 2026-2031
Table 42. By Country – Middle East & Africa Remote Plasma Sources Revenue, (US$, Mn), 2020-2025
Table 43. By Country – Middle East & Africa Remote Plasma Sources Revenue, (US$, Mn), 2026-2031
Table 44. By Country – Middle East & Africa Remote Plasma Sources Sales, (Units), 2020-2025
Table 45. By Country – Middle East & Africa Remote Plasma Sources Sales, (Units), 2026-2031
Table 46. Advanced Energy Company Summary
Table 47. Advanced Energy Remote Plasma Sources Product Offerings
Table 48. Advanced Energy Remote Plasma Sources Sales (Units), Revenue (US$, Mn) and Average Price (K US$/Unit) & (2020-2025)
Table 49. Advanced Energy Key News & Latest Developments
Table 50. New Power Plasma Company Summary
Table 51. New Power Plasma Remote Plasma Sources Product Offerings
Table 52. New Power Plasma Remote Plasma Sources Sales (Units), Revenue (US$, Mn) and Average Price (K US$/Unit) & (2020-2025)
Table 53. New Power Plasma Key News & Latest Developments
Table 54. Samco-ucp Company Summary
Table 55. Samco-ucp Remote Plasma Sources Product Offerings
Table 56. Samco-ucp Remote Plasma Sources Sales (Units), Revenue (US$, Mn) and Average Price (K US$/Unit) & (2020-2025)
Table 57. Samco-ucp Key News & Latest Developments
Table 58. MKS Instruments Company Summary
Table 59. MKS Instruments Remote Plasma Sources Product Offerings
Table 60. MKS Instruments Remote Plasma Sources Sales (Units), Revenue (US$, Mn) and Average Price (K US$/Unit) & (2020-2025)
Table 61. MKS Instruments Key News & Latest Developments
Table 62. Muegge GmbH Company Summary
Table 63. Muegge GmbH Remote Plasma Sources Product Offerings
Table 64. Muegge GmbH Remote Plasma Sources Sales (Units), Revenue (US$, Mn) and Average Price (K US$/Unit) & (2020-2025)
Table 65. Muegge GmbH Key News & Latest Developments
Table 66. PIE Scientific Company Summary
Table 67. PIE Scientific Remote Plasma Sources Product Offerings
Table 68. PIE Scientific Remote Plasma Sources Sales (Units), Revenue (US$, Mn) and Average Price (K US$/Unit) & (2020-2025)
Table 69. PIE Scientific Key News & Latest Developments
Table 70. Adtec Plasma Technology Company Summary
Table 71. Adtec Plasma Technology Remote Plasma Sources Product Offerings
Table 72. Adtec Plasma Technology Remote Plasma Sources Sales (Units), Revenue (US$, Mn) and Average Price (K US$/Unit) & (2020-2025)
Table 73. Adtec Plasma Technology Key News & Latest Developments
Table 74. Remote Plasma Sources Capacity of Key Manufacturers in Global Market, 2023-2025 (Units)
Table 75. Global Remote Plasma Sources Capacity Market Share of Key Manufacturers, 2023-2025
Table 76. Global Remote Plasma Sources Production by Region, 2020-2025 (Units)
Table 77. Global Remote Plasma Sources Production by Region, 2026-2031 (Units)
Table 78. Remote Plasma Sources Market Opportunities & Trends in Global Market
Table 79. Remote Plasma Sources Market Drivers in Global Market
Table 80. Remote Plasma Sources Market Restraints in Global Market
Table 81. Remote Plasma Sources Raw Materials
Table 82. Remote Plasma Sources Raw Materials Suppliers in Global Market
Table 83. Typical Remote Plasma Sources Downstream
Table 84. Remote Plasma Sources Downstream Clients in Global Market
Table 85. Remote Plasma Sources Distributors and Sales Agents in Global Market

List of Figures
Figure 1. Remote Plasma Sources Product Picture
Figure 2. Remote Plasma Sources Segment by Type in 2024
Figure 3. Remote Plasma Sources Segment by Application in 2024
Figure 4. Global Remote Plasma Sources Market Overview: 2024
Figure 5. Key Caveats
Figure 6. Global Remote Plasma Sources Market Size: 2024 VS 2031 (US$, Mn)
Figure 7. Global Remote Plasma Sources Revenue: 2020-2031 (US$, Mn)
Figure 8. Remote Plasma Sources Sales in Global Market: 2020-2031 (Units)
Figure 9. The Top 3 and 5 Players Market Share by Remote Plasma Sources Revenue in 2024
Figure 10. Segment by Type – Global Remote Plasma Sources Revenue, (US$, Mn), 2024 & 2031
Figure 11. Segment by Type – Global Remote Plasma Sources Revenue Market Share, 2020-2031
Figure 12. Segment by Type – Global Remote Plasma Sources Sales Market Share, 2020-2031
Figure 13. Segment by Type – Global Remote Plasma Sources Price (K US$/Unit), 2020-2031
Figure 14. Segment by Application – Global Remote Plasma Sources Revenue, (US$, Mn), 2024 & 2031
Figure 15. Segment by Application – Global Remote Plasma Sources Revenue Market Share, 2020-2031
Figure 16. Segment by Application – Global Remote Plasma Sources Sales Market Share, 2020-2031
Figure 17. Segment by Application -Global Remote Plasma Sources Price (K US$/Unit), 2020-2031
Figure 18. By Region – Global Remote Plasma Sources Revenue, (US$, Mn), 2025 & 2031
Figure 19. By Region – Global Remote Plasma Sources Revenue Market Share, 2020 VS 2024 VS 2031
Figure 20. By Region – Global Remote Plasma Sources Revenue Market Share, 2020-2031
Figure 21. By Region – Global Remote Plasma Sources Sales Market Share, 2020-2031
Figure 22. By Country – North America Remote Plasma Sources Revenue Market Share, 2020-2031
Figure 23. By Country – North America Remote Plasma Sources Sales Market Share, 2020-2031
Figure 24. United States Remote Plasma Sources Revenue, (US$, Mn), 2020-2031
Figure 25. Canada Remote Plasma Sources Revenue, (US$, Mn), 2020-2031
Figure 26. Mexico Remote Plasma Sources Revenue, (US$, Mn), 2020-2031
Figure 27. By Country – Europe Remote Plasma Sources Revenue Market Share, 2020-2031
Figure 28. By Country – Europe Remote Plasma Sources Sales Market Share, 2020-2031
Figure 29. Germany Remote Plasma Sources Revenue, (US$, Mn), 2020-2031
Figure 30. France Remote Plasma Sources Revenue, (US$, Mn), 2020-2031
Figure 31. U.K. Remote Plasma Sources Revenue, (US$, Mn), 2020-2031
Figure 32. Italy Remote Plasma Sources Revenue, (US$, Mn), 2020-2031
Figure 33. Russia Remote Plasma Sources Revenue, (US$, Mn), 2020-2031
Figure 34. Nordic Countries Remote Plasma Sources Revenue, (US$, Mn), 2020-2031
Figure 35. Benelux Remote Plasma Sources Revenue, (US$, Mn), 2020-2031
Figure 36. By Region – Asia Remote Plasma Sources Revenue Market Share, 2020-2031
Figure 37. By Region – Asia Remote Plasma Sources Sales Market Share, 2020-2031
Figure 38. China Remote Plasma Sources Revenue, (US$, Mn), 2020-2031
Figure 39. Japan Remote Plasma Sources Revenue, (US$, Mn), 2020-2031
Figure 40. South Korea Remote Plasma Sources Revenue, (US$, Mn), 2020-2031
Figure 41. Southeast Asia Remote Plasma Sources Revenue, (US$, Mn), 2020-2031
Figure 42. India Remote Plasma Sources Revenue, (US$, Mn), 2020-2031
Figure 43. By Country – South America Remote Plasma Sources Revenue Market Share, 2020-2031
Figure 44. By Country – South America Remote Plasma Sources Sales, Market Share, 2020-2031
Figure 45. Brazil Remote Plasma Sources Revenue, (US$, Mn), 2020-2031
Figure 46. Argentina Remote Plasma Sources Revenue, (US$, Mn), 2020-2031
Figure 47. By Country – Middle East & Africa Remote Plasma Sources Revenue, Market Share, 2020-2031
Figure 48. By Country – Middle East & Africa Remote Plasma Sources Sales, Market Share, 2020-2031
Figure 49. Turkey Remote Plasma Sources Revenue, (US$, Mn), 2020-2031
Figure 50. Israel Remote Plasma Sources Revenue, (US$, Mn), 2020-2031
Figure 51. Saudi Arabia Remote Plasma Sources Revenue, (US$, Mn), 2020-2031
Figure 52. UAE Remote Plasma Sources Revenue, (US$, Mn), 2020-2031
Figure 53. Global Remote Plasma Sources Production Capacity (Units), 2020-2031
Figure 54. The Percentage of Production Remote Plasma Sources by Region, 2024 VS 2031
Figure 55. Remote Plasma Sources Industry Value Chain
Figure 56. Marketing Channels