MARKET INSIGHTS
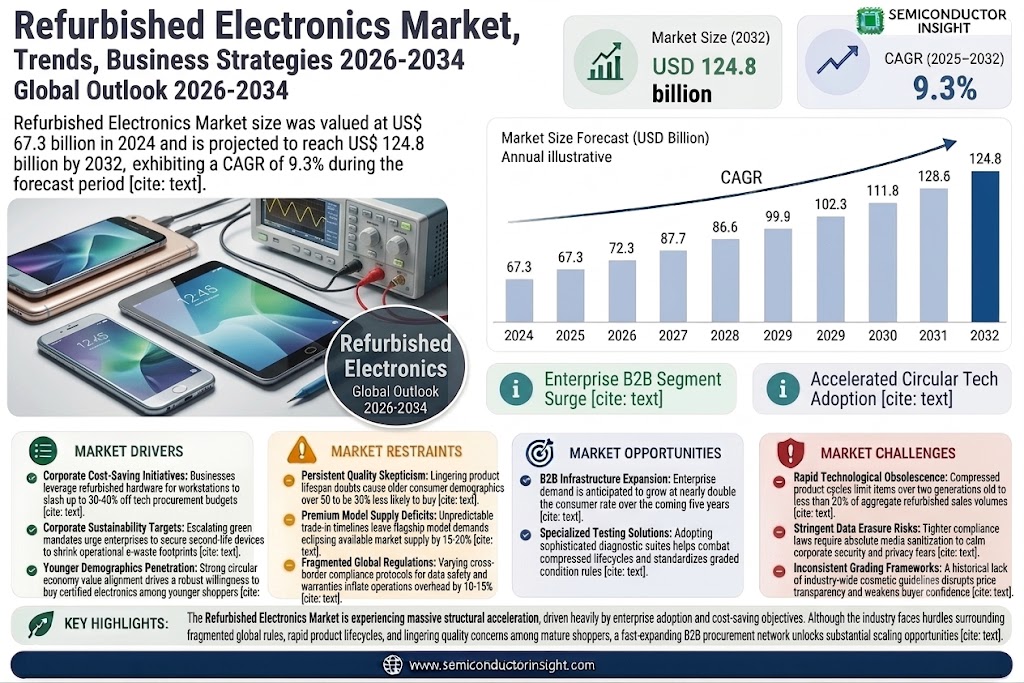
The global Refurbished Electronics Market size was valued at US$ 67.3 billion in 2024 and is projected to reach US$ 124.8 billion by 2032, at a CAGR of 9.3% during the forecast period 2025-2032.
Refurbished electronics are pre-owned devices that undergo rigorous testing, repairs, and quality checks to meet manufacturer standards before resale. These products span multiple categories including smartphones, laptops, wearables, home appliances, and gaming consoles. Unlike second-hand goods, refurbished electronics often come with warranties and certifications, offering consumers cost-effective alternatives to new devices without compromising performance.
The market is expanding rapidly due to increasing consumer preference for budget-friendly tech solutions, rising environmental consciousness, and stringent e-waste regulations. Smartphones dominate the segment, accounting for over 40% of market revenue in 2024, driven by frequent device upgrades and high repairability. Key players like Apple, Samsung, and Back Market are strengthening their refurbished portfolios through certified programs, while e-commerce platforms accelerate accessibility. North America leads regional adoption, but Asia-Pacific shows the highest growth potential due to expanding middle-class demand.
 MARKET DYNAMICS
MARKET DRIVERS
Growing Consumer Preference for Cost-Effective Electronics to Fuel Market Expansion
The refurbished electronics market is experiencing significant growth driven by consumers’ increasing preference for affordable yet high-quality devices. With the prices of new smartphones and laptops rising steadily, many budget-conscious buyers are turning to refurbished alternatives that offer similar functionality at significantly lower costs. For instance, premium refurbished smartphones are available at 30%-50% discounts compared to new devices while maintaining over 90% of their original functionality. This value proposition has led to the market growing at a compound annual growth rate exceeding 10% in recent years, with smartphones accounting for nearly 60% of total refurbished electronics sales volume.
Sustainability Concerns Boosting Adoption of Refurbished Devices
Environmental sustainability has emerged as a powerful driver for the refurbished electronics sector. The growing awareness about electronic waste – with over 50 million metric tons generated globally each year – is prompting both consumers and corporations to consider refurbished alternatives. Many buyers now view choosing refurbished devices as both an economic and environmental decision, as extending a device’s lifecycle significantly reduces its carbon footprint. Corporate sustainability programs are increasingly incorporating refurbished electronics procurement policies, with some companies reporting a 20-30% reduction in their technology carbon footprint through such initiatives.
E-Commerce Platform Expansion Creating New Market Access
The rise of specialized online marketplaces dedicated to refurbished electronics has dramatically improved market accessibility and consumer confidence. These platforms often provide certified refurbishment programs, extended warranties, and standardized quality grading systems that address previous concerns about buying used devices. Major e-commerce players have significantly increased their refurbished electronics offerings, with some platforms seeing year-over-year growth rates exceeding 40% in this category. The convenience of online purchasing combined with robust return policies has removed many barriers that previously hindered market growth.
MARKET RESTRAINTS
Persistent Quality Perception Issues Constraining Market Penetration
Despite significant improvements in refurbishment processes, lingering consumer doubts about product quality continue to limit market penetration. Many potential buyers remain hesitant due to concerns about device longevity, performance issues, or cosmetic imperfections. This perception gap is particularly pronounced among older demographics, with surveys showing that consumers over 50 are 30% less likely to consider refurbished electronics than younger buyers. While certification programs and warranties have helped alleviate some concerns, overcoming this deep-rooted skepticism remains an ongoing challenge for the industry.
Limited Availability of High-Demand Models
The refurbished market faces significant supply constraints, particularly for newer and premium models that command the highest resale values. Manufacturers’ release cycles and trade-in programs often create unpredictable supply patterns, making it difficult to maintain consistent inventories of popular devices. For example, demand for refurbished premium smartphones typically exceeds supply by 15-20%, creating a competitive market where prices for certain models approach new device levels. This supply-demand imbalance restricts market growth potential and can frustrate consumers seeking specific devices.
Regional Regulatory Variations Creating Market Fragmentation
Divergent regulatory standards across regions present logistical and compliance challenges for refurbished electronics providers. Different jurisdictions impose varying requirements for testing, certification, and warranty obligations, forcing companies to maintain multiple refurbishment protocols. These regulatory complexities can increase operational costs by 10-15% for multinational refurbishers and create barriers to market entry for smaller players. Furthermore, some regions impose restrictions on certain categories of refurbished electronics due to data security or environmental concerns, further fragmenting the global market landscape.
MARKET CHALLENGES
Managing Rapid Technological Obsolescence
The refurbished electronics market faces significant challenges from the accelerating pace of technological advancement. As manufacturers introduce new features and capability improvements at shorter intervals, the value proposition of refurbished devices diminishes more quickly. For instance, devices more than two generations old now account for less than 20% of refurbished sales, compared to 35% five years ago. This compressed lifecycle creates pressure on refurbishers to process devices more quickly while maintaining quality standards, often requiring investments in more sophisticated testing and refurbishment equipment.
Other Key Challenges
Data Security and Privacy Risks
Ensuring complete data erasure from returned devices remains a critical challenge, particularly as data protection regulations become more stringent. Even with advanced wiping techniques, lingering concerns about residual data potentially being recovered continue to deter some enterprise buyers from procuring refurbished devices.
Inconsistent Grading Standards
The lack of uniform grading standards across different sellers creates confusion in the market, with the same device often receiving different quality ratings from different refurbishers. This inconsistency undermines consumer confidence and makes direct price comparisons difficult, potentially slowing purchasing decisions.
MARKET OPPORTUNITIES
Enterprise Market Expansion Presents Significant Growth Potential
The corporate sector represents a largely untapped opportunity for refurbished electronics providers. Businesses are increasingly recognizing the cost savings potential of refurbished devices for employee workstations, with pilot programs showing 30-40% reductions in technology procurement costs. As corporations focus on both financial efficiency and sustainability goals, demand for enterprise-grade refurbished electronics is expected to grow at nearly double the consumer market rate over the next five years. Specialized business-to-business refurbishment programs that include volume discounts and customized support services are well positioned to capitalize on this trend.
Emerging Markets Offer Significant Untapped Potential
Developing economies present substantial growth opportunities as rising digital adoption coincides with budget constraints. In many emerging markets, refurbished electronics already account for 25-35% of total device sales, with demand driven predominantly by smartphone purchases. As these markets continue to mature and infrastructure improves, demand for refurbished computing devices and home electronics is expected to grow proportionally. Local refurbishment operations combined with affordable financing options could unlock significant market expansion in these regions.
Subscription and Rental Models Creating New Revenue Streams
The growing popularity of device-as-a-service models presents innovative opportunities for refurbished electronics providers. Subscription-based offerings that allow consumers and businesses to regularly upgrade their devices while returning older models create a predictable supply of inventory for refurbishment. Early adopters of these models have reported customer retention rates exceeding 70%, suggesting strong potential for sustainable growth. This approach not only generates recurring revenue but also helps smooth out supply chain volatility in the refurbished market.
REFURBISHED ELECTRONICS MARKET TRENDS
Sustainable Consumption and Cost-Effectiveness Driving Market Growth
The global refurbished electronics market has witnessed substantial growth, driven by increasing consumer preference for sustainable technology solutions and cost-effective alternatives to new devices. With the market projected to reach multimillion-dollar valuations by 2032, factors such as environmental consciousness, particularly among younger demographics, and a circular economy push have accelerated adoption. Smartphones represent the largest segment, accounting for over 40% of the total refurbished electronics revenue, as consumers seek high-end models at reduced prices. Moreover, stringent quality certification programs from major manufacturers like Apple and Samsung have improved consumer confidence in refurbished products, further propelling market expansion.
Other Trends
E-Commerce Platforms Revolutionizing Accessibility
The rapid digitization of retail has significantly boosted the refurbished electronics market, with online platforms capturing over 60% of total sales. Marketplaces such as Amazon Renewed, Back Market, and Overcart have streamlined the purchasing process by offering warranties, standardized testing procedures, and hassle-free returns. This shift towards online channels has enabled wider geographic reach, particularly in emerging markets where pricing sensitivity is high. Additionally, AI-driven recommendation engines now personalize refurbished product suggestions, enhancing customer experience and conversion rates for retailers.
Corporate Sustainability Initiatives Accelerating B2B Demand
Enterprise adoption of refurbished electronics is growing at nearly 15% CAGR, fueled by corporate sustainability goals and IT budget optimization strategies. Many Fortune 500 companies now include refurbished laptops, servers, and networking equipment in their procurement policies to reduce e-waste and carbon footprints. Telecom operators have emerged as key players in this space, offering certified pre-owned smartphones with subscription plans that appeal to cost-conscious businesses. While concerns about device longevity persist, technological advancements in battery replacement and component refurbishment have narrowed the performance gap between new and refurbished products by over 85%.
COMPETITIVE LANDSCAPE
Key Industry Players
Tech Giants and Specialized Firms Compete Through Quality Assurance and Sustainability Initiatives
The refurbished electronics market exhibits a dynamic competitive structure with both OEMs (Original Equipment Manufacturers) and dedicated refurbishment specialists vying for market share. Apple Inc. dominates the premium refurbished segment through its certified refurbishment program, maintaining approximately 12-15% of the global refurbished smartphone market as of 2024. The company’s strict quality standards and warranty offerings continue to set industry benchmarks.
Samsung Electronics and Dell Technologies have significantly expanded their refurbished operations in recent years, particularly in enterprise and education sectors. Samsung’s trade-in programs in North America and Europe contributed to a 22% year-over-year growth in its refurbished device sales in 2023.
Meanwhile, specialized platforms like Back Market and Overcart are disrupting traditional sales channels through tech-driven quality verification systems. Back Market’s recent $510 million funding round in 2024 highlights investor confidence in the certified refurbishment model.
The market also sees growing competition from e-commerce leaders, with Amazon Renewed capturing nearly 18% of online refurbished electronics sales globally. Their 90-day return policy and rigorous testing procedures have helped build consumer trust in refurbished products.
List of Key Refurbished Electronics Market Players
- Apple Inc. (U.S.)
- Acer Inc. (Taiwan)
- Back Market (France)
- Overcart (India)
- Dell Technologies (U.S.)
- HP Inc. (U.S.)
- Amazon.com, Inc. (U.S.)
- ASUSTeK Computer (Taiwan)
- Samsung Electronics (South Korea)
- Lenovo Group (China)
- Reboot Systems India Private (India)
Segment Analysis:
By Type
Smartphones Segment Leads the Market Due to High Consumer Demand and Frequent Product Launches
The market is segmented based on type into:
- Smartphones
- Wearable Devices
- Subtypes: Smartwatches, Fitness Trackers, and others
- Computing Devices
- Subtypes: Laptops, Tablets, and others
- Home Appliances
- Sound and Vision
- Gaming Consoles
By Application
Online Stores Segment Dominates Due to Growing E-Commerce Penetration and Convenience
The market is segmented based on application into:
- Offline Stores
- Online Stores
By End User
Individual Consumers Drive Market Growth with Increased Focus on Budget-Friendly Tech Solutions
The market is segmented based on end user into:
- Individual Consumers
- Businesses
- Subtypes: SMEs and Large Enterprises
- Educational Institutions
Regional Analysis: Refurbished Electronics Market
North America
The North American refurbished electronics market is driven by strong consumer demand for cost-effective, high-quality alternatives to new devices. The U.S. dominates the region, accounting for over 70% of the market share in 2024, with major players like Apple, Dell, and HP offering certified refurbished programs. Growth is fueled by rising environmental consciousness, e-waste reduction initiatives, and the popularity of trade-in programs. However, stringent regulations on refurbishment standards and consumer skepticism about product longevity remain challenges. The market is expected to expand further as online platforms like Amazon Renewed and Back Market enhance accessibility and trust through warranties and quality assurances.
Europe
Europe’s refurbished electronics market is shaped by stringent EU circular economy policies, including the Right to Repair legislation, which promotes sustainability. Countries like Germany, France, and the U.K. are leading adopters, with consumers prioritizing eco-friendly purchasing behaviors. The region also benefits from a well-established secondary market for smartphones and laptops, with professional refurbishers ensuring compliance with high-quality standards. While offline retail plays a significant role, online marketplaces are gaining traction, supported by growing trust in refurbished products. However, regulatory complexities and competition from budget-friendly new devices in Eastern Europe temper growth to some extent.
Asia-Pacific
As the fastest-growing region, Asia-Pacific is driven by booming demand in India and China, where affordability and rapid smartphone adoption accelerate market expansion. India’s refurbished electronics sector is projected to grow at a CAGR of over 15%, supported by urban consumers and small businesses seeking cost-efficient tech solutions. However, challenges like inconsistent refurbishment standards and a preference for informal second-hand markets hinder growth in some areas. Meanwhile, Japan and South Korea emphasize high-quality refurbished goods, often backed by OEM certifications. The region’s mix of price sensitivity and sustainability awareness creates unique opportunities for market players.
South America
South America’s market is nascent but growing, with Brazil and Argentina emerging as key markets due to economic constraints pushing consumers toward refurbished electronics. The lack of standardized refurbishment processes and weak warranty frameworks limit trust, but initiatives by major retailers and e-commerce platforms are gradually improving credibility. While iPhones and gaming consoles see steady demand, low purchasing power and import restrictions in certain countries suppress broader adoption. Nonetheless, rising digital penetration and increasing awareness of refurbished benefits suggest long-term potential.
Middle East & Africa
The Middle East & Africa market is characterized by pockets of growth, particularly in the UAE and Saudi Arabia, where expatriates and cost-conscious locals drive demand. Africa’s market is fragmented, with limited infrastructure for large-scale refurbishment operations, though countries like South Africa and Nigeria show promise. Challenges include a lack of regulatory oversight and reliance on informal sales channels. However, partnerships between global refurbishers and local distributors are starting to formalize the sector, with smartphones and laptops leading category growth.
Report Scope
This market research report provides a comprehensive analysis of the global and regional Refurbished Electronics markets, covering the forecast period 2024–2032. It offers detailed insights into market dynamics, technological advancements, competitive landscape, and key trends shaping the industry.
Key focus areas of the report include:
- Market Size & Forecast: Historical data and future projections for revenue, unit shipments, and market value across major regions and segments. The Global Refurbished Electronics market was valued at US$ 67.3 billion in 2024 and is projected to reach US$ 124.8 billion by 2032, growing at a CAGR of 9.3%.
- Segmentation Analysis: Detailed breakdown by product type (smartphones, wearable devices, computing devices, home appliances, sound & vision, gaming consoles) and distribution channel (offline stores, online stores) to identify high-growth segments.
- Regional Outlook: Insights into market performance across North America, Europe, Asia-Pacific, Latin America, and Middle East & Africa. North America accounted for 35% market share in 2024, while Asia-Pacific is projected to grow at 11.3% CAGR.
- Competitive Landscape: Profiles of leading market participants including Apple, Samsung, Dell, HP, Lenovo, Amazon, and Back Market, covering their market share, product strategies, and recent developments.
- Technology Trends & Innovation: Assessment of certification standards, quality assurance processes, and the integration of AI in refurbishment processes.
- Market Drivers & Restraints: Evaluation of factors including cost sensitivity, sustainability trends, e-waste reduction initiatives, along with challenges in consumer perception and supply chain constraints.
- Stakeholder Analysis: Insights for OEMs, retailers, e-commerce platforms, and investors regarding market opportunities and strategic positioning.
The research employs primary interviews with industry experts and analysis of verified market data from regulatory bodies and trade associations to ensure accuracy and reliability.
FREQUENTLY ASKED QUESTIONS:
What is the current market size of Global Refurbished Electronics Market?
-> Refurbished Electronics Market size was valued at US$ 67.3 billion in 2024 and is projected to reach US$ 124.8 billion by 2032, at a CAGR of 9.3% during the forecast period 2025-2032.
Which key companies operate in Global Refurbished Electronics Market?
-> Key players include Apple, Samsung Electronics, Dell Technologies, HP Inc., Lenovo Group, Amazon.com, Back Market, Acer, ASUS, and Reboot Systems India.
What are the key growth drivers?
-> Key growth drivers include rising consumer demand for affordable electronics, growing environmental consciousness, and increasing adoption of certified refurbishment programs.
Which region dominates the market?
-> North America currently leads the market, while Asia-Pacific is projected to be the fastest-growing region during the forecast period.
What are the emerging trends?
-> Emerging trends include extended warranty offerings, blockchain-based authentication, and the rise of specialized refurbishment platforms.

Get Sample Report PDF for Exclusive Insights
Report Sample Includes
- Table of Contents
- List of Tables & Figures
- Charts, Research Methodology, and more...