Radio Access Network (RAN) Equipment Market, Trends, Business Strategies 2026-2034

Radio Access Network (RAN) Equipment Market size was valued at USD 23.67 billion in 2024 and is projected to reach USD 38.92 billion by 2032, at a CAGR of 7.4% during the forecast period 2025-2032.

PDF Icon Download Sample Report PDF
  • Quick Dispatch

    All Orders

  • Secure Payment

    100% Secure Payment

Price range: $1,500.00 through $4,250.00

Clear

MARKET INSIGHTS

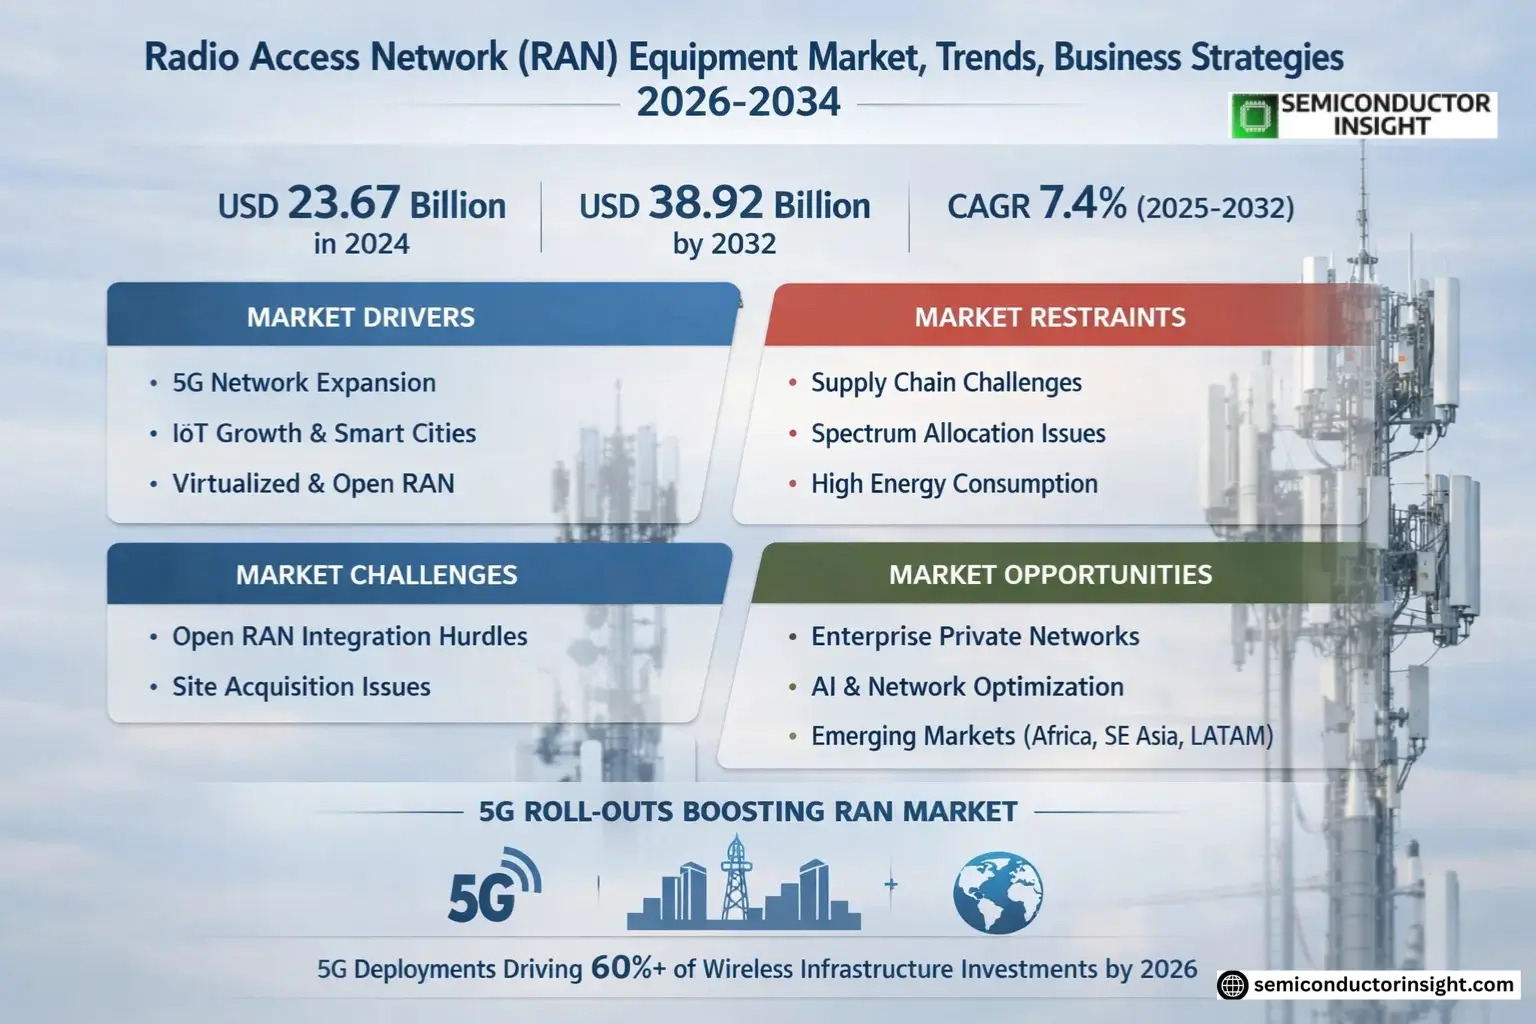
Global Radio Access Network (RAN) Equipment Market size was valued at USD 23.67 billion in 2024 and is projected to reach USD 38.92 billion by 2032, at a CAGR of 7.4% during the forecast period 2025-2032. The U.S. market is estimated at USD 7.2 billion in 2024, while China is expected to grow to USD 9.5 billion by 2032. The BBU segment is anticipated to reach USD 12.4 billion by 2032, growing at a CAGR of 7.3%.

Radio Access Network (RAN) Equipment forms the critical infrastructure connecting mobile devices to core networks, enabling wireless communication. This includes baseband units (BBUs), remote radio units (RRUs), centralized/distributed units (CU/DU), and active antenna units (AAUs). These components work together to process signals, manage radio resources, and ensure seamless connectivity for 4G, 5G, and emerging 6G networks.

The market growth is driven by rapid 5G deployment worldwide, increasing mobile data traffic, and government initiatives for digital transformation. However, supply chain disruptions and geopolitical tensions pose challenges. Key players like Ericsson, Huawei, and Nokia dominate the market with over 60% combined share, focusing on Open RAN solutions to enhance interoperability and reduce costs.

Radio Access Network (RAN) Equipment Market Insights

MARKET DYNAMICS

MARKET DRIVERS

5G Network Expansion Accelerates RAN Equipment Demand

Global rollout of 5G networks is the primary driver for Radio Access Network (RAN) Equipment Market, with telecommunications operators investing heavily in infrastructure upgrades. As of 2024, over 300 operators worldwide have launched commercial 5G services, requiring massive deployments of next-generation base stations. These networks demand advanced RAN components like Massive MIMO antennas and cloud-RAN architectures that support higher bandwidth and lower latency. The transition from 4G to 5G is particularly intensive in urban areas where network densification through small cells is becoming increasingly necessary to meet capacity requirements.

IoT Proliferation Creates New Infrastructure Demands

Explosive growth in IoT connections, projected to exceed 30 billion devices by 2025, is fundamentally transforming RAN requirements. Smart cities and industrial IoT applications require networks with ultra-reliable low-latency communication (URLLC) capabilities that only modern RAN equipment can deliver. This has led to innovations in distributed unit (DU) and centralized unit (CU) architectures that can handle massive machine-type communications. The automotive sector’s push toward connected vehicles is creating additional demand for specialized roadside RAN units that support V2X communication protocols.

Virtualization Technologies Reshape RAN Landscape

The shift toward virtualized RAN (vRAN) and Open RAN architectures is driving equipment upgrades across carriers globally. These technologies allow network functions to run on commercial off-the-shelf hardware, reducing costs while increasing flexibility. Major telecom operators have committed to having 60% of their networks virtualized by 2025, creating sustained demand for compatible RAN equipment. The emergence of 5G standalone cores is further accelerating this transition, as they require fully virtualized RAN components for end-to-end network slicing capabilities.

MARKET RESTRAINTS

Supply Chain Disruptions Impede Equipment Deployment

Radio Access Network (RAN) Equipment Market continues to face challenges from global semiconductor shortages and supply chain bottlenecks. Lead times for certain components have extended to 52 weeks or more, delaying network rollout schedules. These constraints are particularly acute for advanced chipsets used in 5G radios and baseband units. The geopolitical environment has further complicated supply chains, with restrictions on technology transfers impacting equipment availability in certain regions. While the situation is gradually improving, full supply chain normalization isn’t expected before late 2025.

Other Restraints

Spectrum Allocation Challenges
Delays in spectrum auctions and fragmented frequency bands across regions create operational complexities for equipment manufacturers. This leads to higher R&D costs as companies must develop multiple variants of equipment to support different frequency combinations. The situation is exacerbated in markets where mid-band spectrum – crucial for 5G coverage and capacity – remains tied up in regulatory processes.

Energy Consumption Concerns
5G RAN equipment typically consumes significantly more power than 4G infrastructure, sometimes up to 3-4 times higher for equivalent coverage. This creates economic and environmental challenges for operators, particularly in regions with high electricity costs or strict carbon emission regulations. While newer equipment generations are becoming more energy efficient, power consumption remains a key restraint for dense urban deployments.

MARKET CHALLENGES

Open RAN Integration Complexities Create Deployment Hurdles

While Open RAN promises greater vendor diversity and cost efficiency, its implementation presents substantial technical challenges. Multi-vendor interoperability issues frequently arise during network integration, particularly between radio units and distributed units from different suppliers. The technology also requires new skill sets that are currently in short supply. Verification and testing procedures for Open RAN equipment are more complex than traditional RAN solutions, sometimes resulting in deployment delays of 6-12 months beyond projections.

Other Challenges

Site Acquisition Difficulties
Urban network densification faces growing resistance from local communities concerned about visual pollution and perceived health risks. Obtaining permits for new cell sites has become increasingly time-consuming, with approval processes in some major cities taking over 18 months. This directly impacts RAN equipment deployment schedules and increases project costs through extended timelines.

Legacy Network Integration
Most operators must maintain hybrid networks supporting 2G, 3G, 4G, and 5G technologies simultaneously. This creates complexity in RAN equipment deployment as solutions must support multiple generations of technology while optimizing for space and power constraints. The need for backward compatibility often limits the performance optimization possible with new equipment designs.

MARKET OPPORTUNITIES

Enterprise Private Networks Open New Market Segments

The rapid growth of private 5G networks for industrial and enterprise use represents a significant opportunity for RAN equipment providers. Manufacturing facilities, ports, and energy companies are deploying localized RAN infrastructure to support critical operations. This vertical-specific demand is driving innovation in ruggedized small cells and industrial-grade radio units designed for harsh environments. The market for dedicated enterprise RAN solutions is projected to grow at a compound annual rate exceeding 45% through 2030.

AI-driven Network Optimization Creates Value-added Services

Artificial intelligence and machine learning are increasingly being embedded into RAN equipment for autonomous network management. This creates opportunities for higher-margin intelligent systems that can predict maintenance needs, optimize performance, and detect anomalies in real-time. The integration of AI processors directly into baseband units allows for sophisticated beamforming and interference mitigation techniques that improve spectral efficiency. These capabilities are becoming critical differentiators for equipment vendors competing in crowded markets.

Emerging Markets Present Greenfield Opportunities

Developing economies in Africa, Southeast Asia, and Latin America represent the next growth frontier for RAN equipment. Many of these regions are leapfrogging directly to 5G deployments without extensive 4G buildouts. The unique requirements of these markets – including cost-sensitive solutions and tropicalized equipment – are spurring innovation in compact, energy-efficient RAN products. Government digital inclusion programs are further accelerating demand, with some nations mandating infrastructure sharing models that optimize RAN deployment costs.

RADIO ACCESS NETWORK (RAN) EQUIPMENT MARKET TRENDS

5G Network Rollouts Driving Market Expansion

Global deployment of 5G networks has become the primary catalyst for RAN equipment growth, with operators worldwide investing heavily in infrastructure modernization. While traditional 4G networks remain operational, the shift toward high-speed, low-latency 5G connectivity has necessitated upgrades across BBUs, RRUs, and distributed units (DUs). Recent data indicates that 5G RAN deployments accounted for nearly 45% of total wireless infrastructure spending in 2023, with projections suggesting this share will surpass 60% by 2026. China and the U.S. lead in capital expenditures, contributing over 70% of global 5G RAN investments, while Europe and Southeast Asia are accelerating their adoption timelines.

Other Trends

Virtualization and Open RAN Adoption

Network virtualization is reshaping the RAN equipment landscape as operators embrace cloud-native architectures to reduce costs and improve scalability. Open RAN (O-RAN) standards are gaining traction, with deployments growing at a compound annual rate of over 35% since 2020. This shift allows operators to mix hardware from multiple vendors, breaking traditional proprietary ecosystems. However, full-scale O-RAN implementation faces challenges in interoperability testing and performance optimization compared to integrated systems from dominant players like Ericsson and Huawei.

Edge Computing Integration with RAN Infrastructure

The convergence of multi-access edge computing (MEC) with RAN equipment is creating new revenue streams for infrastructure providers. By decentralizing compute capabilities to cell sites, latency-sensitive applications like industrial IoT and autonomous vehicles achieve sub-10ms response times. Over 40% of telecom operators surveyed in 2024 are piloting integrated RAN-MEC solutions, with commercial deployments expected to triple by 2027. This trend is particularly strong in smart city applications, where distributed RAN nodes process traffic management and public safety data locally rather than routing everything through centralized data centers.

COMPETITIVE LANDSCAPE

Key Industry Players

Telecom Giants and Emerging Players Compete for 5G Infrastructure Dominance

Global Radio Access Network (RAN) Equipment Market demonstrates an oligopolistic structure dominated by telecommunications infrastructure giants, with intense competition for 5G deployment contracts worldwide. Huawei Technologies Co., Ltd. maintains significant market presence despite geopolitical challenges, particularly in emerging markets where its cost-competitive solutions remain popular.

Ericsson and Nokia Corporation together hold around 35% of the global RAN market share as of 2024, benefiting from Western markets’ preference for trusted vendor solutions. Their technological leadership in Open RAN and cloud-native architectures positions them favorably for the network virtualization transition.

Meanwhile, SAMSUNG ELECTRONICS CO. LTD. has gained remarkable traction in the North American market, securing major 5G deployment contracts with Verizon and other carriers. The company’s vertical integration advantages enable competitive pricing while maintaining technological excellence in massive MIMO and mmWave solutions.

While the market remains concentrated among the top players, new entrants and system integrators are challenging traditional suppliers through open ecosystem approaches. Cisco Systems, Inc. has been strengthening its position through strategic partnerships and software-defined RAN solutions, while ZTE Corporation continues to expand its footprint across Asia-Pacific and African markets.

List of Key RAN Equipment Providers

  • Huawei Technologies Co., Ltd. (China)
  • Ericsson (Sweden)
  • Nokia Corporation (Finland)
  • SAMSUNG ELECTRONICS CO. LTD. (South Korea)
  • Fujitsu Limited (Japan)
  • ZTE Corporation (China)
  • Cisco Systems, Inc. (U.S.)
  • NEC Corporation (Japan)
  • Parallel Wireless (U.S.)

Segment Analysis:

By Type

BBU Segment Leads the Market with Increasing 5G Deployments

The market is segmented based on type into:

  • BBU (Baseband Unit)
  • RRU (Remote Radio Unit)
  • CU/DU (Centralized Unit/Distributed Unit)
  • AAU (Active Antenna Unit)
  • Others

By Application

Smart Cities Segment Shows Significant Growth Potential Due to Urban Digital Transformation

The market is segmented based on application into:

  • Smart Home
  • Autonomous Driving
  • Smart Cities
  • Industrial IoT
  • Smart Farming
  • Other

By Technology

5G RAN Dominates Due to Global Infrastructure Modernization

The market is segmented based on technology into:

  • 2G/3G
  • 4G LTE
  • 5G
  • Other Emerging Technologies

By Deployment

Outdoor Deployment Maintains Majority Share for Wide Area Coverage

The market is segmented based on deployment into:

  • Indoor
  • Outdoor

Regional Analysis: Radio Access Network (RAN) Equipment Market

North America
The North American RAN equipment market is driven by rapid 5G deployment and investments in next-generation network infrastructure. With the U.S. leading in 5G adoption, major telecom operators are aggressively upgrading their RAN architectures to support high-speed applications like autonomous vehicles and smart cities. The region’s focus on OpenRAN initiatives and spectrum auctions (e.g., C-band deployments) further accelerates market growth. However, geopolitical tensions affecting Chinese suppliers like Huawei have reshaped the competitive landscape, favoring Western vendors such as Ericsson and Nokia. Regulatory pressures for network security and technological sovereignty also influence procurement strategies.

Europe
Europe’s RAN equipment market is characterized by a mix of legacy network upgrades and cautious 5G rollouts, with countries like Germany and the U.K. at the forefront. The EU’s push for OpenRAN interoperability and vendor diversification—coupled with strict cybersecurity requirements—has slowed deployments but ensures long-term sustainability. Operators are prioritizing energy-efficient solutions to align with the bloc’s Green Deal objectives. While Huawei’s phased exclusion creates opportunities for competitors, fragmented national policies and funding disparities between Western and Eastern Europe create uneven growth patterns across the region.

Asia-Pacific
As the largest RAN equipment market globally, Asia-Pacific benefits from massive 5G investments in China, whose domestic vendors Huawei and ZTE dominate regional supply chains. Japan and South Korea lead in early-stage 5G commercialization, while India’s delayed spectrum auctions now show accelerating demand. Southeast Asian nations face infrastructure gaps but present high-growth potential through public-private partnerships. The region’s diversity creates contrasts: mature markets prioritize network densification, whereas emerging economies still focus on 4G LTE expansions due to cost constraints. Political factors, including U.S.-China trade restrictions, significantly impact procurement strategies.

South America
South America’s RAN market struggles with economic instability and limited 5G investments outside Brazil, where recent auctions have spurred initial deployments. Most countries rely heavily on 4G LTE upgrades due to budgetary constraints and slower ROI timelines. Regulatory hurdles and currency volatility discourage large-scale infrastructure projects, though some operators experiment with OpenRAN to reduce costs. While the long-term potential exists—especially for smart city applications in urban centers—progress remains incremental compared to other regions. Vendor competition is intense, with Chinese suppliers holding cost advantages in price-sensitive markets.

Middle East & Africa
The Middle East leads RAN adoption in this region through ambitious smart city initiatives (e.g., Saudi Arabia’s NEOM) and early 5G rollouts in Gulf Cooperation Council (GCC) nations. High ARPU markets like the UAE invest heavily in cutting-edge RAN solutions, while African countries face infrastructure deficits and rely on 3G/4G expansions. Political instability and funding challenges limit growth in parts of Africa, though mobile-first economies create latent demand for cost-effective RAN upgrades. Vendors balance opportunities in oil-rich Gulf states against higher-risk, lower-margin African markets where Huawei retains strong influence through flexible financing models.

Report Scope

This market research report provides a comprehensive analysis of the global and regional Radio Access Network (RAN) Equipment Markets, covering the forecast period 2024–2032. It offers detailed insights into market dynamics, technological advancements, competitive landscape, and key trends shaping the industry.

Key focus areas of the report include:

  • Market Size & Forecast: Historical data and future projections for revenue, unit shipments, and market value across major regions and segments. The Global RAN Equipment market was valued at USD 23.67 billion in 2024 and is projected to reach USD 38.92 billion by 2032.
  • Segmentation Analysis: Detailed breakdown by product type (BBU, RRU, CU/DU, AAU), technology, application (Smart Home, Autonomous Driving, Smart Cities, Industrial IoT, Smart Farming), and end-user industry.
  • Regional Outlook: Insights into market performance across North America, Europe, Asia-Pacific, Latin America, and the Middle East & Africa, with the U.S. market estimated at USD million in 2024 and China projected to reach USD million.
  • Competitive Landscape: Profiles of leading market participants including Ericsson, Huawei, Nokia, Cisco, ZTE, Samsung, and Fujitsu, which collectively held approximately % market share in 2024.
  • Technology Trends & Innovation: Assessment of emerging 5G/6G technologies, Open RAN architectures, AI-driven network optimization, and cloud-native solutions.
  • Market Drivers & Restraints: Evaluation of factors driving market growth such as 5G deployment and smart city initiatives, along with challenges including spectrum allocation and geopolitical tensions.
  • Stakeholder Analysis: Insights for telecom operators, equipment vendors, system integrators, investors, and policymakers regarding strategic opportunities in the evolving RAN ecosystem.

Primary and secondary research methods are employed, including interviews with industry experts, data from verified sources, and real-time market intelligence to ensure the accuracy and reliability of the insights presented.

FREQUENTLY ASKED QUESTIONS:

What is the current market size of Global Radio Access Network (RAN) Equipment Market?

-> Radio Access Network (RAN) Equipment Market size was valued at USD 23.67 billion in 2024 and is projected to reach USD 38.92 billion by 2032, at a CAGR of 7.4% during the forecast period 2025-2032.

Which key companies operate in Global RAN Equipment Market?

-> Key players include Ericsson, Huawei Technologies, Nokia Corporation, Cisco Systems, ZTE Corporation, Samsung Electronics, and Fujitsu Limited.

What are the key growth drivers?

-> Key growth drivers include 5G network expansion, increasing mobile data traffic, and government investments in telecom infrastructure.

Which region dominates the market?

-> Asia-Pacific is the fastest-growing region due to massive 5G deployments, while North America maintains significant market share.

What are the emerging trends?

-> Emerging trends include Open RAN adoption, network virtualization, AI-powered optimization, and energy-efficient solutions.

Radio Access Network (RAN) Equipment Market, Trends, Business Strategies 2026-2034

Get Sample Report PDF for Exclusive Insights

Report Sample Includes

  • Table of Contents
  • List of Tables & Figures
  • Charts, Research Methodology, and more...
PDF Icon Download Sample Report PDF

Download Sample Report

Table of Content

1 Introduction to Research & Analysis Reports
1.1 Radio Access Network (RAN) Equipment Market Definition
1.2 Market Segments
1.2.1 Segment by Type
1.2.2 Segment by Application
1.3 Global Radio Access Network (RAN) Equipment Market Overview
1.4 Features & Benefits of This Report
1.5 Methodology & Sources of Information
1.5.1 Research Methodology
1.5.2 Research Process
1.5.3 Base Year
1.5.4 Report Assumptions & Caveats
2 Global Radio Access Network (RAN) Equipment Overall Market Size
2.1 Global Radio Access Network (RAN) Equipment Market Size: 2024 VS 2032
2.2 Global Radio Access Network (RAN) Equipment Market Size, Prospects & Forecasts: 2020-2032
2.3 Global Radio Access Network (RAN) Equipment Sales: 2020-2032
3 Company Landscape
3.1 Top Radio Access Network (RAN) Equipment Players in Global Market
3.2 Top Global Radio Access Network (RAN) Equipment Companies Ranked by Revenue
3.3 Global Radio Access Network (RAN) Equipment Revenue by Companies
3.4 Global Radio Access Network (RAN) Equipment Sales by Companies
3.5 Global Radio Access Network (RAN) Equipment Price by Manufacturer (2020-2025)
3.6 Top 3 and Top 5 Radio Access Network (RAN) Equipment Companies in Global Market, by Revenue in 2024
3.7 Global Manufacturers Radio Access Network (RAN) Equipment Product Type
3.8 Tier 1, Tier 2, and Tier 3 Radio Access Network (RAN) Equipment Players in Global Market
3.8.1 List of Global Tier 1 Radio Access Network (RAN) Equipment Companies
3.8.2 List of Global Tier 2 and Tier 3 Radio Access Network (RAN) Equipment Companies
4 Sights by Product
4.1 Overview
4.1.1 Segment by Type – Global Radio Access Network (RAN) Equipment Market Size Markets, 2024 & 2032
4.1.2 BBU
4.1.3 RRU
4.1.4 CU/DU
4.1.5 AAU
4.2 Segment by Type – Global Radio Access Network (RAN) Equipment Revenue & Forecasts
4.2.1 Segment by Type – Global Radio Access Network (RAN) Equipment Revenue, 2020-2025
4.2.2 Segment by Type – Global Radio Access Network (RAN) Equipment Revenue, 2026-2032
4.2.3 Segment by Type – Global Radio Access Network (RAN) Equipment Revenue Market Share, 2020-2032
4.3 Segment by Type – Global Radio Access Network (RAN) Equipment Sales & Forecasts
4.3.1 Segment by Type – Global Radio Access Network (RAN) Equipment Sales, 2020-2025
4.3.2 Segment by Type – Global Radio Access Network (RAN) Equipment Sales, 2026-2032
4.3.3 Segment by Type – Global Radio Access Network (RAN) Equipment Sales Market Share, 2020-2032
4.4 Segment by Type – Global Radio Access Network (RAN) Equipment Price (Manufacturers Selling Prices), 2020-2032
5 Sights by Application
5.1 Overview
5.1.1 Segment by Application – Global Radio Access Network (RAN) Equipment Market Size, 2024 & 2032
5.1.2 Smart Home
5.1.3 Autonomous Driving
5.1.4 Smart Cities
5.1.5 Industrial IoT
5.1.6 Smart Farming
5.1.7 Other
5.2 Segment by Application – Global Radio Access Network (RAN) Equipment Revenue & Forecasts
5.2.1 Segment by Application – Global Radio Access Network (RAN) Equipment Revenue, 2020-2025
5.2.2 Segment by Application – Global Radio Access Network (RAN) Equipment Revenue, 2026-2032
5.2.3 Segment by Application – Global Radio Access Network (RAN) Equipment Revenue Market Share, 2020-2032
5.3 Segment by Application – Global Radio Access Network (RAN) Equipment Sales & Forecasts
5.3.1 Segment by Application – Global Radio Access Network (RAN) Equipment Sales, 2020-2025
5.3.2 Segment by Application – Global Radio Access Network (RAN) Equipment Sales, 2026-2032
5.3.3 Segment by Application – Global Radio Access Network (RAN) Equipment Sales Market Share, 2020-2032
5.4 Segment by Application – Global Radio Access Network (RAN) Equipment Price (Manufacturers Selling Prices), 2020-2032
6 Sights by Region
6.1 By Region – Global Radio Access Network (RAN) Equipment Market Size, 2024 & 2032
6.2 By Region – Global Radio Access Network (RAN) Equipment Revenue & Forecasts
6.2.1 By Region – Global Radio Access Network (RAN) Equipment Revenue, 2020-2025
6.2.2 By Region – Global Radio Access Network (RAN) Equipment Revenue, 2026-2032
6.2.3 By Region – Global Radio Access Network (RAN) Equipment Revenue Market Share, 2020-2032
6.3 By Region – Global Radio Access Network (RAN) Equipment Sales & Forecasts
6.3.1 By Region – Global Radio Access Network (RAN) Equipment Sales, 2020-2025
6.3.2 By Region – Global Radio Access Network (RAN) Equipment Sales, 2026-2032
6.3.3 By Region – Global Radio Access Network (RAN) Equipment Sales Market Share, 2020-2032
6.4 North America
6.4.1 By Country – North America Radio Access Network (RAN) Equipment Revenue, 2020-2032
6.4.2 By Country – North America Radio Access Network (RAN) Equipment Sales, 2020-2032
6.4.3 United States Radio Access Network (RAN) Equipment Market Size, 2020-2032
6.4.4 Canada Radio Access Network (RAN) Equipment Market Size, 2020-2032
6.4.5 Mexico Radio Access Network (RAN) Equipment Market Size, 2020-2032
6.5 Europe
6.5.1 By Country – Europe Radio Access Network (RAN) Equipment Revenue, 2020-2032
6.5.2 By Country – Europe Radio Access Network (RAN) Equipment Sales, 2020-2032
6.5.3 Germany Radio Access Network (RAN) Equipment Market Size, 2020-2032
6.5.4 France Radio Access Network (RAN) Equipment Market Size, 2020-2032
6.5.5 U.K. Radio Access Network (RAN) Equipment Market Size, 2020-2032
6.5.6 Italy Radio Access Network (RAN) Equipment Market Size, 2020-2032
6.5.7 Russia Radio Access Network (RAN) Equipment Market Size, 2020-2032
6.5.8 Nordic Countries Radio Access Network (RAN) Equipment Market Size, 2020-2032
6.5.9 Benelux Radio Access Network (RAN) Equipment Market Size, 2020-2032
6.6 Asia
6.6.1 By Region – Asia Radio Access Network (RAN) Equipment Revenue, 2020-2032
6.6.2 By Region – Asia Radio Access Network (RAN) Equipment Sales, 2020-2032
6.6.3 China Radio Access Network (RAN) Equipment Market Size, 2020-2032
6.6.4 Japan Radio Access Network (RAN) Equipment Market Size, 2020-2032
6.6.5 South Korea Radio Access Network (RAN) Equipment Market Size, 2020-2032
6.6.6 Southeast Asia Radio Access Network (RAN) Equipment Market Size, 2020-2032
6.6.7 India Radio Access Network (RAN) Equipment Market Size, 2020-2032
6.7 South America
6.7.1 By Country – South America Radio Access Network (RAN) Equipment Revenue, 2020-2032
6.7.2 By Country – South America Radio Access Network (RAN) Equipment Sales, 2020-2032
6.7.3 Brazil Radio Access Network (RAN) Equipment Market Size, 2020-2032
6.7.4 Argentina Radio Access Network (RAN) Equipment Market Size, 2020-2032
6.8 Middle East & Africa
6.8.1 By Country – Middle East & Africa Radio Access Network (RAN) Equipment Revenue, 2020-2032
6.8.2 By Country – Middle East & Africa Radio Access Network (RAN) Equipment Sales, 2020-2032
6.8.3 Turkey Radio Access Network (RAN) Equipment Market Size, 2020-2032
6.8.4 Israel Radio Access Network (RAN) Equipment Market Size, 2020-2032
6.8.5 Saudi Arabia Radio Access Network (RAN) Equipment Market Size, 2020-2032
6.8.6 UAE Radio Access Network (RAN) Equipment Market Size, 2020-2032
7 Manufacturers & Brands Profiles
7.1 Ericsson
7.1.1 Ericsson Company Summary
7.1.2 Ericsson Business Overview
7.1.3 Ericsson Radio Access Network (RAN) Equipment Major Product Offerings
7.1.4 Ericsson Radio Access Network (RAN) Equipment Sales and Revenue in Global (2020-2025)
7.1.5 Ericsson Key News & Latest Developments
7.2 Fujitsu Limited
7.2.1 Fujitsu Limited Company Summary
7.2.2 Fujitsu Limited Business Overview
7.2.3 Fujitsu Limited Radio Access Network (RAN) Equipment Major Product Offerings
7.2.4 Fujitsu Limited Radio Access Network (RAN) Equipment Sales and Revenue in Global (2020-2025)
7.2.5 Fujitsu Limited Key News & Latest Developments
7.3 Huawei Technologies Co., Ltd.
7.3.1 Huawei Technologies Co., Ltd. Company Summary
7.3.2 Huawei Technologies Co., Ltd. Business Overview
7.3.3 Huawei Technologies Co., Ltd. Radio Access Network (RAN) Equipment Major Product Offerings
7.3.4 Huawei Technologies Co., Ltd. Radio Access Network (RAN) Equipment Sales and Revenue in Global (2020-2025)
7.3.5 Huawei Technologies Co., Ltd. Key News & Latest Developments
7.4 Nokia Corporation
7.4.1 Nokia Corporation Company Summary
7.4.2 Nokia Corporation Business Overview
7.4.3 Nokia Corporation Radio Access Network (RAN) Equipment Major Product Offerings
7.4.4 Nokia Corporation Radio Access Network (RAN) Equipment Sales and Revenue in Global (2020-2025)
7.4.5 Nokia Corporation Key News & Latest Developments
7.5 Cisco Systems, Inc.
7.5.1 Cisco Systems, Inc. Company Summary
7.5.2 Cisco Systems, Inc. Business Overview
7.5.3 Cisco Systems, Inc. Radio Access Network (RAN) Equipment Major Product Offerings
7.5.4 Cisco Systems, Inc. Radio Access Network (RAN) Equipment Sales and Revenue in Global (2020-2025)
7.5.5 Cisco Systems, Inc. Key News & Latest Developments
7.6 ZTE Corporation
7.6.1 ZTE Corporation Company Summary
7.6.2 ZTE Corporation Business Overview
7.6.3 ZTE Corporation Radio Access Network (RAN) Equipment Major Product Offerings
7.6.4 ZTE Corporation Radio Access Network (RAN) Equipment Sales and Revenue in Global (2020-2025)
7.6.5 ZTE Corporation Key News & Latest Developments
7.7 SAMSUNG ELECTRONICS CO. LTD.
7.7.1 SAMSUNG ELECTRONICS CO. LTD. Company Summary
7.7.2 SAMSUNG ELECTRONICS CO. LTD. Business Overview
7.7.3 SAMSUNG ELECTRONICS CO. LTD. Radio Access Network (RAN) Equipment Major Product Offerings
7.7.4 SAMSUNG ELECTRONICS CO. LTD. Radio Access Network (RAN) Equipment Sales and Revenue in Global (2020-2025)
7.7.5 SAMSUNG ELECTRONICS CO. LTD. Key News & Latest Developments
8 Global Radio Access Network (RAN) Equipment Production Capacity, Analysis
8.1 Global Radio Access Network (RAN) Equipment Production Capacity, 2020-2032
8.2 Radio Access Network (RAN) Equipment Production Capacity of Key Manufacturers in Global Market
8.3 Global Radio Access Network (RAN) Equipment Production by Region
9 Key Market Trends, Opportunity, Drivers and Restraints
9.1 Market Opportunities & Trends
9.2 Market Drivers
9.3 Market Restraints
10 Radio Access Network (RAN) Equipment Supply Chain Analysis
10.1 Radio Access Network (RAN) Equipment Industry Value Chain
10.2 Radio Access Network (RAN) Equipment Upstream Market
10.3 Radio Access Network (RAN) Equipment Downstream and Clients
10.4 Marketing Channels Analysis
10.4.1 Marketing Channels
10.4.2 Radio Access Network (RAN) Equipment Distributors and Sales Agents in Global
11 Conclusion
12 Appendix
12.1 Note
12.2 Examples of Clients
12.3 DisclaimerList of Tables
Table 1. Key Players of Radio Access Network (RAN) Equipment in Global Market
Table 2. Top Radio Access Network (RAN) Equipment Players in Global Market, Ranking by Revenue (2024)
Table 3. Global Radio Access Network (RAN) Equipment Revenue by Companies, (US$, Mn), 2020-2025
Table 4. Global Radio Access Network (RAN) Equipment Revenue Share by Companies, 2020-2025
Table 5. Global Radio Access Network (RAN) Equipment Sales by Companies, (K Units), 2020-2025
Table 6. Global Radio Access Network (RAN) Equipment Sales Share by Companies, 2020-2025
Table 7. Key Manufacturers Radio Access Network (RAN) Equipment Price (2020-2025) & (US$/Unit)
Table 8. Global Manufacturers Radio Access Network (RAN) Equipment Product Type
Table 9. List of Global Tier 1 Radio Access Network (RAN) Equipment Companies, Revenue (US$, Mn) in 2024 and Market Share
Table 10. List of Global Tier 2 and Tier 3 Radio Access Network (RAN) Equipment Companies, Revenue (US$, Mn) in 2024 and Market Share
Table 11. Segment by Type – Global Radio Access Network (RAN) Equipment Revenue, (US$, Mn), 2024 & 2032
Table 12. Segment by Type – Global Radio Access Network (RAN) Equipment Revenue (US$, Mn), 2020-2025
Table 13. Segment by Type – Global Radio Access Network (RAN) Equipment Revenue (US$, Mn), 2026-2032
Table 14. Segment by Type – Global Radio Access Network (RAN) Equipment Sales (K Units), 2020-2025
Table 15. Segment by Type – Global Radio Access Network (RAN) Equipment Sales (K Units), 2026-2032
Table 16. Segment by Application – Global Radio Access Network (RAN) Equipment Revenue, (US$, Mn), 2024 & 2032
Table 17. Segment by Application – Global Radio Access Network (RAN) Equipment Revenue, (US$, Mn), 2020-2025
Table 18. Segment by Application – Global Radio Access Network (RAN) Equipment Revenue, (US$, Mn), 2026-2032
Table 19. Segment by Application – Global Radio Access Network (RAN) Equipment Sales, (K Units), 2020-2025
Table 20. Segment by Application – Global Radio Access Network (RAN) Equipment Sales, (K Units), 2026-2032
Table 21. By Region – Global Radio Access Network (RAN) Equipment Revenue, (US$, Mn), 2025-2032
Table 22. By Region – Global Radio Access Network (RAN) Equipment Revenue, (US$, Mn), 2020-2025
Table 23. By Region – Global Radio Access Network (RAN) Equipment Revenue, (US$, Mn), 2026-2032
Table 24. By Region – Global Radio Access Network (RAN) Equipment Sales, (K Units), 2020-2025
Table 25. By Region – Global Radio Access Network (RAN) Equipment Sales, (K Units), 2026-2032
Table 26. By Country – North America Radio Access Network (RAN) Equipment Revenue, (US$, Mn), 2020-2025
Table 27. By Country – North America Radio Access Network (RAN) Equipment Revenue, (US$, Mn), 2026-2032
Table 28. By Country – North America Radio Access Network (RAN) Equipment Sales, (K Units), 2020-2025
Table 29. By Country – North America Radio Access Network (RAN) Equipment Sales, (K Units), 2026-2032
Table 30. By Country – Europe Radio Access Network (RAN) Equipment Revenue, (US$, Mn), 2020-2025
Table 31. By Country – Europe Radio Access Network (RAN) Equipment Revenue, (US$, Mn), 2026-2032
Table 32. By Country – Europe Radio Access Network (RAN) Equipment Sales, (K Units), 2020-2025
Table 33. By Country – Europe Radio Access Network (RAN) Equipment Sales, (K Units), 2026-2032
Table 34. By Region – Asia Radio Access Network (RAN) Equipment Revenue, (US$, Mn), 2020-2025
Table 35. By Region – Asia Radio Access Network (RAN) Equipment Revenue, (US$, Mn), 2026-2032
Table 36. By Region – Asia Radio Access Network (RAN) Equipment Sales, (K Units), 2020-2025
Table 37. By Region – Asia Radio Access Network (RAN) Equipment Sales, (K Units), 2026-2032
Table 38. By Country – South America Radio Access Network (RAN) Equipment Revenue, (US$, Mn), 2020-2025
Table 39. By Country – South America Radio Access Network (RAN) Equipment Revenue, (US$, Mn), 2026-2032
Table 40. By Country – South America Radio Access Network (RAN) Equipment Sales, (K Units), 2020-2025
Table 41. By Country – South America Radio Access Network (RAN) Equipment Sales, (K Units), 2026-2032
Table 42. By Country – Middle East & Africa Radio Access Network (RAN) Equipment Revenue, (US$, Mn), 2020-2025
Table 43. By Country – Middle East & Africa Radio Access Network (RAN) Equipment Revenue, (US$, Mn), 2026-2032
Table 44. By Country – Middle East & Africa Radio Access Network (RAN) Equipment Sales, (K Units), 2020-2025
Table 45. By Country – Middle East & Africa Radio Access Network (RAN) Equipment Sales, (K Units), 2026-2032
Table 46. Ericsson Company Summary
Table 47. Ericsson Radio Access Network (RAN) Equipment Product Offerings
Table 48. Ericsson Radio Access Network (RAN) Equipment Sales (K Units), Revenue (US$, Mn) and Average Price (US$/Unit) & (2020-2025)
Table 49. Ericsson Key News & Latest Developments
Table 50. Fujitsu Limited Company Summary
Table 51. Fujitsu Limited Radio Access Network (RAN) Equipment Product Offerings
Table 52. Fujitsu Limited Radio Access Network (RAN) Equipment Sales (K Units), Revenue (US$, Mn) and Average Price (US$/Unit) & (2020-2025)
Table 53. Fujitsu Limited Key News & Latest Developments
Table 54. Huawei Technologies Co., Ltd. Company Summary
Table 55. Huawei Technologies Co., Ltd. Radio Access Network (RAN) Equipment Product Offerings
Table 56. Huawei Technologies Co., Ltd. Radio Access Network (RAN) Equipment Sales (K Units), Revenue (US$, Mn) and Average Price (US$/Unit) & (2020-2025)
Table 57. Huawei Technologies Co., Ltd. Key News & Latest Developments
Table 58. Nokia Corporation Company Summary
Table 59. Nokia Corporation Radio Access Network (RAN) Equipment Product Offerings
Table 60. Nokia Corporation Radio Access Network (RAN) Equipment Sales (K Units), Revenue (US$, Mn) and Average Price (US$/Unit) & (2020-2025)
Table 61. Nokia Corporation Key News & Latest Developments
Table 62. Cisco Systems, Inc. Company Summary
Table 63. Cisco Systems, Inc. Radio Access Network (RAN) Equipment Product Offerings
Table 64. Cisco Systems, Inc. Radio Access Network (RAN) Equipment Sales (K Units), Revenue (US$, Mn) and Average Price (US$/Unit) & (2020-2025)
Table 65. Cisco Systems, Inc. Key News & Latest Developments
Table 66. ZTE Corporation Company Summary
Table 67. ZTE Corporation Radio Access Network (RAN) Equipment Product Offerings
Table 68. ZTE Corporation Radio Access Network (RAN) Equipment Sales (K Units), Revenue (US$, Mn) and Average Price (US$/Unit) & (2020-2025)
Table 69. ZTE Corporation Key News & Latest Developments
Table 70. SAMSUNG ELECTRONICS CO. LTD. Company Summary
Table 71. SAMSUNG ELECTRONICS CO. LTD. Radio Access Network (RAN) Equipment Product Offerings
Table 72. SAMSUNG ELECTRONICS CO. LTD. Radio Access Network (RAN) Equipment Sales (K Units), Revenue (US$, Mn) and Average Price (US$/Unit) & (2020-2025)
Table 73. SAMSUNG ELECTRONICS CO. LTD. Key News & Latest Developments
Table 74. Radio Access Network (RAN) Equipment Capacity of Key Manufacturers in Global Market, 2023-2025 (K Units)
Table 75. Global Radio Access Network (RAN) Equipment Capacity Market Share of Key Manufacturers, 2023-2025
Table 76. Global Radio Access Network (RAN) Equipment Production by Region, 2020-2025 (K Units)
Table 77. Global Radio Access Network (RAN) Equipment Production by Region, 2026-2032 (K Units)
Table 78. Radio Access Network (RAN) Equipment Market Opportunities & Trends in Global Market
Table 79. Radio Access Network (RAN) Equipment Market Drivers in Global Market
Table 80. Radio Access Network (RAN) Equipment Market Restraints in Global Market
Table 81. Radio Access Network (RAN) Equipment Raw Materials
Table 82. Radio Access Network (RAN) Equipment Raw Materials Suppliers in Global Market
Table 83. Typical Radio Access Network (RAN) Equipment Downstream
Table 84. Radio Access Network (RAN) Equipment Downstream Clients in Global Market
Table 85. Radio Access Network (RAN) Equipment Distributors and Sales Agents in Global Market

List of Figures
Figure 1. Radio Access Network (RAN) Equipment Product Picture
Figure 2. Radio Access Network (RAN) Equipment Segment by Type in 2024
Figure 3. Radio Access Network (RAN) Equipment Segment by Application in 2024
Figure 4. Global Radio Access Network (RAN) Equipment Market Overview: 2024
Figure 5. Key Caveats
Figure 6. Global Radio Access Network (RAN) Equipment Market Size: 2024 VS 2032 (US$, Mn)
Figure 7. Global Radio Access Network (RAN) Equipment Revenue: 2020-2032 (US$, Mn)
Figure 8. Radio Access Network (RAN) Equipment Sales in Global Market: 2020-2032 (K Units)
Figure 9. The Top 3 and 5 Players Market Share by Radio Access Network (RAN) Equipment Revenue in 2024
Figure 10. Segment by Type – Global Radio Access Network (RAN) Equipment Revenue, (US$, Mn), 2024 & 2032
Figure 11. Segment by Type – Global Radio Access Network (RAN) Equipment Revenue Market Share, 2020-2032
Figure 12. Segment by Type – Global Radio Access Network (RAN) Equipment Sales Market Share, 2020-2032
Figure 13. Segment by Type – Global Radio Access Network (RAN) Equipment Price (US$/Unit), 2020-2032
Figure 14. Segment by Application – Global Radio Access Network (RAN) Equipment Revenue, (US$, Mn), 2024 & 2032
Figure 15. Segment by Application – Global Radio Access Network (RAN) Equipment Revenue Market Share, 2020-2032
Figure 16. Segment by Application – Global Radio Access Network (RAN) Equipment Sales Market Share, 2020-2032
Figure 17. Segment by Application -Global Radio Access Network (RAN) Equipment Price (US$/Unit), 2020-2032
Figure 18. By Region – Global Radio Access Network (RAN) Equipment Revenue, (US$, Mn), 2025 & 2032
Figure 19. By Region – Global Radio Access Network (RAN) Equipment Revenue Market Share, 2020 VS 2024 VS 2032
Figure 20. By Region – Global Radio Access Network (RAN) Equipment Revenue Market Share, 2020-2032
Figure 21. By Region – Global Radio Access Network (RAN) Equipment Sales Market Share, 2020-2032
Figure 22. By Country – North America Radio Access Network (RAN) Equipment Revenue Market Share, 2020-2032
Figure 23. By Country – North America Radio Access Network (RAN) Equipment Sales Market Share, 2020-2032
Figure 24. United States Radio Access Network (RAN) Equipment Revenue, (US$, Mn), 2020-2032
Figure 25. Canada Radio Access Network (RAN) Equipment Revenue, (US$, Mn), 2020-2032
Figure 26. Mexico Radio Access Network (RAN) Equipment Revenue, (US$, Mn), 2020-2032
Figure 27. By Country – Europe Radio Access Network (RAN) Equipment Revenue Market Share, 2020-2032
Figure 28. By Country – Europe Radio Access Network (RAN) Equipment Sales Market Share, 2020-2032
Figure 29. Germany Radio Access Network (RAN) Equipment Revenue, (US$, Mn), 2020-2032
Figure 30. France Radio Access Network (RAN) Equipment Revenue, (US$, Mn), 2020-2032
Figure 31. U.K. Radio Access Network (RAN) Equipment Revenue, (US$, Mn), 2020-2032
Figure 32. Italy Radio Access Network (RAN) Equipment Revenue, (US$, Mn), 2020-2032
Figure 33. Russia Radio Access Network (RAN) Equipment Revenue, (US$, Mn), 2020-2032
Figure 34. Nordic Countries Radio Access Network (RAN) Equipment Revenue, (US$, Mn), 2020-2032
Figure 35. Benelux Radio Access Network (RAN) Equipment Revenue, (US$, Mn), 2020-2032
Figure 36. By Region – Asia Radio Access Network (RAN) Equipment Revenue Market Share, 2020-2032
Figure 37. By Region – Asia Radio Access Network (RAN) Equipment Sales Market Share, 2020-2032
Figure 38. China Radio Access Network (RAN) Equipment Revenue, (US$, Mn), 2020-2032
Figure 39. Japan Radio Access Network (RAN) Equipment Revenue, (US$, Mn), 2020-2032
Figure 40. South Korea Radio Access Network (RAN) Equipment Revenue, (US$, Mn), 2020-2032
Figure 41. Southeast Asia Radio Access Network (RAN) Equipment Revenue, (US$, Mn), 2020-2032
Figure 42. India Radio Access Network (RAN) Equipment Revenue, (US$, Mn), 2020-2032
Figure 43. By Country – South America Radio Access Network (RAN) Equipment Revenue Market Share, 2020-2032
Figure 44. By Country – South America Radio Access Network (RAN) Equipment Sales, Market Share, 2020-2032
Figure 45. Brazil Radio Access Network (RAN) Equipment Revenue, (US$, Mn), 2020-2032
Figure 46. Argentina Radio Access Network (RAN) Equipment Revenue, (US$, Mn), 2020-2032
Figure 47. By Country – Middle East & Africa Radio Access Network (RAN) Equipment Revenue, Market Share, 2020-2032
Figure 48. By Country – Middle East & Africa Radio Access Network (RAN) Equipment Sales, Market Share, 2020-2032
Figure 49. Turkey Radio Access Network (RAN) Equipment Revenue, (US$, Mn), 2020-2032
Figure 50. Israel Radio Access Network (RAN) Equipment Revenue, (US$, Mn), 2020-2032
Figure 51. Saudi Arabia Radio Access Network (RAN) Equipment Revenue, (US$, Mn), 2020-2032
Figure 52. UAE Radio Access Network (RAN) Equipment Revenue, (US$, Mn), 2020-2032
Figure 53. Global Radio Access Network (RAN) Equipment Production Capacity (K Units), 2020-2032
Figure 54. The Percentage of Production Radio Access Network (RAN) Equipment by Region, 2024 VS 2032
Figure 55. Radio Access Network (RAN) Equipment Industry Value Chain
Figure 56. Marketing Channels