MARKET INSIGHTS
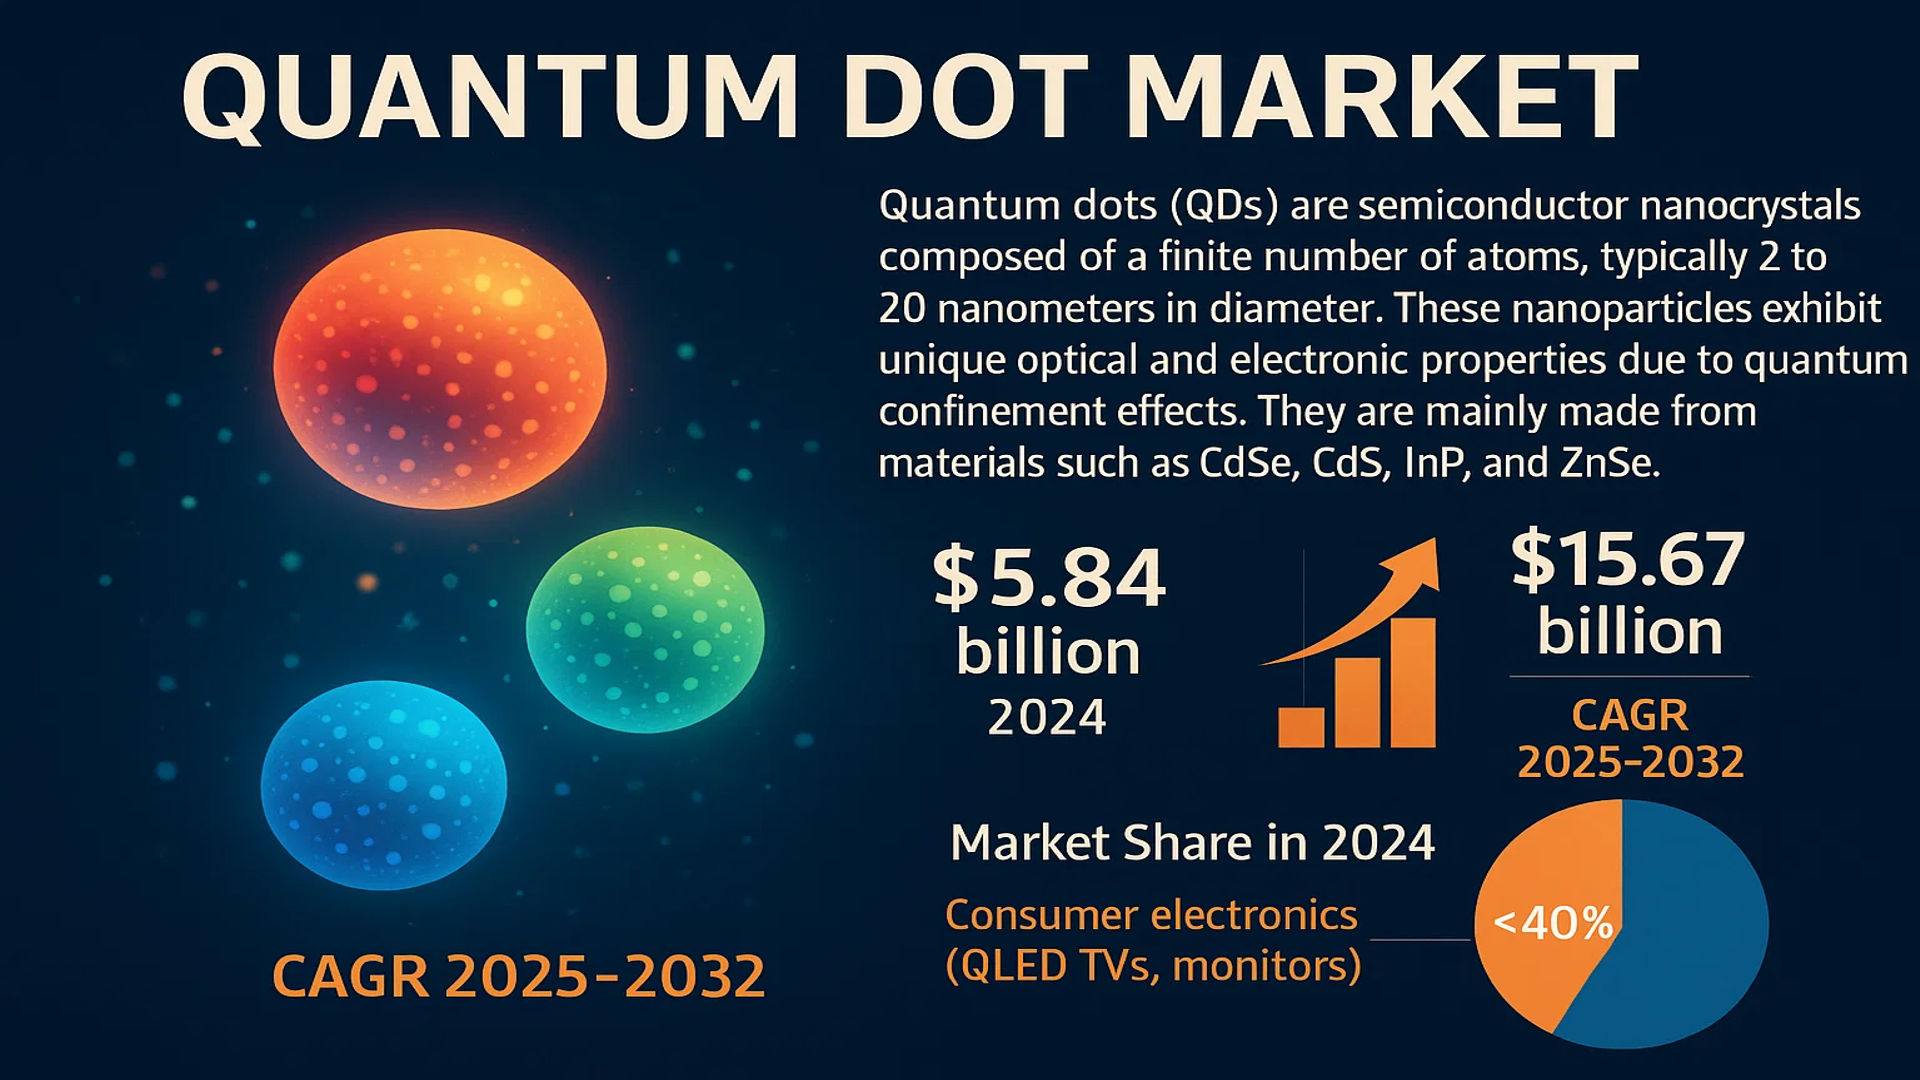
The global Quantum Dot Market size was valued at US$ 5.84 billion in 2024 and is projected to reach US$ 15.67 billion by 2032, at a CAGR of 13.1% during the forecast period 2025-2032.
Quantum dots (QDs) are semiconductor nanocrystals composed of a finite number of atoms, typically ranging from 2 to 20 nanometers in diameter. These nanoparticles exhibit unique optical and electronic properties due to quantum confinement effects, including size-tunable light emission, high photostability, wide excitation spectra, and narrow emission bands. They are primarily fabricated from materials such as cadmium selenide (CdSe), cadmium sulfide (CdS), indium phosphide (InP), and zinc selenide (ZnSe).
The market is experiencing robust growth driven by increasing adoption in consumer electronics, particularly in high-quality display technologies like QLED TVs and monitors, which accounted for over 40% of the market share in 2024. Furthermore, advancements in healthcare applications, such as bio-imaging and targeted drug delivery, are significantly contributing to expansion. Key players are actively engaging in strategic initiatives; for instance, in March 2024, Nanosys announced a partnership with a leading display manufacturer to enhance quantum dot production capacity. Samsung Electronics (QD Vision), Quantum Materials Corp., and Nanosys Inc. are among the dominant companies operating globally with extensive product portfolios.
MARKET DYNAMICS
MARKET DRIVERS
Rising Adoption in Consumer Electronics to Accelerate Market Expansion
The quantum dot market is experiencing robust growth driven by widespread adoption in consumer electronics, particularly in display technologies. Quantum dot-enhanced displays offer superior color gamut, brightness, and energy efficiency compared to traditional LCDs, making them highly desirable for high-end televisions, monitors, and mobile devices. The global demand for premium visual experiences has surged, with quantum dot displays capturing over 15% of the high-end TV market. This growth is further supported by continuous innovations in display technology, where quantum dots enable more than 90% of the BT.2020 color standard, significantly enhancing viewer immersion and satisfaction. Major electronics manufacturers are integrating quantum dot technology into their flagship products, reinforcing its market position and driving substantial revenue growth.
Advancements in Healthcare and Biomedical Applications to Fuel Demand
Quantum dots are revolutionizing biomedical imaging and diagnostics due to their unique optical properties, such as high brightness, photostability, and tunable emission spectra. These characteristics make them ideal for applications like bioimaging, biosensing, and drug delivery, where precision and reliability are critical. The healthcare sector’s increasing focus on early disease detection and personalized medicine has accelerated the adoption of quantum dot-based solutions. For instance, quantum dots are used in fluorescent labeling for cancer detection, offering higher sensitivity and specificity compared to conventional dyes. The global biomedical quantum dot market is projected to grow at a compound annual growth rate of over 14%, driven by rising investments in medical research and the development of novel diagnostic tools.
Growth in Renewable Energy Applications to Propel Market Forward
Quantum dots are gaining traction in the renewable energy sector, particularly in solar cells, where they enhance light absorption and conversion efficiency. Quantum dot solar cells (QDSCs) can achieve power conversion efficiencies exceeding 16%, making them a promising alternative to traditional photovoltaic technologies. Their ability to absorb a broader spectrum of sunlight and generate multiple excitons per photon positions them as a key innovation in next-generation solar energy solutions. Government initiatives and investments in clean energy infrastructure further support this growth, with the global solar energy market expected to expand significantly. As sustainability becomes a priority, quantum dot technology is poised to play a pivotal role in advancing renewable energy systems.
MARKET CHALLENGES
High Production Costs and Complex Manufacturing Processes to Hinder Market Growth
Despite its promising applications, the quantum dot market faces significant challenges related to high production costs and complex manufacturing processes. The synthesis of high-quality quantum dots requires precise control over size, composition, and surface properties, often involving expensive raw materials and specialized equipment. Cadmium-based quantum dots, which dominate certain applications due to their superior performance, face additional cost pressures from regulatory compliance and environmental concerns. The average production cost for quantum dots can be up to 40% higher than that of conventional materials, limiting their adoption in cost-sensitive markets. These financial barriers pose a substantial challenge for manufacturers striving to achieve scalability and affordability.
Other Challenges
Regulatory and Environmental Constraints
Stringent regulations governing the use of hazardous materials, such as cadmium, in quantum dot production create compliance challenges for market players. Regulatory bodies in regions like Europe and North America have imposed restrictions on cadmium-containing products, compelling manufacturers to invest in cadmium-free alternatives. While these alternatives are safer, they often lag in performance and require additional research and development, increasing time-to-market and operational costs.
Technical Limitations in Stability and Performance
Quantum dots are susceptible to degradation under prolonged exposure to light, heat, and oxygen, which can affect their performance and longevity. Ensuring stability in real-world applications remains a technical hurdle, particularly in industries like healthcare and consumer electronics, where reliability is paramount. Overcoming these limitations requires ongoing innovation in encapsulation and surface modification techniques, adding complexity to product development.
MARKET RESTRAINTS
Limited Commercialization and Scalability Issues to Restrain Market Growth
While quantum dot technology holds immense potential, its commercialization remains limited due to scalability challenges. Producing quantum dots at an industrial scale while maintaining consistent quality and performance is a complex endeavor. Variations in size and composition during large-scale synthesis can lead to inconsistencies in optical properties, affecting end-product reliability. Additionally, the lack of standardized manufacturing processes and equipment further complicates scalability efforts. These factors deter widespread adoption, particularly in industries requiring high-volume production, such as consumer electronics and energy.
Competition from Alternative Technologies to Limit Market Penetration
Quantum dots face stiff competition from emerging and established alternative technologies, such as organic light-emitting diodes (OLEDs) and perovskite solar cells. OLED displays, for example, offer similar benefits in color accuracy and energy efficiency without the complexities associated with quantum dot integration. In the energy sector, perovskite solar cells have demonstrated rapid efficiency improvements and lower production costs, posing a threat to quantum dot solar cells. This competitive landscape forces quantum dot manufacturers to continuously innovate and differentiate their offerings to maintain market relevance.
Intellectual Property and Patent Disputes to Create Uncertainty
The quantum dot market is characterized by intense intellectual property battles among key players, leading to legal disputes and licensing complexities. Patent infringements and overlapping claims can delay product launches and increase litigation costs, creating uncertainty for investors and stakeholders. These disputes often revolve around core technologies related to synthesis methods, material compositions, and application-specific innovations. Navigating this intricate IP landscape requires significant legal and financial resources, which can be particularly challenging for smaller companies and startups.
MARKET OPPORTUNITIES
Expansion into Emerging Applications to Unlock New Growth Avenues
The quantum dot market is poised for significant growth through expansion into emerging applications beyond traditional displays and solar cells. Fields such as quantum computing, security inks, and environmental monitoring offer untapped potential for quantum dot technology. In quantum computing, quantum dots are being explored as qubits for their ability to trap and manipulate individual electrons, paving the way for scalable quantum processors. Similarly, quantum dot-based security inks provide anti-counterfeiting solutions with unique optical signatures that are difficult to replicate. These diverse applications open new revenue streams and reduce dependency on saturated markets.
Strategic Collaborations and Investments to Drive Innovation
Increasing investments in research and development, coupled with strategic collaborations between academia, industry, and government bodies, are creating lucrative opportunities for market players. Partnerships aimed at advancing cadmium-free quantum dots and improving synthesis techniques are accelerating innovation and reducing production costs. For instance, recent collaborations have focused on developing eco-friendly quantum dots with enhanced performance characteristics, addressing both regulatory and environmental concerns. These initiatives not only foster technological advancements but also enhance market credibility and adoption.
Growing Demand in Asia-Pacific to Boost Market Prospects
The Asia-Pacific region, led by countries like China, South Korea, and Japan, represents a significant growth opportunity for the quantum dot market. Rapid industrialization, increasing disposable income, and strong government support for technological innovation are driving demand in this region. China, in particular, has emerged as a hub for quantum dot production and consumption, with local manufacturers investing heavily in capacity expansion and product development. The region’s dominance in consumer electronics manufacturing further amplifies this opportunity, as quantum dot displays become integral to next-generation devices.
QUANTUM DOT MARKET TRENDS
Advancements in Display Technologies to Emerge as a Dominant Trend
The global quantum dot market is experiencing robust growth, largely driven by significant advancements in display technologies. Quantum dots are increasingly being integrated into high-performance displays due to their superior color gamut, energy efficiency, and brightness compared to traditional LCD and OLED technologies. The display segment accounted for over 60% of the total market revenue in 2024, with televisions representing the largest application. This dominance is fueled by consumer demand for enhanced visual experiences, with quantum dot displays capable of reproducing over 90% of the BT.2020 color space, a substantial improvement over conventional displays. Furthermore, the adoption of quantum dot enhancement films (QDEF) in LCD panels has become a standard for mid-to-high-end television models, enabling manufacturers to offer premium picture quality at more competitive price points. The continuous R&D in this sector focuses on improving the stability, longevity, and cost-effectiveness of quantum dot materials, ensuring their sustained integration into next-generation visual technologies.
Other Trends
Expansion in Healthcare and Life Sciences Applications
Beyond displays, the utilization of quantum dots in healthcare and life sciences is expanding rapidly, presenting a significant growth vector for the market. Their unique photoluminescent properties, including high quantum yield, photostability, and size-tunable emission spectra, make them ideal for advanced biomedical imaging, biosensing, and drug delivery systems. In diagnostics, quantum dots are being developed as highly sensitive fluorescent probes for multiplexed detection of biomarkers, enabling earlier and more accurate disease diagnosis. The global market for quantum dots in biomedical applications is projected to grow at a compound annual growth rate exceeding 15% through 2032. This growth is underpinned by increased research funding in nanomedicine and a rising prevalence of chronic diseases requiring sophisticated diagnostic tools. The ability of quantum dots to be conjugated with various biomolecules without quenching their fluorescence is a key technological advantage driving their adoption in this high-value sector.
Strategic Shift Towards Cadmium-Free Quantum Dots
A pivotal trend shaping the market’s future is the strategic industry-wide shift towards cadmium-free quantum dots, primarily driven by stringent environmental regulations and growing consumer awareness. Regulatory bodies in North America and Europe have implemented strict restrictions on the use of heavy metals like cadmium in consumer electronics, compelling manufacturers to invest heavily in alternative materials such as indium phosphide (InP) and perovskite quantum dots. The cadmium-free segment’s market share is anticipated to increase from approximately 45% in 2024 to over 70% by 2032. This transition, while technically challenging, has accelerated innovation, leading to cadmium-free variants that now rival the performance of their cadmium-based counterparts in terms of color purity and efficiency. This trend not only ensures regulatory compliance but also opens new market opportunities in eco-conscious consumer segments and regions with strict material regulations, thereby future-proofing the industry’s growth.
COMPETITIVE LANDSCAPE
Key Industry Players
Technological Innovation and Strategic Expansion Drive Market Competition
The global quantum dot market exhibits a dynamic and semi-consolidated competitive structure, characterized by the presence of established multinational corporations, specialized technology firms, and emerging regional players. Samsung Electronics (through its QD Vision acquisition) maintains a dominant position, largely due to its extensive integration of quantum dot technology into its market-leading QLED television displays and its robust intellectual property portfolio. The company’s significant manufacturing scale and strong consumer electronics distribution network provide a substantial competitive advantage.
Nanosys Inc. and Quantum Materials Corp are also pivotal players, collectively accounting for a considerable portion of the market’s material supply. Their growth is primarily fueled by continuous research and development efforts aimed at enhancing quantum yield, color purity, and developing cadmium-free alternatives to meet stringent environmental regulations, particularly in Europe and North America. These companies have aggressively pursued patent development, creating a complex web of intellectual property that presents both a barrier to entry and a foundation for strategic licensing agreements.
Furthermore, these leading entities are actively engaging in growth initiatives, including capacity expansions and the formation of strategic partnerships with display manufacturers and biomedical companies. Such moves are anticipated to solidify their market positions throughout the forecast period. For instance, recent expansions into micro-LED applications and quantum dot sensor technology represent significant growth vectors beyond traditional display applications.
Meanwhile, Chinese manufacturers like Suzhou Xingshuo Nano Technology Co. Ltd and Najing Tech are strengthening their foothold by leveraging cost-effective production capabilities and catering to the burgeoning domestic consumer electronics market. Their strategy often involves focusing on scaling production for mid-range display products and investing in applied research to close the technological gap with Western counterparts. However, they face challenges related to international patent landscapes and the global shift toward more stringent environmental, social, and governance (ESG) compliance.
List of Key Quantum Dot Companies Profiled
- Samsung Electronics (QD Vision) (South Korea)
- Nanosys Inc. (U.S.)
- Quantum Materials Corp (U.S.)
- Suzhou Xingshuo Nano Technology Co. Ltd (China)
- Xingzi (Shanghai) New Material Technology Development Co., Ltd (China)
- Najing Tech (China)
Segment Analysis:
By Type
Cadmium-Free Quantum Dots Segment Dominates the Market Due to Rising Environmental and Health Regulations
The market is segmented based on type into:
- Cadmium-Free Quantum Dots
- Subtypes: Indium Phosphide (InP), Zinc Selenide (ZnSe), and others
- Cadmium-Containing Quantum Dots
- Subtypes: Cadmium Selenide (CdSe), Cadmium Sulfide (CdS), Cadmium Telluride (CdTe), and others
- Others
- Subtypes: Metal Nanocrystals, Oxide Nanocrystals, etc.
By Application
Consumer Electronics Segment Leads Due to High Adoption in Display Technologies
The market is segmented based on application into:
- Consumer Electronics
- Subtypes: QLED TVs, Monitors, Smartphones, and others
- Health Care
- Subtypes: Bio-imaging, Drug Delivery, and others
- Defence
- Subtypes: Security Marking, Sensors, and others
- Industrial
- Subtypes: Photovoltaics, Lighting, and others
- Other
By End User
Display Manufacturers Segment Leads Due to High Demand for Enhanced Visual Experiences
The market is segmented based on end user into:
- Display Manufacturers
- Healthcare and Biotechnology Companies
- Research and Academic Institutions
- Defence and Security Organizations
- Others
By Region
Asia-Pacific Segment Leads Due to Strong Manufacturing Base and High Consumer Electronics Demand
The market is segmented based on region into:
- North America
- Subtypes: US, Canada, Mexico
- Europe
- Subtypes: Germany, France, UK, and others
- Asia-Pacific
- Subtypes: China, Japan, South Korea, and others
- Rest of World
- Subtypes: South America, Middle East & Africa
Regional Analysis: Quantum Dot Market
Asia-Pacific
The Asia-Pacific region dominates the global quantum dot market, accounting for over 45% of total revenue share in 2024. This leadership position is primarily driven by China’s massive electronics manufacturing sector and South Korea’s display technology innovation. China’s quantum dot market is experiencing explosive growth due to substantial government investments in nanotechnology research and strong domestic demand for high-quality display panels. Major Chinese producers like Suzhou Xingshuo Nano Technology and Najing Tech are expanding production capacities to meet both domestic and international demand. South Korea maintains its technological edge through Samsung Electronics’ QD Vision division, which continues to pioneer quantum dot applications in QLED televisions and advanced displays. The region benefits from robust supply chains, competitive manufacturing costs, and growing consumer electronics markets across China, India, and Southeast Asia. However, the market faces challenges regarding cadmium-containing quantum dots, with increasing regulatory scrutiny pushing manufacturers toward cadmium-free alternatives.
North America
North America represents the second-largest quantum dot market, characterized by strong research and development activities and early adoption of quantum dot technologies. The United States leads the region with significant contributions from companies like Nanosys and Quantum Materials Corporation, which are at the forefront of developing cadmium-free quantum dots for display and lighting applications. The region’s market growth is fueled by high consumer demand for premium display products, particularly in the television and monitor segments. Strict environmental regulations, including restrictions on hazardous substances, are accelerating the transition toward environmentally friendly quantum dot solutions. Additionally, substantial investments in quantum dot research from both private sector and government agencies, including the National Science Foundation and Department of Energy, are driving innovation in biomedical imaging, solar cells, and security applications. The market benefits from well-established intellectual property protection and strong collaboration between academic institutions and industry players.
Europe
Europe maintains a significant position in the quantum dot market, driven by stringent environmental regulations and strong focus on research and innovation. The EU’s Restriction of Hazardous Substances (RoHS) directive has been particularly influential in pushing the market toward cadmium-free quantum dot solutions. Germany, the UK, and France are the leading markets within the region, with strong academic research institutions collaborating with industrial partners to develop advanced quantum dot applications. European companies are focusing on high-value applications in healthcare, particularly in biomedical imaging and diagnostics, where quantum dots offer superior performance compared to traditional fluorescent markers. The region also shows growing interest in quantum dot applications for energy efficiency, including quantum dot solar cells and LED lighting. However, the market faces challenges related to higher production costs and competition from Asian manufacturers, leading European companies to focus on specialized, high-margin applications rather than mass-market display products.
South America
The quantum dot market in South America is in its early development stages but shows promising growth potential. Brazil represents the largest market in the region, driven by growing electronics manufacturing and increasing consumer demand for advanced display technologies. The market is primarily import-dependent, with most quantum dot materials and products sourced from North American and Asian suppliers. Limited local manufacturing capabilities and research infrastructure present challenges for market development. However, governments in the region are beginning to recognize the importance of nanotechnology and are initiating programs to support local research and development. Economic volatility and currency fluctuations sometimes hinder consistent market growth, but the long-term outlook remains positive as consumer electronics markets expand and display technologies become more affordable. The region shows particular potential in biomedical applications, with several research institutions exploring quantum dots for diagnostic purposes.
Middle East & Africa
The quantum dot market in the Middle East and Africa is emerging gradually, with most activity concentrated in technologically advanced countries like Israel, Saudi Arabia, and the UAE. Israel stands out as a regional innovation hub, with several startups and research institutions working on quantum dot applications in displays, solar energy, and medical diagnostics. The region benefits from substantial government investments in technology diversification, particularly in Gulf Cooperation Council countries seeking to reduce their dependence on oil revenues. However, the market faces significant challenges including limited local manufacturing capabilities, reliance on imports, and underdeveloped distribution networks. Infrastructure limitations in many African countries further restrict market growth. Despite these challenges, the long-term potential exists as urbanization increases and consumer electronics markets expand. The region shows particular interest in quantum dot applications for solar energy, given the abundant sunlight available across most Middle Eastern and African countries.
Report Scope
This market research report provides a comprehensive analysis of the global Quantum Dot market, covering the forecast period 2025–2032. It offers detailed insights into market dynamics, technological advancements, competitive landscape, and key trends shaping the industry.
Key focus areas of the report include:
- Market Size & Forecast: Historical data and future projections for revenue, unit shipments, and market value across major regions and segments.
- Segmentation Analysis: Detailed breakdown by product type, technology, application, and end-user industry to identify high-growth segments and investment opportunities.
- Regional Outlook: Insights into market performance across North America, Europe, Asia-Pacific, Latin America, and the Middle East & Africa, including country-level analysis where relevant.
- Competitive Landscape: Profiles of leading market participants, including their product offerings, R&D focus, manufacturing capacity, pricing strategies, and recent developments such as mergers, acquisitions, and partnerships.
- Technology Trends & Innovation: Assessment of emerging technologies, integration of AI/IoT, semiconductor design trends, fabrication techniques, and evolving industry standards.
- Market Drivers & Restraints: Evaluation of factors driving market growth along with challenges, supply chain constraints, regulatory issues, and market-entry barriers.
- Stakeholder Analysis: Insights for component suppliers, OEMs, system integrators, investors, and policymakers regarding the evolving ecosystem and strategic opportunities.
Primary and secondary research methods are employed, including interviews with industry experts, data from verified sources, and real-time market intelligence to ensure the accuracy and reliability of the insights presented.
FREQUENTLY ASKED QUESTIONS:
What is the current market size of Global Quantum Dot Market?
-> Quantum Dot Market size was valued at US$ 5.84 billion in 2024 and is projected to reach US$ 15.67 billion by 2032, at a CAGR of 13.1% during the forecast period 2025-2032.
Which key companies operate in Global Quantum Dot Market?
-> Key players include Quantum Materials, Samsung Electronics (QD Vision), Nanosys, Suzhou Xingshuo Nano Technology Co. Ltd, Xingzi (Shanghai) New Material Technology Development Co., Ltd, and Najing Tech, among others.
What are the key growth drivers?
-> Key growth drivers include increasing demand for high-quality displays in consumer electronics, advancements in healthcare imaging technologies, and the growing adoption of energy-efficient solutions in solar cells and lighting.
Which region dominates the market?
-> Asia-Pacific is the largest and fastest-growing region, driven by strong manufacturing capabilities and high consumer electronics demand, particularly in China, South Korea, and Japan.
What are the emerging trends?
-> Emerging trends include the development of cadmium-free quantum dots for eco-friendly applications, integration into next-generation QLED TVs, and expanding use in biomedical imaging and quantum computing research.

Get Sample Report PDF for Exclusive Insights
Report Sample Includes
- Table of Contents
- List of Tables & Figures
- Charts, Research Methodology, and more...
 Download Sample Report PDF