Precision Op Amps Market, Size, Trends, Business Strategies 2025-2032

Global Precision Op Amps market size was estimated at USD 1804 million in 2023 and is projected to reach USD 2488.07 million by 2030, exhibiting a CAGR of 4.70% during the forecast period.

PDF Icon Download Sample Report PDF
  • Quick Dispatch

    All Orders

  • Secure Payment

    100% Secure Payment

Compare

$1,500.00$4,250.00

Clear

Precision Op Amps Market Overview

The increasing adoption of precision operational amplifiers in test and measurement instruments, medical devices, and automotive electronics is driving market expansion. Precision Op Amps with low offset voltage and minimal temperature drift characteristics are crucial for high-accuracy applications.

This report provides a deep insight into the global Precision Op Amps market covering all its essential aspects. This ranges from a macro overview of the market to micro details of the market size, competitive landscape, development trend, niche market, key market drivers and challenges, SWOT analysis, value chain analysis, etc.

The analysis helps the reader to shape the competition within the industries and strategies for the competitive environment to enhance the potential profit. Furthermore, it provides a simple framework for evaluating and accessing the position of the business organization. The report structure also focuses on the competitive landscape of the Global Precision Op Amps Market, this report introduces in detail the market share, market performance, product situation, operation situation, etc. of the main players, which helps the readers in the industry to identify the main competitors and deeply understand the competition pattern of the market.
In a word, this report is a must-read for industry players, investors, researchers, consultants, business strategists, and all those who have any kind of stake or are planning to foray into the Precision Op Amps market in any manner.

Precision Op Amps Market Analysis:

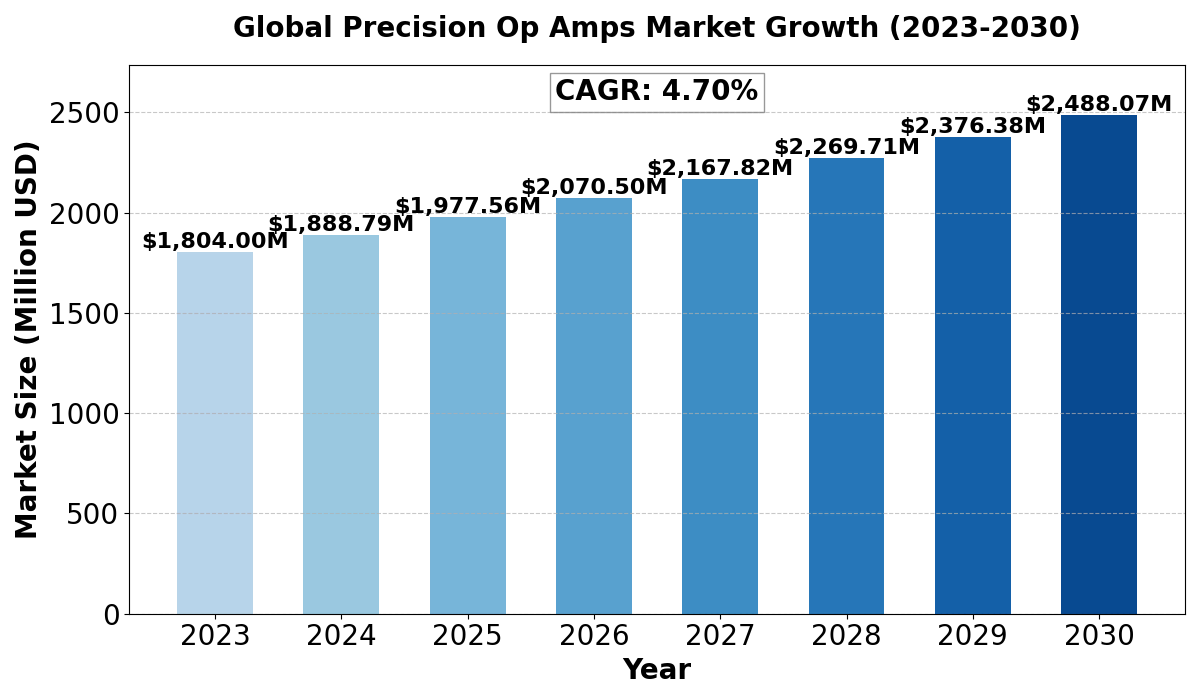
The global Precision Op Amps market size was estimated at USD 1804 million in 2023 and is projected to reach USD 2488.07 million by 2030, exhibiting a CAGR of 4.70% during the forecast period.

North America Precision Op Amps market size was USD 470.07 million in 2023, at a CAGR of 4.03% during the forecast period of 2025 through 2030.

Precision Op Amps Key Market Trends  :

  1. Rising Demand in Medical Devices – Precision Op Amps are widely used in medical imaging and diagnostic equipment, where high accuracy is critical.
  2. Expansion in Automotive Electronics – Increasing integration of electronic components in vehicles, including advanced driver-assistance systems (ADAS) and electric vehicle (EV) power management, is fueling demand.
  3. Growth in IoT and Industrial Automation – The rise of smart sensors and automation systems is boosting the adoption of precision Op Amps in control systems and measurement instruments.
  4. Advancements in Low-Power Amplifiers – Manufacturers are focusing on developing energy-efficient Op Amps to meet the growing demand for battery-powered applications.
  5. Emerging Use in Aerospace and Defense – Precision Op Amps are gaining traction in radar systems, communication equipment, and defense electronics for enhanced signal processing.

Precision Op Amps Market Regional Analysis :

semi insight

  • North America:Strong demand driven by EVs, 5G infrastructure, and renewable energy, with the U.S. leading the market.
  • Europe:Growth fueled by automotive electrification, renewable energy, and strong regulatory support, with Germany as a key player.
  • Asia-Pacific:Dominates the market due to large-scale manufacturing in China and Japan, with growing demand from EVs, 5G, and semiconductors.
  • South America:Emerging market, driven by renewable energy and EV adoption, with Brazil leading growth.
  • Middle East & Africa:Gradual growth, mainly due to investments in renewable energy and EV infrastructure, with Saudi Arabia and UAE as key contributors.

Precision Op Amps Market Segmentation

The research report includes specific segments by region (country), manufacturers, Type, and Application. Market segmentation creates subsets of a market based on product type, end-user or application, Geographic, and other factors. By understanding the market segments, the decision-maker can leverage this targeting in the product, sales, and marketing strategies. Market segments can power your product development cycles by informing how you create product offerings for different segments.

Key Company

  • Orbotech (KLA)
  • ADTEC
  • SCREEN
  • Chime Ball Technology
  • ORC Manufacturing
  • Manz (KLEO)
  • Ofuna Technology Co.
  • Ltd.
  • Symtek Automation
  • C SUN
  • AMPOC
  • GROUP UP Industrial (GP)
  • Gallant Precision Machining (GPM)
  • Eclat Forever Company
  • Utechzone
  • Ta Liang Technology
  • MACHVISION Inc Co.
  • LTD
  • GigaVis
  • CIMS
  • Favite
  • FUSEI MENIX
  • Mycronic (atg)
  • Circuit Fabology Microelectronics Equipment Co.,Ltd.
  • TZTEK Company
  • Han’s Laser
  • Jiangsu Yingsu IC Equipment
  • Kun Shan Korbe Precision Equipment
  • Kunshan Dongwei Technology
  • INSPEC
  • Saki Corporation
  • Via Mechanics
  • MKS (ESI)
  • Tongtai Machine & Tool

Market Segmentation (by Type)

  • Direct Imaging Exposure System/LDI
  • Drilling Machine for IC Substrate
  • Automated Optical Inspection (AOI) for IC Substrate
  • Routing Machine for IC Substrate
  • Automated Vision Inspection (AVI) for IC Substrate
  • ABF Film Laminator
  • VCP Equipment
  • Flying Probe Tester
  • PTH
  • Others

Market Segmentation (by Application)

  • FC-BGA (ABF)
  • FC-CSP
  • BGA/CSP
  • SiP and RF Modules
  • Others

Drivers

  • Increasing Adoption in Medical and Industrial Applications – High-precision amplifiers play a vital role in medical instruments and industrial automation, driving market growth.
  • Growing Demand for High-Accuracy Signal Processing – The need for precise data acquisition in test and measurement instruments fuels demand for precision Op Amps.
  • Expansion of the Automotive Electronics Sector – Rising deployment of electronic control units (ECUs) in vehicles is contributing to market expansion.

Restraints

  • High Cost of Precision Op Amps – The advanced design and manufacturing process make precision Op Amps costlier compared to standard operational amplifiers.
  • Complex Integration in High-Precision Circuits – Designing circuits with precision Op Amps requires expertise, which can pose challenges for new market entrants.
  • Supply Chain Disruptions – Semiconductor shortages and fluctuating raw material prices can impact production and availability.

Opportunities

  • Advancements in Low-Voltage and Low-Power Designs – Innovations in ultra-low power precision Op Amps open new applications in portable and battery-operated devices.
  • Rising Demand for Smart Healthcare Devices – The growing market for wearable medical devices and remote monitoring systems creates opportunities for Op Amp manufacturers.
  • Expansion of 5G and IoT Infrastructure – The deployment of 5G networks and the increasing number of connected devices drive demand for high-performance analog components.

Challenges

  • Competition from Alternative Technologies – Emerging semiconductor technologies and digital signal processors (DSPs) could limit the growth potential of precision Op Amps.
  • Stringent Regulatory Standards – Compliance with industry regulations for medical and automotive electronics can slow down product approvals and market entry.
  • Limited Availability of Skilled Workforce – The complexity of analog circuit design and testing requires specialized expertise, posing a challenge for new companies.

Key Benefits of This Market Research:

  • Industry drivers, restraints, and opportunities covered in the study
  • Neutral perspective on the market performance
  • Recent industry trends and developments
  • Competitive landscape & strategies of key players
  • Potential & niche segments and regions exhibiting promising growth covered
  • Historical, current, and projected market size, in terms of value
  • In-depth analysis of the Precision Op Amps Market
  • Overview of the regional outlook of the Precision Op Amps Market:

Key Reasons to Buy this Report:

  • Access to date statistics compiled by our researchers. These provide you with historical and forecast data, which is analyzed to tell you why your market is set to change
  • This enables you to anticipate market changes to remain ahead of your competitors
  • You will be able to copy data from the Excel spreadsheet straight into your marketing plans, business presentations, or other strategic documents
  • The concise analysis, clear graph, and table format will enable you to pinpoint the information you require quickly
  • Provision of market value data for each segment and sub-segment
  • Indicates the region and segment that is expected to witness the fastest growth as well as to dominate the market
  • Provides insight into the market through Value Chain
  • Market dynamics scenario, along with growth opportunities of the market in the years to come
  • 6-month post-sales analyst support

Customization of the Report
In case of any queries or customization requirements, please connect with our sales team, who will ensure that your requirements are met.

FAQs

What are the key driving factors and opportunities in the Precision Op Amps market?
The key drivers include increasing demand in medical, industrial, and automotive applications, along with advancements in low-power amplifier designs. Opportunities exist in the expansion of smart healthcare, IoT devices, and 5G infrastructure.


Which region is projected to have the largest market share?
Asia-Pacific is expected to dominate the market due to its strong semiconductor manufacturing base and high demand from consumer electronics and industrial automation sectors. North America is also growing steadily, driven by advancements in medical and automotive applications.


Who are the top players in the global Precision Op Amps market?
Leading companies include Texas Instruments, Analog Devices Inc., Maxim Integrated, STM, Microchip Technology Inc., Intersil Corporation, Onsemi, and New Japan Radio.


What are the latest technological advancements in the industry?
Recent innovations include ultra-low power precision Op Amps, improved thermal stability, and high-speed amplifiers for real-time signal processing in medical and industrial applications.


What is the current size of the global Precision Op Amps market?
The global market was valued at USD 642.30 million in 2023 and is projected to reach USD 903.78 million by 2030, growing at a CAGR of 5.00% during the forecast period.

Precision Op Amps Market, Size, Trends, Business Strategies 2025-2032

Get Sample Report PDF for Exclusive Insights

Report Sample Includes

  • Table of Contents
  • List of Tables & Figures
  • Charts, Research Methodology, and more...
PDF Icon Download Sample Report PDF

Download Sample Report

Table of Content

Table of Contents
1 Research Methodology and Statistical Scope
1.1 Market Definition and Statistical Scope of Precision Op Amps
1.2 Key Market Segments
1.2.1 Precision Op Amps Segment by Type
1.2.2 Precision Op Amps Segment by Application
1.3 Methodology & Sources of Information
1.3.1 Research Methodology
1.3.2 Research Process
1.3.3 Market Breakdown and Data Triangulation
1.3.4 Base Year
1.3.5 Report Assumptions & Caveats
2 Precision Op Amps Market Overview
2.1 Global Market Overview
2.1.1 Global Precision Op Amps Market Size (M USD) Estimates and Forecasts (2019-2030)
2.1.2 Global Precision Op Amps Sales Estimates and Forecasts (2019-2030)
2.2 Market Segment Executive Summary
2.3 Global Market Size by Region
3 Precision Op Amps Market Competitive Landscape
3.1 Global Precision Op Amps Sales by Manufacturers (2019-2025)
3.2 Global Precision Op Amps Revenue Market Share by Manufacturers (2019-2025)
3.3 Precision Op Amps Market Share by Company Type (Tier 1, Tier 2, and Tier 3)
3.4 Global Precision Op Amps Average Price by Manufacturers (2019-2025)
3.5 Manufacturers Precision Op Amps Sales Sites, Area Served, Product Type
3.6 Precision Op Amps Market Competitive Situation and Trends
3.6.1 Precision Op Amps Market Concentration Rate
3.6.2 Global 5 and 10 Largest Precision Op Amps Players Market Share by Revenue
3.6.3 Mergers & Acquisitions, Expansion
4 Precision Op Amps Industry Chain Analysis
4.1 Precision Op Amps Industry Chain Analysis
4.2 Market Overview of Key Raw Materials
4.3 Midstream Market Analysis
4.4 Downstream Customer Analysis
5 The Development and Dynamics of Precision Op Amps Market
5.1 Key Development Trends
5.2 Driving Factors
5.3 Market Challenges
5.4 Market Restraints
5.5 Industry News
5.5.1 New Product Developments
5.5.2 Mergers & Acquisitions
5.5.3 Expansions
5.5.4 Collaboration/Supply Contracts
5.6 Industry Policies
6 Precision Op Amps Market Segmentation by Type
6.1 Evaluation Matrix of Segment Market Development Potential (Type)
6.2 Global Precision Op Amps Sales Market Share by Type (2019-2025)
6.3 Global Precision Op Amps Market Size Market Share by Type (2019-2025)
6.4 Global Precision Op Amps Price by Type (2019-2025)
7 Precision Op Amps Market Segmentation by Application
7.1 Evaluation Matrix of Segment Market Development Potential (Application)
7.2 Global Precision Op Amps Market Sales by Application (2019-2025)
7.3 Global Precision Op Amps Market Size (M USD) by Application (2019-2025)
7.4 Global Precision Op Amps Sales Growth Rate by Application (2019-2025)
8 Precision Op Amps Market Segmentation by Region
8.1 Global Precision Op Amps Sales by Region
8.1.1 Global Precision Op Amps Sales by Region
8.1.2 Global Precision Op Amps Sales Market Share by Region
8.2 North America
8.2.1 North America Precision Op Amps Sales by Country
8.2.2 U.S.
8.2.3 Canada
8.2.4 Mexico
8.3 Europe
8.3.1 Europe Precision Op Amps Sales by Country
8.3.2 Germany
8.3.3 France
8.3.4 U.K.
8.3.5 Italy
8.3.6 Russia
8.4 Asia Pacific
8.4.1 Asia Pacific Precision Op Amps Sales by Region
8.4.2 China
8.4.3 Japan
8.4.4 South Korea
8.4.5 India
8.4.6 Southeast Asia
8.5 South America
8.5.1 South America Precision Op Amps Sales by Country
8.5.2 Brazil
8.5.3 Argentina
8.5.4 Columbia
8.6 Middle East and Africa
8.6.1 Middle East and Africa Precision Op Amps Sales by Region
8.6.2 Saudi Arabia
8.6.3 UAE
8.6.4 Egypt
8.6.5 Nigeria
8.6.6 South Africa
9 Key Companies Profile
9.1 Texas Instruments
9.1.1 Texas Instruments Precision Op Amps Basic Information
9.1.2 Texas Instruments Precision Op Amps Product Overview
9.1.3 Texas Instruments Precision Op Amps Product Market Performance
9.1.4 Texas Instruments Business Overview
9.1.5 Texas Instruments Precision Op Amps SWOT Analysis
9.1.6 Texas Instruments Recent Developments
9.2 Analog Devices Inc.
9.2.1 Analog Devices Inc. Precision Op Amps Basic Information
9.2.2 Analog Devices Inc. Precision Op Amps Product Overview
9.2.3 Analog Devices Inc. Precision Op Amps Product Market Performance
9.2.4 Analog Devices Inc. Business Overview
9.2.5 Analog Devices Inc. Precision Op Amps SWOT Analysis
9.2.6 Analog Devices Inc. Recent Developments
9.3 Maxim Integrated
9.3.1 Maxim Integrated Precision Op Amps Basic Information
9.3.2 Maxim Integrated Precision Op Amps Product Overview
9.3.3 Maxim Integrated Precision Op Amps Product Market Performance
9.3.4 Maxim Integrated Precision Op Amps SWOT Analysis
9.3.5 Maxim Integrated Business Overview
9.3.6 Maxim Integrated Recent Developments
9.4 STM
9.4.1 STM Precision Op Amps Basic Information
9.4.2 STM Precision Op Amps Product Overview
9.4.3 STM Precision Op Amps Product Market Performance
9.4.4 STM Business Overview
9.4.5 STM Recent Developments
9.5 Microchip Technology Inc.
9.5.1 Microchip Technology Inc. Precision Op Amps Basic Information
9.5.2 Microchip Technology Inc. Precision Op Amps Product Overview
9.5.3 Microchip Technology Inc. Precision Op Amps Product Market Performance
9.5.4 Microchip Technology Inc. Business Overview
9.5.5 Microchip Technology Inc. Recent Developments
9.6 Intersil Corporation
9.6.1 Intersil Corporation Precision Op Amps Basic Information
9.6.2 Intersil Corporation Precision Op Amps Product Overview
9.6.3 Intersil Corporation Precision Op Amps Product Market Performance
9.6.4 Intersil Corporation Business Overview
9.6.5 Intersil Corporation Recent Developments
9.7 Onsemi
9.7.1 Onsemi Precision Op Amps Basic Information
9.7.2 Onsemi Precision Op Amps Product Overview
9.7.3 Onsemi Precision Op Amps Product Market Performance
9.7.4 Onsemi Business Overview
9.7.5 Onsemi Recent Developments
9.8 New Japan Radio
9.8.1 New Japan Radio Precision Op Amps Basic Information
9.8.2 New Japan Radio Precision Op Amps Product Overview
9.8.3 New Japan Radio Precision Op Amps Product Market Performance
9.8.4 New Japan Radio Business Overview
9.8.5 New Japan Radio Recent Developments
10 Precision Op Amps Market Forecast by Region
10.1 Global Precision Op Amps Market Size Forecast
10.2 Global Precision Op Amps Market Forecast by Region
10.2.1 North America Market Size Forecast by Country
10.2.2 Europe Precision Op Amps Market Size Forecast by Country
10.2.3 Asia Pacific Precision Op Amps Market Size Forecast by Region
10.2.4 South America Precision Op Amps Market Size Forecast by Country
10.2.5 Middle East and Africa Forecasted Consumption of Precision Op Amps by Country
11 Forecast Market by Type and by Application (2025-2030)
11.1 Global Precision Op Amps Market Forecast by Type (2025-2030)
11.1.1 Global Forecasted Sales of Precision Op Amps by Type (2025-2030)
11.1.2 Global Precision Op Amps Market Size Forecast by Type (2025-2030)
11.1.3 Global Forecasted Price of Precision Op Amps by Type (2025-2030)
11.2 Global Precision Op Amps Market Forecast by Application (2025-2030)
11.2.1 Global Precision Op Amps Sales (K Units) Forecast by Application
11.2.2 Global Precision Op Amps Market Size (M USD) Forecast by Application (2025-2030)
12 Conclusion and Key FindingsList of Tables
Table 1. Introduction of the Type
Table 2. Introduction of the Application
Table 3. Market Size (M USD) Segment Executive Summary
Table 4. Precision Op Amps Market Size Comparison by Region (M USD)
Table 5. Global Precision Op Amps Sales (K Units) by Manufacturers (2019-2025)
Table 6. Global Precision Op Amps Sales Market Share by Manufacturers (2019-2025)
Table 7. Global Precision Op Amps Revenue (M USD) by Manufacturers (2019-2025)
Table 8. Global Precision Op Amps Revenue Share by Manufacturers (2019-2025)
Table 9. Company Type (Tier 1, Tier 2, and Tier 3) & (based on the Revenue in Precision Op Amps as of 2022)
Table 10. Global Market Precision Op Amps Average Price (USD/Unit) of Key Manufacturers (2019-2025)
Table 11. Manufacturers Precision Op Amps Sales Sites and Area Served
Table 12. Manufacturers Precision Op Amps Product Type
Table 13. Global Precision Op Amps Manufacturers Market Concentration Ratio (CR5 and HHI)
Table 14. Mergers & Acquisitions, Expansion Plans
Table 15. Industry Chain Map of Precision Op Amps
Table 16. Market Overview of Key Raw Materials
Table 17. Midstream Market Analysis
Table 18. Downstream Customer Analysis
Table 19. Key Development Trends
Table 20. Driving Factors
Table 21. Precision Op Amps Market Challenges
Table 22. Global Precision Op Amps Sales by Type (K Units)
Table 23. Global Precision Op Amps Market Size by Type (M USD)
Table 24. Global Precision Op Amps Sales (K Units) by Type (2019-2025)
Table 25. Global Precision Op Amps Sales Market Share by Type (2019-2025)
Table 26. Global Precision Op Amps Market Size (M USD) by Type (2019-2025)
Table 27. Global Precision Op Amps Market Size Share by Type (2019-2025)
Table 28. Global Precision Op Amps Price (USD/Unit) by Type (2019-2025)
Table 29. Global Precision Op Amps Sales (K Units) by Application
Table 30. Global Precision Op Amps Market Size by Application
Table 31. Global Precision Op Amps Sales by Application (2019-2025) & (K Units)
Table 32. Global Precision Op Amps Sales Market Share by Application (2019-2025)
Table 33. Global Precision Op Amps Sales by Application (2019-2025) & (M USD)
Table 34. Global Precision Op Amps Market Share by Application (2019-2025)
Table 35. Global Precision Op Amps Sales Growth Rate by Application (2019-2025)
Table 36. Global Precision Op Amps Sales by Region (2019-2025) & (K Units)
Table 37. Global Precision Op Amps Sales Market Share by Region (2019-2025)
Table 38. North America Precision Op Amps Sales by Country (2019-2025) & (K Units)
Table 39. Europe Precision Op Amps Sales by Country (2019-2025) & (K Units)
Table 40. Asia Pacific Precision Op Amps Sales by Region (2019-2025) & (K Units)
Table 41. South America Precision Op Amps Sales by Country (2019-2025) & (K Units)
Table 42. Middle East and Africa Precision Op Amps Sales by Region (2019-2025) & (K Units)
Table 43. Texas Instruments Precision Op Amps Basic Information
Table 44. Texas Instruments Precision Op Amps Product Overview
Table 45. Texas Instruments Precision Op Amps Sales (K Units), Revenue (M USD), Price (USD/Unit) and Gross Margin (2019-2025)
Table 46. Texas Instruments Business Overview
Table 47. Texas Instruments Precision Op Amps SWOT Analysis
Table 48. Texas Instruments Recent Developments
Table 49. Analog Devices Inc. Precision Op Amps Basic Information
Table 50. Analog Devices Inc. Precision Op Amps Product Overview
Table 51. Analog Devices Inc. Precision Op Amps Sales (K Units), Revenue (M USD), Price (USD/Unit) and Gross Margin (2019-2025)
Table 52. Analog Devices Inc. Business Overview
Table 53. Analog Devices Inc. Precision Op Amps SWOT Analysis
Table 54. Analog Devices Inc. Recent Developments
Table 55. Maxim Integrated Precision Op Amps Basic Information
Table 56. Maxim Integrated Precision Op Amps Product Overview
Table 57. Maxim Integrated Precision Op Amps Sales (K Units), Revenue (M USD), Price (USD/Unit) and Gross Margin (2019-2025)
Table 58. Maxim Integrated Precision Op Amps SWOT Analysis
Table 59. Maxim Integrated Business Overview
Table 60. Maxim Integrated Recent Developments
Table 61. STM Precision Op Amps Basic Information
Table 62. STM Precision Op Amps Product Overview
Table 63. STM Precision Op Amps Sales (K Units), Revenue (M USD), Price (USD/Unit) and Gross Margin (2019-2025)
Table 64. STM Business Overview
Table 65. STM Recent Developments
Table 66. Microchip Technology Inc. Precision Op Amps Basic Information
Table 67. Microchip Technology Inc. Precision Op Amps Product Overview
Table 68. Microchip Technology Inc. Precision Op Amps Sales (K Units), Revenue (M USD), Price (USD/Unit) and Gross Margin (2019-2025)
Table 69. Microchip Technology Inc. Business Overview
Table 70. Microchip Technology Inc. Recent Developments
Table 71. Intersil Corporation Precision Op Amps Basic Information
Table 72. Intersil Corporation Precision Op Amps Product Overview
Table 73. Intersil Corporation Precision Op Amps Sales (K Units), Revenue (M USD), Price (USD/Unit) and Gross Margin (2019-2025)
Table 74. Intersil Corporation Business Overview
Table 75. Intersil Corporation Recent Developments
Table 76. Onsemi Precision Op Amps Basic Information
Table 77. Onsemi Precision Op Amps Product Overview
Table 78. Onsemi Precision Op Amps Sales (K Units), Revenue (M USD), Price (USD/Unit) and Gross Margin (2019-2025)
Table 79. Onsemi Business Overview
Table 80. Onsemi Recent Developments
Table 81. New Japan Radio Precision Op Amps Basic Information
Table 82. New Japan Radio Precision Op Amps Product Overview
Table 83. New Japan Radio Precision Op Amps Sales (K Units), Revenue (M USD), Price (USD/Unit) and Gross Margin (2019-2025)
Table 84. New Japan Radio Business Overview
Table 85. New Japan Radio Recent Developments
Table 86. Global Precision Op Amps Sales Forecast by Region (2025-2030) & (K Units)
Table 87. Global Precision Op Amps Market Size Forecast by Region (2025-2030) & (M USD)
Table 88. North America Precision Op Amps Sales Forecast by Country (2025-2030) & (K Units)
Table 89. North America Precision Op Amps Market Size Forecast by Country (2025-2030) & (M USD)
Table 90. Europe Precision Op Amps Sales Forecast by Country (2025-2030) & (K Units)
Table 91. Europe Precision Op Amps Market Size Forecast by Country (2025-2030) & (M USD)
Table 92. Asia Pacific Precision Op Amps Sales Forecast by Region (2025-2030) & (K Units)
Table 93. Asia Pacific Precision Op Amps Market Size Forecast by Region (2025-2030) & (M USD)
Table 94. South America Precision Op Amps Sales Forecast by Country (2025-2030) & (K Units)
Table 95. South America Precision Op Amps Market Size Forecast by Country (2025-2030) & (M USD)
Table 96. Middle East and Africa Precision Op Amps Consumption Forecast by Country (2025-2030) & (Units)
Table 97. Middle East and Africa Precision Op Amps Market Size Forecast by Country (2025-2030) & (M USD)
Table 98. Global Precision Op Amps Sales Forecast by Type (2025-2030) & (K Units)
Table 99. Global Precision Op Amps Market Size Forecast by Type (2025-2030) & (M USD)
Table 100. Global Precision Op Amps Price Forecast by Type (2025-2030) & (USD/Unit)
Table 101. Global Precision Op Amps Sales (K Units) Forecast by Application (2025-2030)
Table 102. Global Precision Op Amps Market Size Forecast by Application (2025-2030) & (M USD)
List of Figures
Figure 1. Product Picture of Precision Op Amps
Figure 2. Data Triangulation
Figure 3. Key Caveats
Figure 4. Global Precision Op Amps Market Size (M USD), 2019-2030
Figure 5. Global Precision Op Amps Market Size (M USD) (2019-2030)
Figure 6. Global Precision Op Amps Sales (K Units) & (2019-2030)
Figure 7. Evaluation Matrix of Segment Market Development Potential (Type)
Figure 8. Evaluation Matrix of Segment Market Development Potential (Application)
Figure 9. Evaluation Matrix of Regional Market Development Potential
Figure 10. Precision Op Amps Market Size by Country (M USD)
Figure 11. Precision Op Amps Sales Share by Manufacturers in 2023
Figure 12. Global Precision Op Amps Revenue Share by Manufacturers in 2023
Figure 13. Precision Op Amps Market Share by Company Type (Tier 1, Tier 2 and Tier 3): 2023
Figure 14. Global Market Precision Op Amps Average Price (USD/Unit) of Key Manufacturers in 2023
Figure 15. The Global 5 and 10 Largest Players: Market Share by Precision Op Amps Revenue in 2023
Figure 16. Evaluation Matrix of Segment Market Development Potential (Type)
Figure 17. Global Precision Op Amps Market Share by Type
Figure 18. Sales Market Share of Precision Op Amps by Type (2019-2025)
Figure 19. Sales Market Share of Precision Op Amps by Type in 2023
Figure 20. Market Size Share of Precision Op Amps by Type (2019-2025)
Figure 21. Market Size Market Share of Precision Op Amps by Type in 2023
Figure 22. Evaluation Matrix of Segment Market Development Potential (Application)
Figure 23. Global Precision Op Amps Market Share by Application
Figure 24. Global Precision Op Amps Sales Market Share by Application (2019-2025)
Figure 25. Global Precision Op Amps Sales Market Share by Application in 2023
Figure 26. Global Precision Op Amps Market Share by Application (2019-2025)
Figure 27. Global Precision Op Amps Market Share by Application in 2023
Figure 28. Global Precision Op Amps Sales Growth Rate by Application (2019-2025)
Figure 29. Global Precision Op Amps Sales Market Share by Region (2019-2025)
Figure 30. North America Precision Op Amps Sales and Growth Rate (2019-2025) & (K Units)
Figure 31. North America Precision Op Amps Sales Market Share by Country in 2023
Figure 32. U.S. Precision Op Amps Sales and Growth Rate (2019-2025) & (K Units)
Figure 33. Canada Precision Op Amps Sales (K Units) and Growth Rate (2019-2025)
Figure 34. Mexico Precision Op Amps Sales (Units) and Growth Rate (2019-2025)
Figure 35. Europe Precision Op Amps Sales and Growth Rate (2019-2025) & (K Units)
Figure 36. Europe Precision Op Amps Sales Market Share by Country in 2023
Figure 37. Germany Precision Op Amps Sales and Growth Rate (2019-2025) & (K Units)
Figure 38. France Precision Op Amps Sales and Growth Rate (2019-2025) & (K Units)
Figure 39. U.K. Precision Op Amps Sales and Growth Rate (2019-2025) & (K Units)
Figure 40. Italy Precision Op Amps Sales and Growth Rate (2019-2025) & (K Units)
Figure 41. Russia Precision Op Amps Sales and Growth Rate (2019-2025) & (K Units)
Figure 42. Asia Pacific Precision Op Amps Sales and Growth Rate (K Units)
Figure 43. Asia Pacific Precision Op Amps Sales Market Share by Region in 2023
Figure 44. China Precision Op Amps Sales and Growth Rate (2019-2025) & (K Units)
Figure 45. Japan Precision Op Amps Sales and Growth Rate (2019-2025) & (K Units)
Figure 46. South Korea Precision Op Amps Sales and Growth Rate (2019-2025) & (K Units)
Figure 47. India Precision Op Amps Sales and Growth Rate (2019-2025) & (K Units)
Figure 48. Southeast Asia Precision Op Amps Sales and Growth Rate (2019-2025) & (K Units)
Figure 49. South America Precision Op Amps Sales and Growth Rate (K Units)
Figure 50. South America Precision Op Amps Sales Market Share by Country in 2023
Figure 51. Brazil Precision Op Amps Sales and Growth Rate (2019-2025) & (K Units)
Figure 52. Argentina Precision Op Amps Sales and Growth Rate (2019-2025) & (K Units)
Figure 53. Columbia Precision Op Amps Sales and Growth Rate (2019-2025) & (K Units)
Figure 54. Middle East and Africa Precision Op Amps Sales and Growth Rate (K Units)
Figure 55. Middle East and Africa Precision Op Amps Sales Market Share by Region in 2023
Figure 56. Saudi Arabia Precision Op Amps Sales and Growth Rate (2019-2025) & (K Units)
Figure 57. UAE Precision Op Amps Sales and Growth Rate (2019-2025) & (K Units)
Figure 58. Egypt Precision Op Amps Sales and Growth Rate (2019-2025) & (K Units)
Figure 59. Nigeria Precision Op Amps Sales and Growth Rate (2019-2025) & (K Units)
Figure 60. South Africa Precision Op Amps Sales and Growth Rate (2019-2025) & (K Units)
Figure 61. Global Precision Op Amps Sales Forecast by Volume (2019-2030) & (K Units)
Figure 62. Global Precision Op Amps Market Size Forecast by Value (2019-2030) & (M USD)
Figure 63. Global Precision Op Amps Sales Market Share Forecast by Type (2025-2030)
Figure 64. Global Precision Op Amps Market Share Forecast by Type (2025-2030)
Figure 65. Global Precision Op Amps Sales Forecast by Application (2025-2030)
Figure 66. Global Precision Op Amps Market Share Forecast by Application (2025-2030)