Piezoelectric Materials Market, Global Business Strategies 2025-2032

Piezoelectric Materials Market size was valued at USD 7.19 billion in 2024 to USD 11.11 billion by 2032, exhibiting a CAGR of 6.3% during the forecast period

PDF Icon Download Sample Report PDF
  • Quick Dispatch

    All Orders

  • Secure Payment

    100% Secure Payment

Price range: $1,500.00 through $4,250.00

Clear

MARKET INSIGHTS

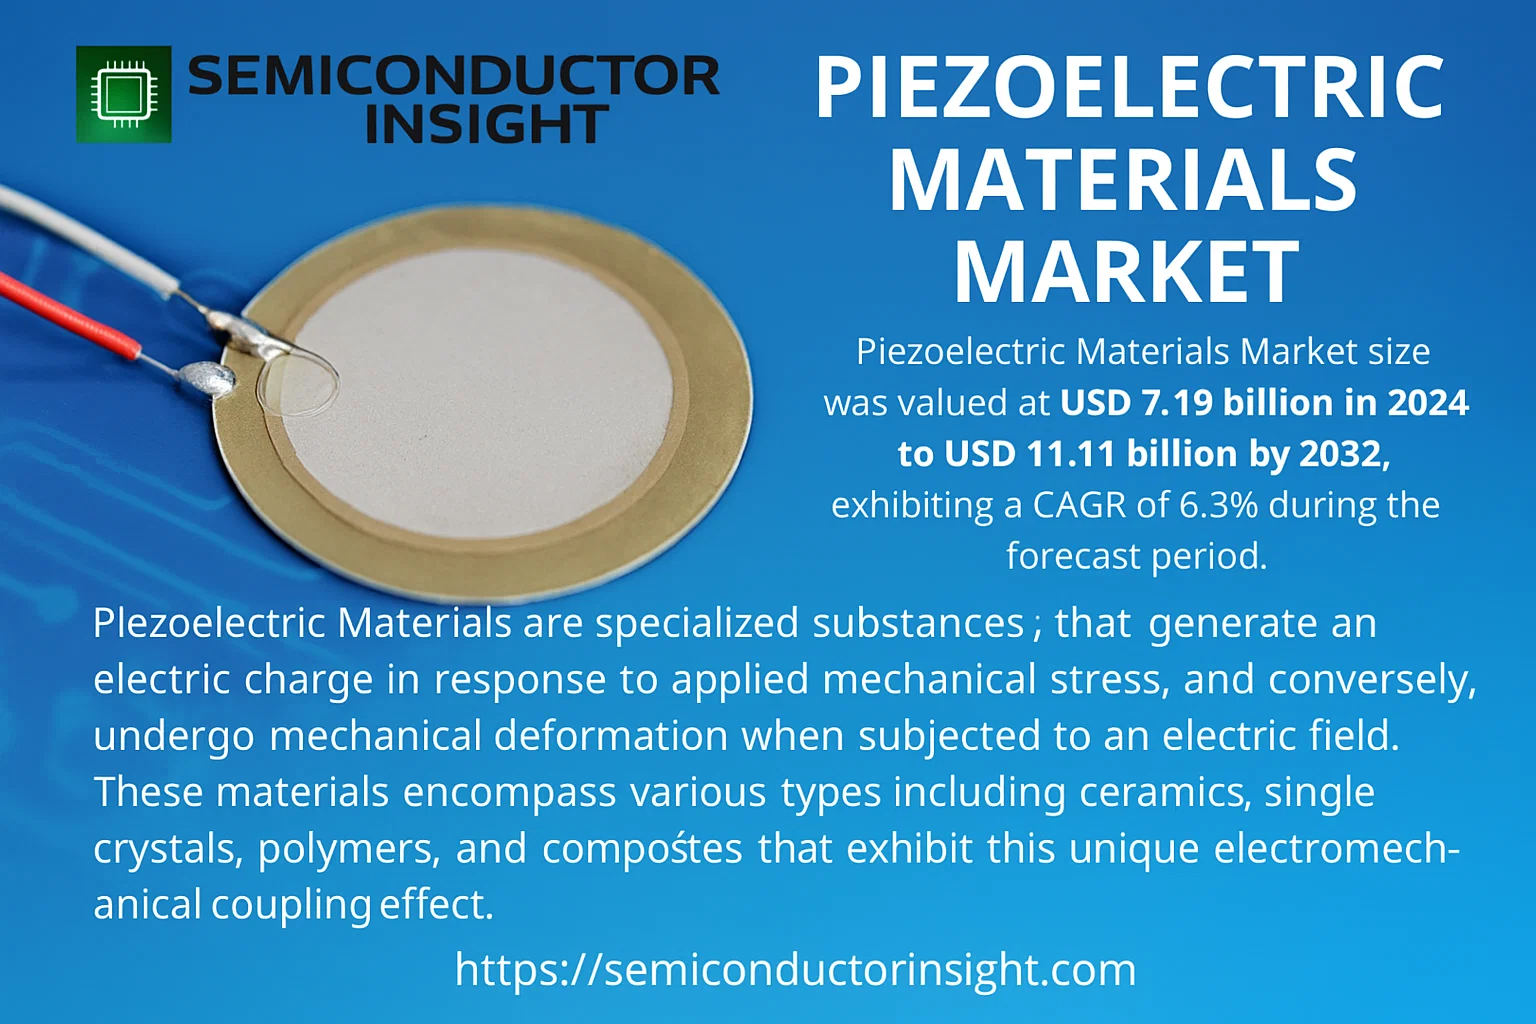
Global Piezoelectric Materials Market size was valued at USD 7.19 billion in 2024 to USD 11.11 billion by 2032, exhibiting a CAGR of 6.3% during the forecast period.

Piezoelectric materials are specialized substances that generate an electric charge in response to applied mechanical stress, and conversely, undergo mechanical deformation when subjected to an electric field. These materials encompass various types including ceramics, single crystals, polymers, and composites that exhibit this unique electromechanical coupling effect.

The market is experiencing steady growth due to several factors, including increased adoption in consumer electronics for sensors and actuators, growing demand from automotive applications for fuel injectors and parking sensors, and expanding medical device applications for ultrasound transducers and surgical instruments. Additionally, the rising integration of piezoelectric components in industrial automation systems and energy harvesting applications is contributing to market expansion. Initiatives by key players in developing advanced materials with improved performance characteristics are also expected to fuel market growth. For instance, manufacturers are focusing on lead-free piezoelectric ceramics to address environmental concerns while maintaining performance standards. KYOCERA, TDK Corporation, CeramTec GmbH, Murata Manufacturing Co., Ltd., and PI Ceramic GmbH are some of the key players that operate in the market with diverse product portfolios.

Piezoelectric Materials Market Trends- semiconductorinsight

MARKET DRIVERS

Expanding Applications in Consumer Electronics

The proliferation of consumer electronics that incorporate haptic feedback, precision sensors, and energy harvesting capabilities is a primary driver for the Piezoelectric Materials Market. The demand for thinner, more efficient components in smartphones, wearables, and tablets is pushing manufacturers to adopt advanced piezoelectric ceramics and polymers. The miniaturization trend in electronics requires materials that can generate precise movements or signals from very small form factors, a domain where piezoelectric technology excels.

Growth in Automotive Sensor Systems

The automotive industry’s shift towards electrification and advanced driver-assistance systems (ADAS) is significantly increasing the use of piezoelectric materials. These materials are critical components in ultrasonic sensors for parking assistance, pressure sensors for engine management, and injectors in fuel-efficient engines. The push for greater vehicle autonomy and safety standards globally is fueling substantial investment in these smart material systems.

Furthermore, the industrial sector’s increasing adoption of condition monitoring and non-destructive testing equipment utilizes piezoelectric transducers for predictive maintenance, reducing downtime and operational costs. This industrial automation trend, combined with supportive government initiatives for smart manufacturing, is creating a steady demand pipeline.

MARKET CHALLENGES

High Cost and Complex Manufacturing

The production of high-performance piezoelectric materials, especially single crystals and specific lead-free compositions, involves complex and energy-intensive processes. This results in a higher final cost compared to conventional materials, which can be a barrier to adoption in price-sensitive applications. Sintering ceramics to the required density and achieving precise poling alignment adds significant manufacturing complexity and cost.

Other Challenges

Supply Chain Vulnerabilities for Raw Materials
The market is susceptible to disruptions in the supply of key raw materials, such as lead zirconate titanate (PZT) precursors or rare earth elements used in certain compositions. Geopolitical factors and environmental regulations concerning mining can create volatility in availability and pricing.

Technical Limitations in Harsh Environments
While robust, some piezoelectric materials can experience performance degradation, such as depolarization, at very high temperatures or under sustained high-stress conditions. Developing formulations that maintain stability and longevity in extreme environments remains a significant technical hurdle for aerospace and energy applications.

MARKET RESTRAINTS

Stringent Environmental Regulations

Regulatory pressures, particularly the Restriction of Hazardous Substances (RoHS) directive, pose a significant restraint on the dominant lead-based piezoelectric ceramics segment. The development of commercially viable, high-performance lead-free alternatives has been challenging, slowing adoption in regions with strict environmental compliance requirements. The costs associated with reformulating products and requalifying them for critical applications inhibit market growth.

Competition from Alternative Technologies

Piezoelectric materials face competition from other transduction technologies, such as electroactive polymers and electrostatic actuators, which may offer advantages in specific areas like flexibility, lower driving voltages, or cost for large-area applications. In some sensing applications, emerging technologies like capacitive or optical sensors are providing alternative solutions, creating a competitive landscape that can limit market share growth.

MARKET OPPORTUNITIES

Energy Harvesting and Sustainable Solutions

The growing focus on sustainability and powering low-energy devices is opening vast opportunities for piezoelectric energy harvesting. Applications range from powering wireless sensor networks in industrial IoT settings to converting ambient vibrations from machinery or foot traffic into usable electricity. This aligns with global trends toward energy efficiency and could see significant growth as energy harvesting technology matures.

Advancements in Healthcare and Biomedical Devices

The healthcare sector presents a high-growth avenue, particularly for miniature piezoelectric components used in advanced medical imaging, ultrasonic therapy, implantable devices, and lab-on-a-chip diagnostics. The demand for minimally invasive surgical tools and precise drug delivery systems is driving innovation and creating new application areas for biocompatible piezoelectric materials.

Next-Generation Lead-Free Piezoelectrics

There is a substantial market opportunity for companies that successfully develop and commercialize high-performance lead-free piezoelectric materials. Achieving performance parity with lead-based ceramics could unlock applications currently restricted by regulations and cater to the growing consumer and industrial demand for eco-friendly electronic components.

Piezoelectric Materials Market TrendsExpansion Driven by Consumer Electronics and Automotive Sectors

Global Piezoelectric Materials Market is on a solid growth trajectory, with its value projected to rise from USD 7190 million in 2024 to approximately USD 11110 million by 2032, representing a compound annual growth rate (CAGR) of 6.3%. A dominant driver of this expansion is the extensive use of piezoelectric components in consumer electronics, which currently represents the largest application segment with a 39% market share. The proliferation of smartphones, wearables, and other smart devices that utilize piezoelectric materials for sensors, actuators, and acoustic components is a primary factor. Concurrently, the automotive industry’s increasing adoption of piezoelectric sensors for safety systems, fuel injection controls, and parking assistance is creating substantial demand. This dual-pronged demand from two major end-use sectors underpins the market’s robust outlook.

Other Trends

Regional Market Concentration and Competitive Landscape

The geographical distribution of the Piezoelectric Materials Market is highly concentrated, with China emerging as the undisputed leader, accounting for approximately 46% of Global market. This is followed by North America (20%) and Europe (19%). This regional dominance is linked to China’s massive manufacturing base for electronics and its strong industrial sector. The competitive landscape is fragmented, with the top five players, including KYOCERA, TDK, and Murata, collectively holding around 22% of the market share. This indicates a competitive environment with numerous players vying for market position through technological innovation and strategic expansions.

Product and Application Diversification

In terms of product types, piezoelectric ceramics are the most widely used material, commanding a 73% share of the market due to their excellent piezoelectric properties, durability, and cost-effectiveness. While consumer electronics remains the largest application, other segments like medical devices (for ultrasound imaging and surgical tools) and industrial manufacturing (for precision positioning and energy harvesting) are showing significant growth potential. This diversification across applications helps mitigate market risks and opens up new avenues for growth beyond the core electronics sector, indicating a maturing and resilient market structure.

COMPETITIVE LANDSCAPE

Key Industry Players

A concentrated market structure with the top five players accounting for approximately 22% of global revenues.

Global Piezoelectric Materials Market is valued at USD 7,190 million in 2024 and is projected to grow significantly, driven by demand from key application segments like consumer electronics. The market structure is moderately fragmented, with a handful of global giants and numerous specialized players. KYOCERA, TDK, CeramTec, Murata, and PI Ceramic GmbH are the leading companies, collectively holding a dominant market share. These players benefit from extensive R&D capabilities, broad product portfolios spanning piezoelectric ceramics and single crystals, and strong distribution networks that serve a global customer base, particularly in the Asia-Pacific region which dominates consumption. Competition is intensifying, focusing on material performance enhancements, cost reduction, and development of materials for next-generation applications in medical devices and automotive sensors.

Beyond the top-tier companies, the landscape includes several other significant manufacturers that have carved out strong positions in specific niches or geographic markets. These include major Chinese producers like Jiangsu Jiangjia Electronics, Zhejiang Jiakang Electronics, and Kaili Tech, who cater to the vast domestic market and compete effectively on price. Specialized Western firms such as CTS Corporation, Piezo Technologies, and TRS Technologies focus on high-performance applications in aerospace, defense, and medical technology, where material precision and reliability are paramount. Other notable players like Fuji Ceramics Corporation and Hoerbiger also contribute to the market’s diversity, serving industrial and manufacturing sectors with tailored solutions.

List of Key Piezoelectric Materials Companies Profiled

Segment Analysis:

Segment Category Sub-Segments Key Insights
By Type
  • Piezoelectric Ceramics
  • Piezoelectric Single Crystals
  • Organic Piezoelectric Materials
  • Others
Piezoelectric Ceramics lead the market due to their superior properties, including high piezoelectric coefficients, excellent mechanical strength, and thermal stability, making them the material of choice for a vast array of applications. They offer a well-established and cost-effective manufacturing base, which supports their dominance. Emerging organic materials are gaining interest for applications requiring flexibility and biocompatibility.
By Application
  • Consumer Electronics
  • Automotive
  • Industrial & Manufacturing
  • Medical
  • Military
  • Others
Consumer Electronics is the dominant application segment, driven by the pervasive use of piezoelectric components in everyday devices such as smartphones for haptic feedback, speakers, microphones, and inkjet printers. The sheer volume of consumer electronic devices produced globally ensures sustained and substantial demand. The automotive and medical sectors also represent significant and technologically advanced growth areas, utilizing these materials for sensors and precision actuators.
By End User
  • Original Equipment Manufacturers (OEMs)
  • Component Suppliers
  • Aftermarket and Service Providers
Original Equipment Manufacturers (OEMs) constitute the leading end-user segment, as they are the primary integrators of piezoelectric materials into finished goods across electronics, automotive, and industrial sectors. These manufacturers drive demand through large-scale production and continuous innovation in product design. Component suppliers form a critical link in the supply chain, while the aftermarket provides steady demand for replacement parts and specialized applications.
By Material Property Focus
  • High-Performance /High-Temperature
  • Flexible/Conformable
  • Bio-Compatible
High-Performance /High-Temperature materials are the leading segment, as the majority of industrial, automotive, and energy applications require robust performance under demanding thermal and mechanical conditions. There is, however, rapidly growing research and development interest in flexible and bio-compatible materials. These emerging categories are critical for unlocking new applications in wearable technology, medical implants, and soft robotics, representing a significant future growth vector.
By Technology Maturity
  • Mature/Standard
  • Emerging/Next-Generation
  • Niche/Specialized
Mature/Standard piezoelectric technologies dominate the current market landscape, characterized by well-understood materials like PZT ceramics and established manufacturing processes that ensure high volume, reliability, and cost-effectiveness. The market shows strong dynamism with the Emerging/Next-Generation segment, which is fueled by intense R&D efforts focused on lead-free alternatives, composite materials, and novel single crystals to meet future environmental regulations and performance demands, particularly in high-value sectors.

Regional Analysis: Piezoelectric Materials Market

Asia-Pacific

Asia-Pacific stands as the unequivocal leader in Global Piezoelectric Materials Market, driven by a powerful synergy of manufacturing prowess, technological innovation, and robust end-user demand. The region benefits from a concentrated and sophisticated electronics industry, particularly in countries like China, Japan, and South Korea, which are global hubs for consumer electronics, automotive sensors, and industrial automation systems. This creates a steady, high-volume demand for piezoelectric components used in everything from smartphones and medical devices to precision manufacturing equipment. Strong government support for research and development in advanced materials, coupled with significant investments in infrastructure and Industry 4.0 initiatives, further accelerates market growth. The presence of leading material science companies and a well-established supply chain for raw materials and components provides a significant competitive advantage. The region is also at the forefront of developing next-generation applications, such as energy harvesting systems and advanced medical imaging, ensuring its leadership position is well-defended for the foreseeable future. This combination of demand, innovation, and manufacturing capacity makes Asia-Pacific the central force shaping the market’s trajectory.

Electronics Manufacturing Hub
The region’s dominance in consumer electronics manufacturing creates an unparalleled, built-in demand for piezoelectric materials. These materials are integral components in speakers, microphones, filters, and sensors found in billions of devices produced annually. This high-volume, cost-sensitive environment fosters continuous innovation in material efficiency and performance.
Advanced Automotive Sector
With a rapidly growing automotive industry, particularly in China, the demand for piezoelectric sensors for engine management, safety systems, and infotainment is substantial. The push towards electric and autonomous vehicles is further driving the adoption of advanced piezoelectric components for precise sensing and actuation.
Government & R&D Focus
Substantial government initiatives and funding in countries like Japan and South Korea support advanced materials research. National programs focused on robotics, smart factories, and green technology directly benefit piezoelectric material development, leading to patents and novel applications that keep the region at the technological forefront.
Supply Chain Integration
A mature and integrated supply chain, from raw material processing to component assembly, provides significant cost and logistical advantages. This ecosystem allows for rapid prototyping and scaling of production, making it highly responsive to global market demands and enabling competitive pricing for piezoelectric products.

North America
North America represents a highly advanced and innovation-driven market for piezoelectric materials, characterized by strong demand from the aerospace, defense, and medical technology sectors. The region is home to leading research institutions and corporations that pioneer high-value applications, such as ultra-precise sensors for aerospace navigation, non-destructive testing equipment, and advanced medical diagnostic imaging systems like ultrasound. Stringent regulatory standards and a focus on quality and reliability push the development of high-performance, specialized piezoelectric ceramics and composites. The market is further stimulated by investments in energy harvesting technologies for IoT devices and industrial monitoring. While manufacturing volume may be lower than in Asia-Pacific, the emphasis on cutting-edge, high-margin applications ensures North America remains a critical and influential region in Global landscape.

Europe
The European market for piezoelectric materials is mature and steadily growing, driven by a strong industrial base in automotive manufacturing, industrial automation, and medical devices. Germany, in particular, is a key player due to its leadership in precision engineering and the automotive sector, where piezoelectric injectors and sensors are critical. The region exhibits a strong focus on sustainability and energy efficiency, promoting the use of piezoelectric materials in energy harvesting applications for smart buildings and infrastructure. Supportive EU policies and collaborative research projects foster innovation in smart materials. The presence of several specialized piezoelectric material manufacturers catering to niche, high-reliability applications in aerospace and medical technology also contributes to the region’s stable market position.

South America
The South American market for piezoelectric materials is emerging and currently characterized by more limited, localized demand. Growth is primarily driven by the industrial and energy sectors, with applications in process control sensors, flow meters, and some medical equipment. Brazil is the most significant market within the region, supported by its industrial base. However, market development is often constrained by economic volatility and less mature manufacturing and R&D infrastructure compared to other regions. The adoption of advanced piezoelectric applications is gradual, with growth potential linked to broader industrial modernization and foreign investment in sectors like mining and oil & gas, where sensing and monitoring technologies are essential.

Middle East & Africa
This region presents a developing market with growth potential primarily tied to infrastructure development and the energy industry. Applications for piezoelectric materials are found in oil and gas exploration sensors, industrial equipment monitoring, and basic medical devices. The market is nascent but shows promise as countries invest in diversifying their economies beyond hydrocarbons, potentially leading to increased demand for industrial automation and advanced electronics. The uptake of high-tech piezoelectric applications is slower, with the market largely dependent on imports. Long-term growth will be influenced by economic diversification plans, investments in healthcare infrastructure, and the development of local technological capabilities.

Report Scope

This market research report provides a comprehensive analysis of the Piezoelectric Materials Market , covering the forecast period 2025–2032. It offers detailed insights into market dynamics, technological advancements, competitive landscape, and key trends shaping the industry.

Key focus areas of the report include:

  • Market Overview: The report begins with an overview outlining its current market scenario, key growth indicators, and industry transformation drivers. It discusses macroeconomic factors, demand–supply balance, regulatory landscape, and the strategic role of semiconductors in powering advancements across industries such as automotive, telecommunications, consumer electronics, and industrial automation.
  • Market Size & Forecast: Historical data and future projections for revenue, unit shipments, and market value across major regions and segments.
  • Segmentation Analysis: Detailed breakdown by product type, technology, application, and end-user industry to identify high-growth segments and investment opportunities.
  • Regional Insights: Insights into market performance across North America, Europe, Asia-Pacific, Latin America, and the Middle East & Africa, including country-level analysis where relevant.
  • Competitive Landscape: Profiles of leading market participants, including their product offerings, R&D focus, manufacturing capacity, pricing strategies, and recent developments such as mergers, acquisitions, and partnerships.
  • Technology Trends & Innovation: Assessment of emerging technologies, integration of AI/IoT, semiconductor design trends, fabrication techniques, and evolving industry standards.
  • Market Drivers & Restraints: Evaluation of factors driving market growth along with challenges, supply chain constraints, regulatory issues, and market-entry barriers.
  • Stakeholder Insights: Insights for component suppliers, OEMs, system integrators, investors, and policymakers regarding the evolving ecosystem and strategic opportunities.

Primary and secondary research methods are employed, including interviews with industry experts, data from verified sources, and real-time market intelligence to ensure the accuracy and reliability of the insights presented.

FREQUENTLY ASKED QUESTIONS:

What is the current market size of Piezoelectric Materials Market?

-> Piezoelectric Materials Market size was valued at USD 7.19 billion in 2024 to USD 11.11 billion by 2032, exhibiting a CAGR of 6.3% during the forecast period.

Which key companies operate in Piezoelectric Materials Market?

-> Key players include KYOCERA, TDK, CeramTec, Murata, and PI Ceramic GmbH, among others. The top five players hold a share of about 22%.

What is the largest product segment in the Piezoelectric Materials Market?

-> In terms of product type, Piezoelectric Ceramics is the largest segment, accounting for a share of about 73%.

Which region dominates the market?

-> China is the world’s largest market for Piezoelectric Materials and holds a share of about 46%, followed by North America and Europe, with shares of about 20% and 19%, respectively.

What is the largest application field for Piezoelectric Materials?

-> In terms of application, Consumer Electronics is the largest field, with a share of about 39%.

Piezoelectric Materials Market, Global Business Strategies 2025-2032

Get Sample Report PDF for Exclusive Insights

Report Sample Includes

  • Table of Contents
  • List of Tables & Figures
  • Charts, Research Methodology, and more...
PDF Icon Download Sample Report PDF
SKU: a10a2510ab5a
Category:

Download Sample Report

Table of Content

1 Introduction to Research & Analysis Reports
1.1 Piezoelectric Materials Market Definition
1.2 Market Segments
1.2.1 Segment by Type
1.2.2 Segment by Application
1.3 Global Piezoelectric Materials Market Overview
1.4 Features & Benefits of This Report
1.5 Methodology & Sources of Information
1.5.1 Research Methodology
1.5.2 Research Process
1.5.3 Base Year
1.5.4 Report Assumptions & Caveats
2 Global Piezoelectric Materials Overall Market Size
2.1 Global Piezoelectric Materials Market Size: 2024 VS 2032
2.2 Global Piezoelectric Materials Market Size, Prospects & Forecasts: 2020-2032
2.3 Global Piezoelectric Materials Sales: 2020-2032
3 Company Landscape
3.1 Top Piezoelectric Materials Players in Global Market
3.2 Top Global Piezoelectric Materials Companies Ranked by Revenue
3.3 Global Piezoelectric Materials Revenue by Companies
3.4 Global Piezoelectric Materials Sales by Companies
3.5 Global Piezoelectric Materials Price by Manufacturer (2020-2025)
3.6 Top 3 and Top 5 Piezoelectric Materials Companies in Global Market, by Revenue in 2024
3.7 Global Manufacturers Piezoelectric Materials Product Type
3.8 Tier 1, Tier 2, and Tier 3 Piezoelectric Materials Players in Global Market
3.8.1 List of Global Tier 1 Piezoelectric Materials Companies
3.8.2 List of Global Tier 2 and Tier 3 Piezoelectric Materials Companies
4 Sights by Product
4.1 Overview
4.1.1 Segment by Type – Global Piezoelectric Materials Market Size Markets, 2024 & 2032
4.1.2 Piezoelectric Ceramics
4.1.3 Piezoelectric Single Crystals
4.1.4 Organic Piezoelectric Materials
4.1.5 Others
4.2 Segment by Type – Global Piezoelectric Materials Revenue & Forecasts
4.2.1 Segment by Type – Global Piezoelectric Materials Revenue, 2020-2025
4.2.2 Segment by Type – Global Piezoelectric Materials Revenue, 2026-2032
4.2.3 Segment by Type – Global Piezoelectric Materials Revenue Market Share, 2020-2032
4.3 Segment by Type – Global Piezoelectric Materials Sales & Forecasts
4.3.1 Segment by Type – Global Piezoelectric Materials Sales, 2020-2025
4.3.2 Segment by Type – Global Piezoelectric Materials Sales, 2026-2032
4.3.3 Segment by Type – Global Piezoelectric Materials Sales Market Share, 2020-2032
4.4 Segment by Type – Global Piezoelectric Materials Price (Manufacturers Selling Prices), 2020-2032
5 Sights by Application
5.1 Overview
5.1.1 Segment by Application – Global Piezoelectric Materials Market Size, 2024 & 2032
5.1.2 Industrial & Manufacturing
5.1.3 Automotive
5.1.4 Consumer Electronics
5.1.5 Medical
5.1.6 Military
5.1.7 Others
5.2 Segment by Application – Global Piezoelectric Materials Revenue & Forecasts
5.2.1 Segment by Application – Global Piezoelectric Materials Revenue, 2020-2025
5.2.2 Segment by Application – Global Piezoelectric Materials Revenue, 2026-2032
5.2.3 Segment by Application – Global Piezoelectric Materials Revenue Market Share, 2020-2032
5.3 Segment by Application – Global Piezoelectric Materials Sales & Forecasts
5.3.1 Segment by Application – Global Piezoelectric Materials Sales, 2020-2025
5.3.2 Segment by Application – Global Piezoelectric Materials Sales, 2026-2032
5.3.3 Segment by Application – Global Piezoelectric Materials Sales Market Share, 2020-2032
5.4 Segment by Application – Global Piezoelectric Materials Price (Manufacturers Selling Prices), 2020-2032
6 Sights by Region
6.1 By Region – Global Piezoelectric Materials Market Size, 2024 & 2032
6.2 By Region – Global Piezoelectric Materials Revenue & Forecasts
6.2.1 By Region – Global Piezoelectric Materials Revenue, 2020-2025
6.2.2 By Region – Global Piezoelectric Materials Revenue, 2026-2032
6.2.3 By Region – Global Piezoelectric Materials Revenue Market Share, 2020-2032
6.3 By Region – Global Piezoelectric Materials Sales & Forecasts
6.3.1 By Region – Global Piezoelectric Materials Sales, 2020-2025
6.3.2 By Region – Global Piezoelectric Materials Sales, 2026-2032
6.3.3 By Region – Global Piezoelectric Materials Sales Market Share, 2020-2032
6.4 North America
6.4.1 By Country – North America Piezoelectric Materials Revenue, 2020-2032
6.4.2 By Country – North America Piezoelectric Materials Sales, 2020-2032
6.4.3 United States Piezoelectric Materials Market Size, 2020-2032
6.4.4 Canada Piezoelectric Materials Market Size, 2020-2032
6.4.5 Mexico Piezoelectric Materials Market Size, 2020-2032
6.5 Europe
6.5.1 By Country – Europe Piezoelectric Materials Revenue, 2020-2032
6.5.2 By Country – Europe Piezoelectric Materials Sales, 2020-2032
6.5.3 Germany Piezoelectric Materials Market Size, 2020-2032
6.5.4 France Piezoelectric Materials Market Size, 2020-2032
6.5.5 U.K. Piezoelectric Materials Market Size, 2020-2032
6.5.6 Italy Piezoelectric Materials Market Size, 2020-2032
6.5.7 Russia Piezoelectric Materials Market Size, 2020-2032
6.5.8 Nordic Countries Piezoelectric Materials Market Size, 2020-2032
6.5.9 Benelux Piezoelectric Materials Market Size, 2020-2032
6.6 Asia
6.6.1 By Region – Asia Piezoelectric Materials Revenue, 2020-2032
6.6.2 By Region – Asia Piezoelectric Materials Sales, 2020-2032
6.6.3 China Piezoelectric Materials Market Size, 2020-2032
6.6.4 Japan Piezoelectric Materials Market Size, 2020-2032
6.6.5 South Korea Piezoelectric Materials Market Size, 2020-2032
6.6.6 Southeast Asia Piezoelectric Materials Market Size, 2020-2032
6.6.7 India Piezoelectric Materials Market Size, 2020-2032
6.7 South America
6.7.1 By Country – South America Piezoelectric Materials Revenue, 2020-2032
6.7.2 By Country – South America Piezoelectric Materials Sales, 2020-2032
6.7.3 Brazil Piezoelectric Materials Market Size, 2020-2032
6.7.4 Argentina Piezoelectric Materials Market Size, 2020-2032
6.8 Middle East & Africa
6.8.1 By Country – Middle East & Africa Piezoelectric Materials Revenue, 2020-2032
6.8.2 By Country – Middle East & Africa Piezoelectric Materials Sales, 2020-2032
6.8.3 Turkey Piezoelectric Materials Market Size, 2020-2032
6.8.4 Israel Piezoelectric Materials Market Size, 2020-2032
6.8.5 Saudi Arabia Piezoelectric Materials Market Size, 2020-2032
6.8.6 UAE Piezoelectric Materials Market Size, 2020-2032
7 Manufacturers & Brands Profiles
7.1 KYOCERA
7.1.1 KYOCERA Company Summary
7.1.2 KYOCERA Business Overview
7.1.3 KYOCERA Piezoelectric Materials Major Product Offerings
7.1.4 KYOCERA Piezoelectric Materials Sales and Revenue in Global (2020-2025)
7.1.5 KYOCERA Key News & Latest Developments
7.2 TDK
7.2.1 TDK Company Summary
7.2.2 TDK Business Overview
7.2.3 TDK Piezoelectric Materials Major Product Offerings
7.2.4 TDK Piezoelectric Materials Sales and Revenue in Global (2020-2025)
7.2.5 TDK Key News & Latest Developments
7.3 CeramTec
7.3.1 CeramTec Company Summary
7.3.2 CeramTec Business Overview
7.3.3 CeramTec Piezoelectric Materials Major Product Offerings
7.3.4 CeramTec Piezoelectric Materials Sales and Revenue in Global (2020-2025)
7.3.5 CeramTec Key News & Latest Developments
7.4 Murata
7.4.1 Murata Company Summary
7.4.2 Murata Business Overview
7.4.3 Murata Piezoelectric Materials Major Product Offerings
7.4.4 Murata Piezoelectric Materials Sales and Revenue in Global (2020-2025)
7.4.5 Murata Key News & Latest Developments
7.5 PI Ceramic GmbH
7.5.1 PI Ceramic GmbH Company Summary
7.5.2 PI Ceramic GmbH Business Overview
7.5.3 PI Ceramic GmbH Piezoelectric Materials Major Product Offerings
7.5.4 PI Ceramic GmbH Piezoelectric Materials Sales and Revenue in Global (2020-2025)
7.5.5 PI Ceramic GmbH Key News & Latest Developments
7.6 Fuji Ceramics Corporation
7.6.1 Fuji Ceramics Corporation Company Summary
7.6.2 Fuji Ceramics Corporation Business Overview
7.6.3 Fuji Ceramics Corporation Piezoelectric Materials Major Product Offerings
7.6.4 Fuji Ceramics Corporation Piezoelectric Materials Sales and Revenue in Global (2020-2025)
7.6.5 Fuji Ceramics Corporation Key News & Latest Developments
7.7 CTS Corporation
7.7.1 CTS Corporation Company Summary
7.7.2 CTS Corporation Business Overview
7.7.3 CTS Corporation Piezoelectric Materials Major Product Offerings
7.7.4 CTS Corporation Piezoelectric Materials Sales and Revenue in Global (2020-2025)
7.7.5 CTS Corporation Key News & Latest Developments
7.8 Jiangsu Jiangjia Electronics
7.8.1 Jiangsu Jiangjia Electronics Company Summary
7.8.2 Jiangsu Jiangjia Electronics Business Overview
7.8.3 Jiangsu Jiangjia Electronics Piezoelectric Materials Major Product Offerings
7.8.4 Jiangsu Jiangjia Electronics Piezoelectric Materials Sales and Revenue in Global (2020-2025)
7.8.5 Jiangsu Jiangjia Electronics Key News & Latest Developments
7.9 Kaili Tech
7.9.1 Kaili Tech Company Summary
7.9.2 Kaili Tech Business Overview
7.9.3 Kaili Tech Piezoelectric Materials Major Product Offerings
7.9.4 Kaili Tech Piezoelectric Materials Sales and Revenue in Global (2020-2025)
7.9.5 Kaili Tech Key News & Latest Developments
7.10 Hoerbiger
7.10.1 Hoerbiger Company Summary
7.10.2 Hoerbiger Business Overview
7.10.3 Hoerbiger Piezoelectric Materials Major Product Offerings
7.10.4 Hoerbiger Piezoelectric Materials Sales and Revenue in Global (2020-2025)
7.10.5 Hoerbiger Key News & Latest Developments
7.11 Piezo Technologies
7.11.1 Piezo Technologies Company Summary
7.11.2 Piezo Technologies Business Overview
7.11.3 Piezo Technologies Piezoelectric Materials Major Product Offerings
7.11.4 Piezo Technologies Piezoelectric Materials Sales and Revenue in Global (2020-2025)
7.11.5 Piezo Technologies Key News & Latest Developments
7.12 Zhejiang Jiakang Electronics
7.12.1 Zhejiang Jiakang Electronics Company Summary
7.12.2 Zhejiang Jiakang Electronics Business Overview
7.12.3 Zhejiang Jiakang Electronics Piezoelectric Materials Major Product Offerings
7.12.4 Zhejiang Jiakang Electronics Piezoelectric Materials Sales and Revenue in Global (2020-2025)
7.12.5 Zhejiang Jiakang Electronics Key News & Latest Developments
7.13 TRS Technologies
7.13.1 TRS Technologies Company Summary
7.13.2 TRS Technologies Business Overview
7.13.3 TRS Technologies Piezoelectric Materials Major Product Offerings
7.13.4 TRS Technologies Piezoelectric Materials Sales and Revenue in Global (2020-2025)
7.13.5 TRS Technologies Key News & Latest Developments
8 Global Piezoelectric Materials Production Capacity, Analysis
8.1 Global Piezoelectric Materials Production Capacity, 2020-2032
8.2 Piezoelectric Materials Production Capacity of Key Manufacturers in Global Market
8.3 Global Piezoelectric Materials Production by Region
9 Key Market Trends, Opportunity, Drivers and Restraints
9.1 Market Opportunities & Trends
9.2 Market Drivers
9.3 Market Restraints
10 Piezoelectric Materials Supply Chain Analysis
10.1 Piezoelectric Materials Industry Value Chain
10.2 Piezoelectric Materials Upstream Market
10.3 Piezoelectric Materials Downstream and Clients
10.4 Marketing Channels Analysis
10.4.1 Marketing Channels
10.4.2 Piezoelectric Materials Distributors and Sales Agents in Global
11 Conclusion
12 Appendix
12.1 Note
12.2 Examples of Clients
12.3 DisclaimerList of Tables
Table 1. Key Players of Piezoelectric Materials in Global Market
Table 2. Top Piezoelectric Materials Players in Global Market, Ranking by Revenue (2024)
Table 3. Global Piezoelectric Materials Revenue by Companies, (US$, Mn), 2020-2025
Table 4. Global Piezoelectric Materials Revenue Share by Companies, 2020-2025
Table 5. Global Piezoelectric Materials Sales by Companies, (Million Units), 2020-2025
Table 6. Global Piezoelectric Materials Sales Share by Companies, 2020-2025
Table 7. Key Manufacturers Piezoelectric Materials Price (2020-2025) & (US$/K Units)
Table 8. Global Manufacturers Piezoelectric Materials Product Type
Table 9. List of Global Tier 1 Piezoelectric Materials Companies, Revenue (US$, Mn) in 2024 and Market Share
Table 10. List of Global Tier 2 and Tier 3 Piezoelectric Materials Companies, Revenue (US$, Mn) in 2024 and Market Share
Table 11. Segment by Type – Global Piezoelectric Materials Revenue, (US$, Mn), 2024 & 2032
Table 12. Segment by Type – Global Piezoelectric Materials Revenue (US$, Mn), 2020-2025
Table 13. Segment by Type – Global Piezoelectric Materials Revenue (US$, Mn), 2026-2032
Table 14. Segment by Type – Global Piezoelectric Materials Sales (Million Units), 2020-2025
Table 15. Segment by Type – Global Piezoelectric Materials Sales (Million Units), 2026-2032
Table 16. Segment by Application – Global Piezoelectric Materials Revenue, (US$, Mn), 2024 & 2032
Table 17. Segment by Application – Global Piezoelectric Materials Revenue, (US$, Mn), 2020-2025
Table 18. Segment by Application – Global Piezoelectric Materials Revenue, (US$, Mn), 2026-2032
Table 19. Segment by Application – Global Piezoelectric Materials Sales, (Million Units), 2020-2025
Table 20. Segment by Application – Global Piezoelectric Materials Sales, (Million Units), 2026-2032
Table 21. By Region – Global Piezoelectric Materials Revenue, (US$, Mn), 2025-2032
Table 22. By Region – Global Piezoelectric Materials Revenue, (US$, Mn), 2020-2025
Table 23. By Region – Global Piezoelectric Materials Revenue, (US$, Mn), 2026-2032
Table 24. By Region – Global Piezoelectric Materials Sales, (Million Units), 2020-2025
Table 25. By Region – Global Piezoelectric Materials Sales, (Million Units), 2026-2032
Table 26. By Country – North America Piezoelectric Materials Revenue, (US$, Mn), 2020-2025
Table 27. By Country – North America Piezoelectric Materials Revenue, (US$, Mn), 2026-2032
Table 28. By Country – North America Piezoelectric Materials Sales, (Million Units), 2020-2025
Table 29. By Country – North America Piezoelectric Materials Sales, (Million Units), 2026-2032
Table 30. By Country – Europe Piezoelectric Materials Revenue, (US$, Mn), 2020-2025
Table 31. By Country – Europe Piezoelectric Materials Revenue, (US$, Mn), 2026-2032
Table 32. By Country – Europe Piezoelectric Materials Sales, (Million Units), 2020-2025
Table 33. By Country – Europe Piezoelectric Materials Sales, (Million Units), 2026-2032
Table 34. By Region – Asia Piezoelectric Materials Revenue, (US$, Mn), 2020-2025
Table 35. By Region – Asia Piezoelectric Materials Revenue, (US$, Mn), 2026-2032
Table 36. By Region – Asia Piezoelectric Materials Sales, (Million Units), 2020-2025
Table 37. By Region – Asia Piezoelectric Materials Sales, (Million Units), 2026-2032
Table 38. By Country – South America Piezoelectric Materials Revenue, (US$, Mn), 2020-2025
Table 39. By Country – South America Piezoelectric Materials Revenue, (US$, Mn), 2026-2032
Table 40. By Country – South America Piezoelectric Materials Sales, (Million Units), 2020-2025
Table 41. By Country – South America Piezoelectric Materials Sales, (Million Units), 2026-2032
Table 42. By Country – Middle East & Africa Piezoelectric Materials Revenue, (US$, Mn), 2020-2025
Table 43. By Country – Middle East & Africa Piezoelectric Materials Revenue, (US$, Mn), 2026-2032
Table 44. By Country – Middle East & Africa Piezoelectric Materials Sales, (Million Units), 2020-2025
Table 45. By Country – Middle East & Africa Piezoelectric Materials Sales, (Million Units), 2026-2032
Table 46. KYOCERA Company Summary
Table 47. KYOCERA Piezoelectric Materials Product Offerings
Table 48. KYOCERA Piezoelectric Materials Sales (Million Units), Revenue (US$, Mn) and Average Price (US$/K Units) & (2020-2025)
Table 49. KYOCERA Key News & Latest Developments
Table 50. TDK Company Summary
Table 51. TDK Piezoelectric Materials Product Offerings
Table 52. TDK Piezoelectric Materials Sales (Million Units), Revenue (US$, Mn) and Average Price (US$/K Units) & (2020-2025)
Table 53. TDK Key News & Latest Developments
Table 54. CeramTec Company Summary
Table 55. CeramTec Piezoelectric Materials Product Offerings
Table 56. CeramTec Piezoelectric Materials Sales (Million Units), Revenue (US$, Mn) and Average Price (US$/K Units) & (2020-2025)
Table 57. CeramTec Key News & Latest Developments
Table 58. Murata Company Summary
Table 59. Murata Piezoelectric Materials Product Offerings
Table 60. Murata Piezoelectric Materials Sales (Million Units), Revenue (US$, Mn) and Average Price (US$/K Units) & (2020-2025)
Table 61. Murata Key News & Latest Developments
Table 62. PI Ceramic GmbH Company Summary
Table 63. PI Ceramic GmbH Piezoelectric Materials Product Offerings
Table 64. PI Ceramic GmbH Piezoelectric Materials Sales (Million Units), Revenue (US$, Mn) and Average Price (US$/K Units) & (2020-2025)
Table 65. PI Ceramic GmbH Key News & Latest Developments
Table 66. Fuji Ceramics Corporation Company Summary
Table 67. Fuji Ceramics Corporation Piezoelectric Materials Product Offerings
Table 68. Fuji Ceramics Corporation Piezoelectric Materials Sales (Million Units), Revenue (US$, Mn) and Average Price (US$/K Units) & (2020-2025)
Table 69. Fuji Ceramics Corporation Key News & Latest Developments
Table 70. CTS Corporation Company Summary
Table 71. CTS Corporation Piezoelectric Materials Product Offerings
Table 72. CTS Corporation Piezoelectric Materials Sales (Million Units), Revenue (US$, Mn) and Average Price (US$/K Units) & (2020-2025)
Table 73. CTS Corporation Key News & Latest Developments
Table 74. Jiangsu Jiangjia Electronics Company Summary
Table 75. Jiangsu Jiangjia Electronics Piezoelectric Materials Product Offerings
Table 76. Jiangsu Jiangjia Electronics Piezoelectric Materials Sales (Million Units), Revenue (US$, Mn) and Average Price (US$/K Units) & (2020-2025)
Table 77. Jiangsu Jiangjia Electronics Key News & Latest Developments
Table 78. Kaili Tech Company Summary
Table 79. Kaili Tech Piezoelectric Materials Product Offerings
Table 80. Kaili Tech Piezoelectric Materials Sales (Million Units), Revenue (US$, Mn) and Average Price (US$/K Units) & (2020-2025)
Table 81. Kaili Tech Key News & Latest Developments
Table 82. Hoerbiger Company Summary
Table 83. Hoerbiger Piezoelectric Materials Product Offerings
Table 84. Hoerbiger Piezoelectric Materials Sales (Million Units), Revenue (US$, Mn) and Average Price (US$/K Units) & (2020-2025)
Table 85. Hoerbiger Key News & Latest Developments
Table 86. Piezo Technologies Company Summary
Table 87. Piezo Technologies Piezoelectric Materials Product Offerings
Table 88. Piezo Technologies Piezoelectric Materials Sales (Million Units), Revenue (US$, Mn) and Average Price (US$/K Units) & (2020-2025)
Table 89. Piezo Technologies Key News & Latest Developments
Table 90. Zhejiang Jiakang Electronics Company Summary
Table 91. Zhejiang Jiakang Electronics Piezoelectric Materials Product Offerings
Table 92. Zhejiang Jiakang Electronics Piezoelectric Materials Sales (Million Units), Revenue (US$, Mn) and Average Price (US$/K Units) & (2020-2025)
Table 93. Zhejiang Jiakang Electronics Key News & Latest Developments
Table 94. TRS Technologies Company Summary
Table 95. TRS Technologies Piezoelectric Materials Product Offerings
Table 96. TRS Technologies Piezoelectric Materials Sales (Million Units), Revenue (US$, Mn) and Average Price (US$/K Units) & (2020-2025)
Table 97. TRS Technologies Key News & Latest Developments
Table 98. Piezoelectric Materials Capacity of Key Manufacturers in Global Market, 2023-2025 (Million Units)
Table 99. Global Piezoelectric Materials Capacity Market Share of Key Manufacturers, 2023-2025
Table 100. Global Piezoelectric Materials Production by Region, 2020-2025 (Million Units)
Table 101. Global Piezoelectric Materials Production by Region, 2026-2032 (Million Units)
Table 102. Piezoelectric Materials Market Opportunities & Trends in Global Market
Table 103. Piezoelectric Materials Market Drivers in Global Market
Table 104. Piezoelectric Materials Market Restraints in Global Market
Table 105. Piezoelectric Materials Raw Materials
Table 106. Piezoelectric Materials Raw Materials Suppliers in Global Market
Table 107. Typical Piezoelectric Materials Downstream
Table 108. Piezoelectric Materials Downstream Clients in Global Market
Table 109. Piezoelectric Materials Distributors and Sales Agents in Global Market

List of Figures
Figure 1. Piezoelectric Materials Product Picture
Figure 2. Piezoelectric Materials Segment by Type in 2024
Figure 3. Piezoelectric Materials Segment by Application in 2024
Figure 4. Global Piezoelectric Materials Market Overview: 2024
Figure 5. Key Caveats
Figure 6. Global Piezoelectric Materials Market Size: 2024 VS 2032 (US$, Mn)
Figure 7. Global Piezoelectric Materials Revenue: 2020-2032 (US$, Mn)
Figure 8. Piezoelectric Materials Sales in Global Market: 2020-2032 (Million Units)
Figure 9. The Top 3 and 5 Players Market Share by Piezoelectric Materials Revenue in 2024
Figure 10. Segment by Type – Global Piezoelectric Materials Revenue, (US$, Mn), 2024 & 2032
Figure 11. Segment by Type – Global Piezoelectric Materials Revenue Market Share, 2020-2032
Figure 12. Segment by Type – Global Piezoelectric Materials Sales Market Share, 2020-2032
Figure 13. Segment by Type – Global Piezoelectric Materials Price (US$/K Units), 2020-2032
Figure 14. Segment by Application – Global Piezoelectric Materials Revenue, (US$, Mn), 2024 & 2032
Figure 15. Segment by Application – Global Piezoelectric Materials Revenue Market Share, 2020-2032
Figure 16. Segment by Application – Global Piezoelectric Materials Sales Market Share, 2020-2032
Figure 17. Segment by Application -Global Piezoelectric Materials Price (US$/K Units), 2020-2032
Figure 18. By Region – Global Piezoelectric Materials Revenue, (US$, Mn), 2025 & 2032
Figure 19. By Region – Global Piezoelectric Materials Revenue Market Share, 2020 VS 2024 VS 2032
Figure 20. By Region – Global Piezoelectric Materials Revenue Market Share, 2020-2032
Figure 21. By Region – Global Piezoelectric Materials Sales Market Share, 2020-2032
Figure 22. By Country – North America Piezoelectric Materials Revenue Market Share, 2020-2032
Figure 23. By Country – North America Piezoelectric Materials Sales Market Share, 2020-2032
Figure 24. United States Piezoelectric Materials Revenue, (US$, Mn), 2020-2032
Figure 25. Canada Piezoelectric Materials Revenue, (US$, Mn), 2020-2032
Figure 26. Mexico Piezoelectric Materials Revenue, (US$, Mn), 2020-2032
Figure 27. By Country – Europe Piezoelectric Materials Revenue Market Share, 2020-2032
Figure 28. By Country – Europe Piezoelectric Materials Sales Market Share, 2020-2032
Figure 29. Germany Piezoelectric Materials Revenue, (US$, Mn), 2020-2032
Figure 30. France Piezoelectric Materials Revenue, (US$, Mn), 2020-2032
Figure 31. U.K. Piezoelectric Materials Revenue, (US$, Mn), 2020-2032
Figure 32. Italy Piezoelectric Materials Revenue, (US$, Mn), 2020-2032
Figure 33. Russia Piezoelectric Materials Revenue, (US$, Mn), 2020-2032
Figure 34. Nordic Countries Piezoelectric Materials Revenue, (US$, Mn), 2020-2032
Figure 35. Benelux Piezoelectric Materials Revenue, (US$, Mn), 2020-2032
Figure 36. By Region – Asia Piezoelectric Materials Revenue Market Share, 2020-2032
Figure 37. By Region – Asia Piezoelectric Materials Sales Market Share, 2020-2032
Figure 38. China Piezoelectric Materials Revenue, (US$, Mn), 2020-2032
Figure 39. Japan Piezoelectric Materials Revenue, (US$, Mn), 2020-2032
Figure 40. South Korea Piezoelectric Materials Revenue, (US$, Mn), 2020-2032
Figure 41. Southeast Asia Piezoelectric Materials Revenue, (US$, Mn), 2020-2032
Figure 42. India Piezoelectric Materials Revenue, (US$, Mn), 2020-2032
Figure 43. By Country – South America Piezoelectric Materials Revenue Market Share, 2020-2032
Figure 44. By Country – South America Piezoelectric Materials Sales, Market Share, 2020-2032
Figure 45. Brazil Piezoelectric Materials Revenue, (US$, Mn), 2020-2032
Figure 46. Argentina Piezoelectric Materials Revenue, (US$, Mn), 2020-2032
Figure 47. By Country – Middle East & Africa Piezoelectric Materials Revenue, Market Share, 2020-2032
Figure 48. By Country – Middle East & Africa Piezoelectric Materials Sales, Market Share, 2020-2032
Figure 49. Turkey Piezoelectric Materials Revenue, (US$, Mn), 2020-2032
Figure 50. Israel Piezoelectric Materials Revenue, (US$, Mn), 2020-2032
Figure 51. Saudi Arabia Piezoelectric Materials Revenue, (US$, Mn), 2020-2032
Figure 52. UAE Piezoelectric Materials Revenue, (US$, Mn), 2020-2032
Figure 53. Global Piezoelectric Materials Production Capacity (Million Units), 2020-2032
Figure 54. The Percentage of Production Piezoelectric Materials by Region, 2024 VS 2032
Figure 55. Piezoelectric Materials Industry Value Chain
Figure 56. Marketing Channels