SEMICONDUCTOR INSIGHT
MARKET RESEARCH REPORT

Optical Level Switch Market

2026 to 2034
MARKET INTELLIGENCE
ACROSS KEY REGIONS
2026 EDITION
SENSORS Semiconductor Market Research

Optical Level Switch Market

Size, Trends, Business Strategies 2026-2034

◷
UPDATED 03 November 2026
▤
REPORT LENGTH Detailed Report
▣
REPORT CODE 1ac374c87292
▯
FORMATS PDF

Optical level switch market reached USD 2,915 million in 2025 and is projected to reach USD 6,597 million by 2034, expanding at a CAGR of 9.5% during 2025–2034. Asia-Pacific accounts for an estimated ~39% of 2025 revenue. Optical liquid point-level switches detect the presence of fluid at a fixed installation height without a float or other moving actuator.

Get the sample PDF with study scope, segmentation and methodology details.

Key Statistics

2025 Market Size
USD 2,915 million
2034 Projected Size
USD 6,597 million
CAGR (2025–2034)
9.5%
Largest Market in 2025
Asia-Pacific (~39%)

Key Takeaways

  • Market outlook: The optical level switch market was valued at USD 2,915 million in 2025 and is projected to reach USD 6,597 million in 2034, representing a 9.5% CAGR over the 2025–2034 interval; the 2026 estimate is USD 3,192 million. The values extend the published 2023 and 2030 monetary anchors at their implied annual growth rate.
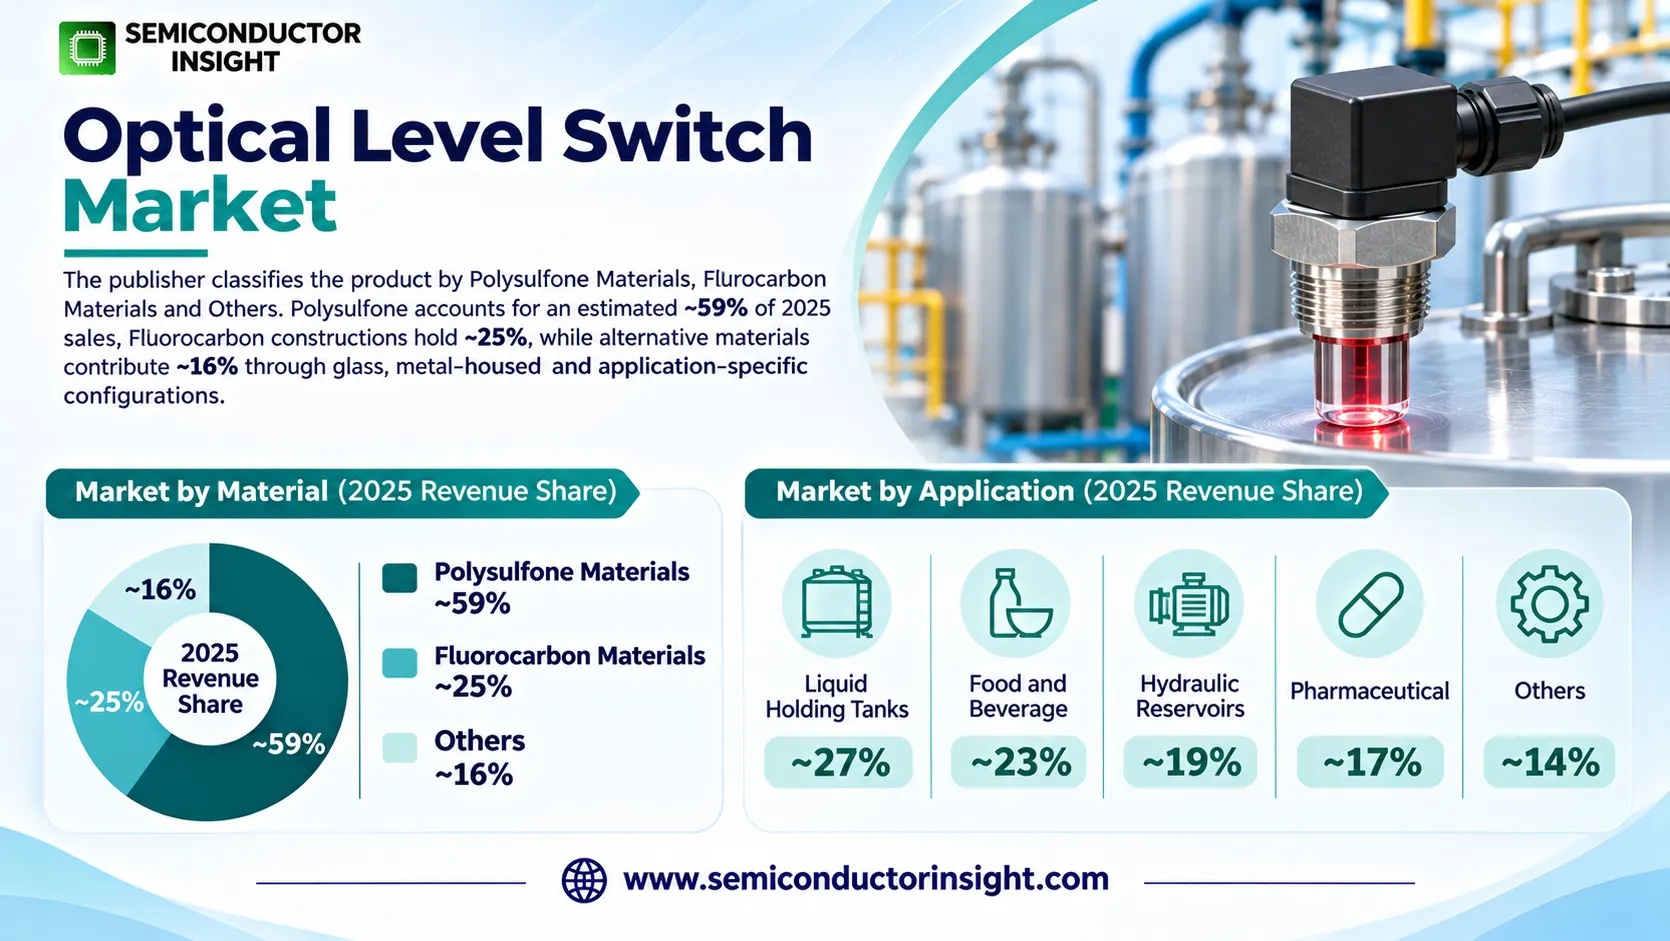
  • Polysulfone materials account for an estimated ~59% of 2025 product revenue, ahead of fluorocarbon-based variants at ~25% and other constructions at ~16%; this distribution reflects the installed breadth of affordable plastic optical tips rather than a manufacturer-reported market survey.
  • Liquid holding tanks represent the largest modeled application at ~27% of 2025 revenue, with food and beverage at ~23%, hydraulic reservoirs at ~19%, pharmaceutical equipment at ~17%, and other uses at ~14%; alarm reliability and low mechanical wear are decisive buying criteria.
  • Asia-Pacific leads regional demand with an estimated ~39% of 2025 revenue, followed by North America at ~26%, Europe at ~23%, South America at ~7%, and the Middle East and Africa at ~5%; these allocations are analytical estimates rather than measured national sales totals.
  • Technology differentiation depends on optical-prism wetting response, polymer compatibility, process fittings, protective housings and electronic output. Devices with NPN or PNP signals compete against vibrating-fork, ultrasonic and radar alternatives, which are excluded from the optical-switch revenue boundary.

Optical Level Switch Market Overview

Optical level switch market reached USD 2,915 million in 2025 and is projected to reach USD 6,597 million by 2034, expanding at a CAGR of 9.5% during 2025–2034. Asia-Pacific accounts for an estimated ~39% of 2025 revenue. Optical liquid point-level switches detect the presence of fluid at a fixed installation height without a float or other moving actuator.

Base year: 2025 · Estimated year: 2026 · Forecast period: 2026–2034 · Historical reference: 2023 · Values in USD million

An optical level switch normally places an infrared emitter and photodetector behind a transparent prism or molded optical tip. With the tip dry, internally reflected light returns to the receiver; immersion changes the refractive boundary and the received signal falls, prompting a transistor output to change state. This point-detection mechanism is distinct from continuous liquid-level measurement because it answers whether the fluid has reached a defined height. Compact packaging and the absence of mechanical floats suit vessels that experience vibration, restricted mounting space or repeated cleaning.

The revenue boundary includes finished infrared liquid point switches, OEM optical switch elements supplied for integration into level-control assemblies, and the appropriate process-ready housings and electronics described by suppliers. The same optical element must not be counted again when its completed assembly is sold. Ultrasonic detectors, radar instruments, conductive probes, capacitive switches and vibrating-fork devices are competing technologies rather than constituent optical revenue. Fiber-optic communications components are likewise outside the scope despite sharing optical terminology. This distinction matters when interpreting diversified instrumentation suppliers whose group sales cover many measurement principles.

The underlying published market anchors are USD 2,431 million for 2023 and USD 4,588.64 million for 2030, an implied annual increase of about nine and a half percent. Extending that constant rate to the standardized 2025–2034 window produces the reported forecast trajectory, rather than independent observed sales for each extrapolated year. The market encompasses a mixture of inexpensive molded devices, industrial stainless assemblies, specialty glass tips and certified hazardous-area designs. Higher average selling prices for protected units can shift revenue shares even when plastic-bodied models dominate shipment volumes.

The purchase decision starts with the liquid rather than the switch. Transparent water, hydraulic oil, viscous food ingredients and chemically aggressive media interact differently with optical surfaces; droplets, foam and coating films can alter the return signal. Buyers therefore examine wetting behavior, pressure, temperature, washdown exposure, thread compatibility and the required fail-safe output before choosing a model. The electrical interface also matters: a controller expecting an NPN open collector cannot necessarily accept a PNP replacement without wiring or logic changes. These engineering constraints create qualification costs but also sustain demand for proven product families.

Growth is supported by automated filling, overfill protection, small process vessels and equipment designs that replace moving floats with compact solid-state sensors. The strongest opportunities arise where an optical detector can be built into an OEM machine and tested as part of the finished product, reducing later field maintenance. Conversely, heavily fouling liquids and processes requiring continuous level profiles often favor different sensing principles. The commercial contest is therefore not a universal replacement of older switches; it is a series of application-specific selections in which installation geometry, cleaning intervals and lifecycle service expense determine the winning technology.

Segment Analysis: By Type

The publisher classifies the product by Polysulfone Materials, Flurocarbon Materials and Others. Polysulfone accounts for an estimated ~59% of 2025 sales because molded optical tips can be incorporated economically into numerous OEM assemblies. Fluorocarbon constructions hold ~25%, supported by selected chemical-handling duties, while alternative materials contribute ~16% through glass, metal-housed and application-specific configurations. These are modeled revenue allocations, not audited manufacturer disclosures.

Material class Engineering role Commercial positioning
Polysulfone Materials Molded polysulfone tips provide a compact optical interface for ordinary liquid detection, with practical use in water handling, general equipment reservoirs and standardized OEM tank controls. Chemical compatibility must be verified for the exact liquid, cleaning agent and exposure temperature rather than inferred from the generic polymer label. Estimated ~59% share in 2025. The largest revenue pool is driven by high-volume point alarms and equipment-integrated sensors, where low component count, repeatable molding and a familiar installation envelope can matter more than maximum temperature or hazardous-area certification.
Flurocarbon Materials The published material label covers fluorocarbon-oriented options intended for selected media that require improved chemical resistance. Actual tip, seal and housing composition remains product-specific; not every fluoropolymer grade is suitable for every solvent, and compatibility tests are required before choosing a wetted construction. Estimated ~25% share in 2025. This class addresses higher-value process applications where exposure limits rule out standard plastics, and buyers may accept a higher unit price in exchange for fewer replacement visits and a more stable detection point.
Others Alternative assemblies use glass optical surfaces, stainless process bodies, other engineering plastics or specialized protective constructions. A metal housing does not automatically imply a metal optical tip: the light path still needs a transparent interface with the liquid, and seals often govern the service limit. Estimated ~16% share in 2025. Specialty units compete on high-temperature operation, marine qualification, chemical exposure and constrained mounting geometry, with demand less dependent on mass-market plastic component pricing.

Polysulfone tip selection and OEM economics

Polysulfone is attractive when the switch must be repeated across thousands of identical tanks or appliances. Tooling and automated test fixtures can lower cost per qualified part, while the optical principle avoids mechanical hinge wear. The commercial risk is a material mismatch: detergents, oils or concentrated cleaning chemicals can change surface behavior or degrade a seal over time. Suppliers therefore win repeat orders by publishing media guidance and maintaining consistent optical thresholds, not simply by offering the cheapest molded tip.

DwyerOmega markets compact LVE-950 optical switches in small process connections with polysulfone or brass configurations and specified switching repeatability. That product family illustrates the balance between packaging cost and installation constraints in miniature reservoirs. An OEM can mount a compact detector at a precise alarm point, but it must still verify electrical output polarity, mechanical torque, cable routing and the consequence of a false wet indication. Those qualification steps can make a proven design more valuable than a nominally interchangeable alternative.

Chemical-resistant and specialist optical interfaces

Fluorocarbon and other specialty materials address applications where aggressive fluids or cleaning cycles shorten the useful life of standard tips. Glass interfaces can be useful in demanding chemical service, although impact resistance, thermal shock and seal selection require separate attention. Suppliers with several wetted-material options can therefore serve a broader chemical portfolio without redesigning the entire control system. The customer typically evaluates the complete sensor stack, including adhesive, O-ring, connector and protective enclosure, because the weakest wetted component sets the practical service envelope.

Segment Analysis: By Application

Application demand is distributed across process vessels and equipment reservoirs rather than one homogeneous factory market. Liquid Holding Tanks lead with an estimated ~27% of 2025 revenue; Food and Beverage represents ~23%, Hydraulic Reservoirs ~19%, Pharmaceutical ~17% and Others ~14%. Each allocation reflects a different combination of tank count, alarm criticality, service temperature and purchase-channel structure. The figures are modeled 2025 shares.

Application Demand characteristics
Liquid Holding Tanks Estimated ~27% of 2025 revenue. Fixed high-level and low-level points provide overflow alarms and pump interlocks for storage and transfer vessels. Users value repeatable switching and straightforward wiring, but must consider liquid film on the prism, mounting angle and the consequences of deposits accumulating between cleaning intervals.
Food and Beverage Estimated ~23% of 2025 revenue. Beverage preparation, ingredient dispensing and washdown-exposed equipment use compact detectors where mechanical floats are awkward. Hygienic construction and the compatibility of every wetted material with cleaning agents matter as much as switching speed, particularly when process changeovers are frequent.
Hydraulic Reservoirs Estimated ~19% of 2025 revenue. Hydraulic power packs and mobile equipment need low-fluid warnings despite vibration, heat and compact reservoirs. Oil viscosity, foaming and aeration complicate optical detection, so qualification involves actual operating fluid and the machine’s duty cycle rather than water-only bench testing.
Pharmaceutical Estimated ~17% of 2025 revenue. Laboratory and medical-fluid equipment favor small point sensors integrated into disposable or cleanable systems. Material traceability, repeatability and validated cleaning procedures increase the engineering burden, while miniaturized assemblies can command higher prices than commodity tank alarms.
Others Estimated ~14% of 2025 revenue. Marine auxiliary systems, chemical dosing equipment, cooling circuits and specialist machinery create a fragmented residual category. A small vessel may require only one switch, yet a harsh duty can justify a premium enclosure, certified output or glass tip that raises revenue relative to unit count.

Liquid holding tanks are a broad application rather than a single end market: a water-treatment buffer vessel, an industrial coolant tank and a machine sump may all use point detection, but their contaminants and service expectations differ. A two-position installation can combine a low-level pump-protection alarm with a high-level overfill warning, effectively creating demand for more than one detector per vessel. The commercial advantage belongs to suppliers that document mounting position, residual liquid behavior and compatible process fittings for common equipment layouts.

In regulated fluid handling, the value of a switch is often its contribution to a validated equipment assembly. Pharmaceutical and food customers may require records of material selection, cleaning chemistry and maintenance intervals even when the sensing element itself is inexpensive. By contrast, an industrial hydraulic buyer may prioritize vibration endurance and replacement availability. These different purchase criteria explain why one product family rarely dominates every application, and why estimated application shares should not be confused with publicly disclosed company revenue splits.
Regional Analysis

Asia-Pacific leads the optical level switch market with an estimated ~39% of 2025 revenue, followed by North America (~26%), Europe (~23%), South America (~7%) and the Middle East and Africa (~5%). The North American allocation is informed by the publisher’s 2023 regional value, while other regional shares reflect the distribution of liquid-handling equipment production and installed industrial systems. The regional mix is an analytical allocation, not a measured customs or company-sales series.

Where are optical point-level switches most widely used and why?

A constant-rate global revenue bridge, expressed in USD millions, places 2025 at 2,915 with an index of 100.0 and 2026 at 3,192 with an index of 109.5. The following years move to 2027 at 3,495 and index 119.9; 2028 at 3,827 and index 131.3; 2029 at 4,191 and index 143.8; 2030 at 4,589 and index 157.4; 2031 at 5,025 and index 172.4; 2032 at 5,502 and index 188.8; 2033 at 6,025 and index 206.7; and 2034 at 6,597 and index 226.3. This is an extrapolated annual path rather than a sequence of published yearly observations.

For the 2025 modeled regional split, Asia-Pacific has 39% of sales, equivalent to USD 1,136.85 million, and North America has 26%, or USD 757.90 million. Europe contributes 23%, or USD 670.45 million; South America 7%, or USD 204.05 million; and Middle East and Africa 5%, or USD 145.75 million. Applying the same starting mix to the 2026 estimate gives USD 1,244.88 million, USD 829.92 million, USD 734.16 million, USD 223.44 million and USD 159.60 million, respectively. These allocations illustrate the modeled starting position; subsequent regional growth may diverge.

Material segmentation converts the 2025 modeled 59%, 25% and 16% shares into USD 1,719.85 million for polysulfone, USD 728.75 million for fluorocarbon and USD 466.40 million for other constructions. At the 2026 market estimate, those same shares imply USD 1,883.28 million, USD 798.00 million and USD 510.72 million. Application allocations for 2025 are USD 670.45 million in food and beverage, USD 495.55 million in pharmaceutical, USD 787.05 million in liquid holding tanks, USD 553.85 million in hydraulic reservoirs and USD 408.10 million in other uses. These are share-derived illustrations, not additional independent market anchors.

Industrial demand follows the location of tanks, pumps, filling machines and process equipment rather than the geography of optical-component fabrication alone. A detector may be engineered in Germany, molded in Asia and installed in a North American fluid-handling machine; assigning revenue to a region therefore depends on the destination market, not just the supplier address. Regional shares in this study refer to estimated sales to end-use markets in 2025. Growth-rate assumptions reflect equipment replacement cycles, new machine installations and the ability of optical switches to displace mechanical floats in suitable liquids.

The five regional growth trajectories differ because installed equipment age and industrial capital spending differ. Asia-Pacific is modeled near ~10.7% CAGR through 2034, North America near ~8.8%, Europe near ~8.4%, South America near ~9.8%, and Middle East and Africa near ~10.1%. These regional rates are indicative, not independently published forecasts, and should not be read as a precise reconciliation of national market accounts. Their purpose is to distinguish likely growth intensity while preserving the globally anchored forecast and the modeled 2025 revenue allocation.

Region Position Growth outlook Demand profile What decides supplier selection
Asia-Pacific Largest (~39% share) ~10.7% CAGR OEM assembly, tank equipment and factory automation Tip material compatibility, price stability and repeatable electrical outputs
North America Second (~26% share) ~8.8% CAGR Installed process systems and high-value machine retrofits Documented reliability, local distribution and application support
Europe Third (~23% share) ~8.4% CAGR Industrial hydraulics, engineered machinery and marine equipment Certification, chemical fit and mechanical integration
South America Emerging (~7% share) ~9.8% CAGR Water handling, food processing and industrial tank upgrades Replacement access, currency exposure and field maintenance
Middle East & Africa Developing (~5% share) ~10.1% CAGR Utilities, chemical dosing and remote industrial sites Heat tolerance, installation protection and project procurement

Asia-Pacific LARGEST · ~39% SHARE

Why does Asia-Pacific lead optical level-switch demand?

Asia-Pacific is modeled at ~39% of 2025 revenue and ~10.7% CAGR through 2034. The region combines a large base of pumps, tanks and packaged industrial machinery with manufacturers capable of incorporating small infrared detectors into repeatable OEM designs. Price competition is intense, but local equipment integration can offset the cost of a stand-alone field instrument. Demand is not uniform: water handling, factory automation and specialty process machinery impose different requirements on optical tips and wiring.

Market positionLargest (~39% share)
Growth outlook~10.7% CAGR
Demand profileOEM equipment and process tanks
Market access gateLiquid compatibility and cost
Country Position in region What drives demand
China Largest national base China has an extensive ecosystem for fluid-handling equipment, electronics assembly and process automation. A compact optical switch can be installed at the factory rather than purchased separately by the end user, making design qualification and dependable component supply commercially important. Price competition favors standardized plastics, while chemical processing creates opportunities for protected tips. The modeled 2025 regional lead does not establish a measured Chinese market value or a supplier-specific revenue share.
Japan Premium engineering Japanese equipment makers often emphasize stable component specifications, long replacement cycles and compact machine layouts. Optical detectors can suit laboratory instruments, beverage equipment and precision fluid dispensers where a moving float would consume valuable space. The purchasing decision still depends on the media and cleaning regime, particularly for viscous fluids. Local integration can create demand for high-repeatability assemblies even when the total number of switches is smaller than in broad commodity tank applications.
India Expanding equipment base Indian food processing, water-treatment and machine-building applications offer a growing installed base for point-level detection. The strongest opportunities are repeatable machine designs that require a high or low liquid alarm without complex commissioning. Buyers frequently weigh imported instrument availability against local service support and cable replacement costs. For chemically aggressive media, the correct wetted tip and seal selection can outweigh the price advantage of a basic optical module.

Market instances

  • Industrial equipment integration An infrared switch may be specified at the design stage of a packaged dosing skid, so one qualified part number can be used across many units. This creates recurring OEM demand that is less visible than large plant instrumentation tenders. The opportunity is strongest when the manufacturer controls installation geometry and cleaning instructions, reducing the risk of droplet retention at the prism and supporting consistent field performance.
  • Material choice as a competitive lever Asian manufacturers can source molded plastic tips, compact electronics and cable assemblies through established component channels, improving cost and lead time. That advantage is conditional on the application: a high-temperature or chemically aggressive fluid can require glass or specialist polymers. Suppliers that offer multiple wetted-material configurations can address both value-sensitive machinery and more demanding process installations without changing the basic switching architecture.
In the full report: country-level unit demand, application mix, material selection and supplier-channel analysis for China, Japan, India and the rest of Asia-Pacific.

North America SECOND · ~26% SHARE

What drives replacement and OEM orders in North America?

North America accounts for an estimated ~26% of 2025 optical level-switch revenue, with ~8.8% modeled CAGR to 2034. The publisher reported USD 633.45 million for the region in 2023, equal to roughly 26.1% of its global headline value that year. This historical relationship informs the modeled 2025 allocation but does not verify a new regional total. Buyers emphasize documented device behavior, local technical assistance and compatibility with established industrial control systems.

Market positionSecond (~26% share)
Growth outlook~8.8% CAGR
Demand profileIndustrial retrofits and OEMs
Market access gateDocumentation and availability
Country Position in region What drives demand
United States Largest buyer US buyers span chemical processing, industrial machinery, medical-fluid equipment and water-treatment applications. Retrofitting a mechanical float with an optical detector can reduce moving-part maintenance, but the conversion requires checking output logic and how the liquid wets the tip. Domestic distribution and clear installation instructions reduce downtime during replacements. Premium demand concentrates in devices whose temperature, pressure and material limits are documented for the actual process, not merely stated for water.
Canada Established installed base Canadian industrial plants and packaged equipment suppliers use level alarms in hydraulic systems, utilities and process tanks. Cold environments and seasonal temperature variation can influence enclosure and cable selection even when the sensing tip remains inside a protected vessel. The supplier’s ability to provide the same form factor over several years matters for remote maintenance teams. A low purchase price can be outweighed by travel and shutdown costs when local replacement stock is scarce.

Market instances

  • Compact switching in packaged equipment KOBOLD USA lists the OPT family with NPN or PNP open-collector output options and several process fittings, illustrating the need to match an instrument to the controller and mounting boss. In North American equipment, an apparently small electrical difference can require a wiring change or additional input module. A qualified replacement therefore has value beyond its component cost, especially where service teams maintain many identical machines.
  • Replacement versus redesign decisions Industrial operators often retain a working switch design rather than reopen the entire qualification process. That preference favors vendors able to supply compatible replacement units and accurate material data. Where a float has failed repeatedly, however, a compact infrared detector can justify redesign if the liquid is sufficiently clean and the optical surface stays wetted or dry in a predictable manner. The economics depend on avoided maintenance, not only purchase price.
In the full report: end-use demand, channel inventory, device qualification and aftermarket opportunities in the United States and Canada.

Europe THIRD · ~23% SHARE

How do European equipment requirements shape demand?

Europe is assigned an estimated ~23% of 2025 sales and ~8.4% CAGR through 2034. The region’s strength lies in engineered machinery, hydraulic systems and process equipment that require carefully documented sensor performance. Buyers may prioritize long product availability and tested material combinations over the lowest upfront cost. Marine and industrial installations also demand mechanical resilience, making protected optical assemblies attractive even though standard plastic devices serve much of the ordinary tank market.

Market positionThird (~23% share)
Growth outlook~8.4% CAGR
Demand profileEngineered equipment and marine
Market access gateCertification and material fit
Country Position in region What drives demand
Germany Engineering hub German machinery and process-system builders specify optical switches for precise point alarms where a compact housing and predictable transistor output simplify control. Hydraulic reservoirs and machine tools impose vibration, oil compatibility and mounting constraints. Suppliers compete on engineering documentation, validated ratings and continuity of product families across equipment generations. A manufacturer that offers multiple process connections can reduce redesign effort when the same controller platform is sold with several tank sizes.
United Kingdom Process and marine demand UK applications include fluid handling, laboratory systems and marine auxiliary equipment. High-value installations may require a stainless process body and evidence that the device tolerates vibration or elevated temperature. The WIKA OLS-5200 product family illustrates this protected end of the market, although it should not be taken as a proxy for all national sales. Distributor support and the availability of compatible spares influence purchasing decisions for remote installations and long-lived machinery.

Market instances

  • Marine qualification raises unit value WIKA describes its OLS-5200 as a vibration-resistant optoelectronic switch for shipbuilding and hydraulic power packs, with operation up to 130 degrees Celsius and 25 bar and DNV GL approval. Those specifications demonstrate why a specialist assembly can command a different price from a small plastic tank detector. Qualification cost and process fittings matter in marine applications, where a failure may be expensive to diagnose and access.
  • Process-machine design is specification-led European original equipment manufacturers often standardize electrical interfaces and mounting hardware across equipment families. An optical switch must therefore fit both the control input and the mechanical envelope while remaining compatible with oils, aqueous media or cleaning agents. This favors suppliers offering documented configuration options and consistent lead times. It also limits substitution: a nominally similar sensor may require a new validation cycle if the optical threshold or tip material changes.
In the full report: machine-tool, marine, hydraulic and process applications by major European country, including supplier qualification and aftermarket structure.

South America EMERGING · ~7% SHARE

Where are South American installations gaining traction?

South America represents an estimated ~7% of 2025 revenue and a modeled ~9.8% CAGR through 2034. Food processing, water infrastructure and general industrial tank upgrades provide the most relevant demand channels. Customers may prefer straightforward point alarms that can be maintained with limited specialist instrumentation support. Import costs and distributor inventories can determine which device family is selected, while the suitability of an optical prism for the actual liquid remains the central technical constraint.

Market positionEmerging (~7% share)
Growth outlook~9.8% CAGR
Demand profileWater and food processing
Market access gateLocal spares and installation
Country Position in region What drives demand
Brazil Largest regional market Brazilian process plants and packaged water-handling equipment create demand for high- and low-level alarms. A simple optical detector can reduce moving mechanical components in clean-fluid applications, but solids, foam and deposits can alter the response and require periodic inspection. Local distributor stocks and service guidance are important because an imported replacement may face unpredictable lead times. Equipment manufacturers can gain an advantage by standardizing a proven sensor across multiple tank designs.
Mexico Cross-border equipment base Mexico is relevant to the wider Latin American manufacturing ecosystem through packaged machinery and industrial fluid systems. A switch chosen by an equipment maker may be purchased with the finished machine rather than directly by the end user. This changes the sales channel and places weight on factory-level testing and stable part numbers. Where food and beverage production uses repeated cleaning cycles, installers must verify tip and seal compatibility before assuming a standard plastic model will perform reliably.

Market instances

  • Distribution affects technical choice A plant seeking to replace a failed level alarm may choose the device with documented wiring compatibility and available local stock rather than a more advanced alternative requiring a new control input. This makes channel coverage and clear product identification important competitive tools. Suppliers that train installers on correct mounting orientation can also reduce false alarms caused by retained droplets, an issue that matters in intermittently filled vessels.
  • Water-handling modernization offers repeatable demand Storage and transfer tanks need straightforward overfill and pump-protection signals. An optical point detector can fit this requirement where the liquid remains sufficiently clean, the prism can be inspected and a suitable controller input is available. For muddy or heavily coated media, an ultrasonic or other alternative may be preferable. The opportunity is therefore tied to correct application screening rather than indiscriminate replacement of every legacy float.
In the full report: water, food and general industry equipment opportunities in Brazil and other Latin American markets, including landed-cost and channel analysis.

Middle East & Africa DEVELOPING · ~5% SHARE

What determines adoption in Middle East and African projects?

The Middle East and Africa account for an estimated ~5% of 2025 market revenue and a modeled ~10.1% CAGR to 2034. Demand is linked to chemical dosing, utility systems, packaged water treatment and equipment installed at remote industrial sites. The purchasing challenge is to select a sensor whose optical tip, housing and cable tolerate the liquid and ambient conditions. Project procurement can be episodic, while dependable maintenance support is particularly valuable where service access is difficult.

Market positionDeveloping (~5% share)
Growth outlook~10.1% CAGR
Demand profileUtilities and dosing skids
Market access gateHeat and service access
Country Position in region What drives demand
Saudi Arabia Project-driven buyer Saudi Arabian utility and industrial projects use tank-level alarms in dosing, water handling and auxiliary process systems. High ambient temperature and remote service locations increase the importance of enclosure rating, cable durability and clear fault behavior. An optical detector is most suitable when the fluid does not coat the prism excessively and the installation permits inspection. Procurement decisions often favor a documented, serviceable configuration over the lowest-cost component alone.
United Arab Emirates Packaged equipment market UAE applications include building utilities, industrial skids and liquid-handling machinery. Compact switches can be integrated into standardized systems, reducing commissioning complexity when the liquid and process connection are known in advance. Suppliers must still verify performance with cleaning chemicals and the selected output circuit. Distributor stock and field replacement procedures are important because an alarm failure can interrupt a larger packaged system even when the sensor itself is inexpensive.
South Africa Industrial maintenance base South African mining-support facilities, water systems and general industry operate fluid reservoirs that require dependable low-level and overflow protection. An infrared switch may be attractive in clean-liquid duties, but slurry, deposits and opaque coating layers can undermine optical reliability. Installation training and correct technology selection therefore matter as much as component price. Customers may prefer a robust alternative for dirty media, while optical models serve compact clean-fluid equipment.

Market instances

  • Chemical dosing requires compatibility screening A dosing skid may carry acids, alkalis or treatment chemicals that interact differently with polysulfone, seals and optical windows. Selecting a switch from a generic liquid-level catalog without checking the exact medium can create premature failures. Vendors that document compatible tip materials and provide accessible process connections are better placed to win repeat equipment orders, particularly when the skid design is replicated across several project sites.
  • Remote-site maintenance shapes procurement An optical detector installed at a distant utility facility must remain understandable to technicians who may not have specialist diagnostic equipment. Simple transistor outputs and clear installation instructions can be valuable, but the device must also tolerate dust, heat and occasional cleaning. A switch with a more robust housing may lower lifetime service expense despite a higher initial purchase price, especially where a site visit is costly.
In the full report: country-level utility and industrial equipment demand, project procurement and device service requirements across Gulf states and Africa.

Key Optical Level Switch Manufacturers and Competitive Landscape

Competition is segmented between specialist infrared switch manufacturers, broad instrumentation distributors and suppliers of alternative point-level technologies. Product availability can be confirmed for SST Sensing, KOBOLD, DwyerOmega and WIKA, but their corporate sales figures cannot be equated with optical switch revenue. The market rewards application guidance, tip-material options and repeatable switching more than an unsupported claim of overall supplier share.

SST Sensing addresses several tiers of demand through miniature OEM components, industrial optical assemblies and specialist protected devices. Its Optomax Basic range is relevant where equipment makers want to integrate the optical sensing element into their own controls; more robust product families serve exposed or demanding installations. The breadth of options gives buyers a way to retain the same sensing principle while adjusting housing and materials. It does not establish a disclosed share of global optical-switch revenue, because product-level turnover is not disclosed in the referenced materials.

KOBOLD markets the OPT optical switch for clear and translucent liquids, with open-collector outputs and alternative process connections. Its compact optical arrangement has no moving parts and is designed for low switching hysteresis. These properties make it a credible competitor in tank alarms and packaged equipment, but the device still requires correct mounting orientation and suitable media. Supplier competition thus extends beyond datasheet headline ratings to practical installation support, stock availability and the ability to reproduce a qualified configuration over many years.

DwyerOmega offers miniature optical switches alongside a broad instrumentation portfolio, creating distribution access to laboratories, machinery builders and plant maintenance teams. WIKA differentiates through industrial and marine-oriented optoelectronic assemblies with protected housings and documented operating envelopes. These companies serve overlapping but not identical customer needs. Their general instrumentation revenues are not used to infer optical-switch market concentration, and manufacturers of vibrating-fork or radar devices are treated as adjacent competitors rather than automatically counted as optical suppliers.

Tier structure

Tier Companies Basis of competition
Specialist optical SST Sensing, KOBOLD Infrared prism expertise, configurable tips, OEM design support and switching electronics
Industrial instrument portfolios WIKA, DwyerOmega Application-specific process fittings, documented ratings, regional channels and replacement support
Alternative technology providers Emerson, ifm, TE Connectivity Competing vibrating-fork, radar, ultrasonic or digital level technologies; excluded from optical revenue

Key companies profiled

  • SST Sensing (optical liquid point switches)
  • KOBOLD (OPT optical switch)
  • DwyerOmega / Omega Engineering (LVE optical range)
  • WIKA (OLS optoelectronic range)

Optical Level Switch Production and OEM Integration Analysis

Optical switch manufacturing combines transparent tip molding or glass processing, infrared emitter and detector assembly, compact printed-circuit electronics, sealing and functional wet/dry calibration. Production economics depend on the repeatability of the optical interface and the ability to test completed units without introducing contamination. OEM channels favor small modules, while process buyers usually prefer fully housed, connector-ready instruments.

The upstream bill of materials includes an infrared LED, light-sensitive receiver, optical prism, driver or comparator circuitry, process-compatible tip, seals, cable and protective enclosure. A change in prism geometry can alter the dry-state reflection level and therefore the switching threshold, so optical tooling consistency matters. Electronic assemblies must also be screened for temperature drift and electrical noise. For a commodity sensor, test time and scrap can determine profitability as much as the price of the semiconductor components.

Integration choices shape where value is recognized. An OEM may purchase a basic optical element and incorporate it into a custom housing, while a plant operator buys a completed threaded switch with cable and output protection. Counting both transactions as separate finished optical-switch revenue would exaggerate the market. The commercial boundary instead follows the supplied product at its relevant integration level. Suppliers that provide reference circuits and reliable part-number continuity can gain repeat design wins even without a large direct field-sales organization.

Qualification is particularly demanding when the wetted tip sees repeated cleaning, hydraulic oil or aggressive process fluids. Assemblers must select seals and plastics for the actual medium, validate switching after exposure and ensure that mounting instructions do not encourage liquid retention on the optical face. For protected applications, enclosure integrity, temperature limits and relevant approvals add cost. These production requirements explain why premium instruments can coexist with low-cost molded modules within the same market without being directly interchangeable.

Optical Level Switch Market Dynamics: Drivers, Restraints and Opportunities

The modeled annual expansion reflects a positive contribution from OEM automation, overflow protection and specialized fluid handling, offset by competing sensor principles and liquid-dependent reliability limits. The impact tables express directional contributions to the forecast rather than directly measured causal coefficients. Their net is aligned to the published headline growth trajectory, and each factor is considered over early, middle and late forecast windows.

MARKET DRIVERS

Drivers Impact Analysis*

Market Drivers Impact Rank CAGR Contribution (%) 2026–2028 2029–2031 2032–2034
OEM automation integration High +3.60% High High Medium
Process safety and overflow prevention High +3.10% High High High
Food, beverage and medical liquid handling Medium-High +2.60% Medium High High
Chemical-resistant optical materials Medium +2.10% Medium Medium High
Others (miniaturization, electrical interfacing and retrofit convenience) Low +1.50% Low Medium Medium

OEM automation creates repeat design wins

Manufacturers of dosing equipment, compact tanks and automated filling machines increasingly integrate fixed-point alarms into their standard control assemblies. Once an infrared sensor has passed mechanical, electrical and liquid-compatibility tests, it can remain in the bill of materials for multiple product generations. This repeatability supports volume demand even when individual components are inexpensive. The estimated +3.60 percentage-point growth contribution reflects the breadth of OEM applications rather than a published econometric measurement.

Overfill prevention improves operating resilience

A high-level alarm can interrupt a transfer pump before a vessel overflows, while a low-level switch can prevent a pump from running dry. Optical detection is useful when the fluid is compatible with the prism and the installation can keep the sensing face clean. Because a small sensor can protect more expensive equipment, procurement decisions often consider avoided shutdowns and service visits. The +3.10-point directional contribution recognizes this protective function across many types of industrial tank.

Fluid handling expands into smaller equipment

Food preparation, medical-fluid handling and laboratory systems use vessels that are too compact for some conventional mechanical arrangements. Infrared switches can fit these spaces without a float arm, enabling repeatable point detection within a constrained assembly. The equipment manufacturer must still document wetting response and cleaning conditions, particularly where hygiene or contamination control is important. This application expansion contributes an estimated +2.60 points to the modeled market growth profile.

Specialty materials extend the usable process range

Not all liquids behave acceptably with a standard plastic prism, so alternative tip materials and robust seals widen the set of addressable applications. Specialist products can handle higher temperature, pressure or chemical exposure when their complete construction is rated accordingly. The result is both substitution into previously unsuitable duties and a higher average selling price for selected installations. The +2.10-point modeled contribution captures this mix improvement without claiming that every fluorocarbon formulation is universally resistant.

Miniature electronics simplify control-system connections

Small emitters, receivers and compact output circuits let designers place level alarms in tight machine envelopes. NPN and PNP options make it possible to align the switch with common industrial input arrangements, although polarity must be checked rather than assumed. Lower component count can improve reliability where mechanical floats are vulnerable to wear. These incremental design advantages are grouped into the +1.50-point residual contribution, which also includes practical retrofit convenience in clean-fluid applications.

MARKET RESTRAINTS

Restraints Impact Analysis*

Market Restraints Impact Rank CAGR Contribution (%) 2026–2028 2029–2031 2032–2034
Alternative sensing technologies High -1.50% High High High
Fouling, droplets and media compatibility Medium -1.10% High Medium Medium
Others (qualification and installation cost) Low -0.80% Medium Medium Low
*CAGR contribution shows the percentage points each factor adds to or removes from the forecast CAGR for 2026–2034; driver contributions less restraint contributions equal the market CAGR. Period columns rate the strength of each factor in that window.

Other measurement principles win difficult duties

Vibrating-fork switches, ultrasonic detectors and radar instruments can outperform a prism-based infrared switch when the liquid is opaque, heavily fouling or unsuitable for a wetted optical interface. They are not optical-switch sales, but their presence limits the share of industrial level applications available to the technology. The modeled -1.50-point contribution reflects technology substitution and the risk that buyers standardize on one alternative across several tank designs.

Residues can disrupt the wet/dry boundary

An optical prism relies on a predictable difference between its dry and immersed light paths. Foam, droplets, sticky liquids and deposits can blur that distinction and cause false alarms or missed transitions. KOBOLD warns against mounting its OPT sensor with the tip pointing downward because retained drops can produce errors. Cleaning procedures and correct orientation reduce risk, but they also create service requirements. The modeled -1.10-point drag reflects this real application limitation.

Qualification expense slows replacement decisions

Replacing a mechanical float with an infrared switch is rarely just a component swap. Engineers must verify process-thread fit, supply voltage, input polarity, chemical resistance and failure behavior; some regulated equipment also needs a new validation record. Where the existing sensor works adequately, the switching benefit may not justify immediate redesign. This adoption friction accounts for the modeled -0.80-point residual restraint, with the strongest effect in early qualification periods.

MARKET OPPORTUNITIES

Protected switches for demanding industrial environments

Specialist glass tips and metal housings can serve processes that exceed the limits of ordinary molded plastic detectors, provided the complete sensor and its seals are qualified. SST Sensing offers industrial glass-tip products, while WIKA supplies protected optoelectronic assemblies for demanding installations. These designs create a premium market tier where temperature, vibration and chemical compatibility can outweigh component price. Suppliers should avoid marketing generic resistance claims without specifying the wetted construction and test conditions.

Application engineering as a differentiator

Many optical-level failures are installation or media-selection problems rather than fundamental defects in the infrared principle. Suppliers can reduce this risk by providing wetting guidance, mounting diagrams, sample evaluation units and clear NPN/PNP wiring instructions. This service capability is especially valuable to OEMs that deploy the same detector in several vessel designs. A reliable qualification process can create long-term design retention and aftermarket demand without depending on aggressive price discounting.

Digitally supervised control architectures

Most optical point switches provide a discrete alarm rather than a rich diagnostic stream, but they can still be integrated into controllers that log switching frequency, alarm duration and process context. Competing IO-Link and HART-equipped level instruments demonstrate the direction of broader plant connectivity, not optical-switch revenue. An optical supplier that improves interface documentation and fault-state signaling may capture applications where operators want simple point detection within a more observable control system.

Optical Level Switch Supply Chain Analysis

The value chain moves from optical-grade materials and infrared semiconductors to prism fabrication, electronics integration, process assembly, distribution and end-use equipment. The critical quality handoff occurs when a bare sensing element becomes a liquid-contacting, electrically compatible and mechanically qualified switch. Different manufacturers participate at different stages, so corporate revenue should not be treated as equivalent to sales of finished optical level switches.

MaterialsPolysulfone, fluorocarbon-compatible wetted parts, glass, stainless steel, seals and cables
ElectronicsInfrared LED, photodetector, comparator, output transistor and protection components
IntegrationPrism assembly, wet/dry calibration, housing and process connection qualification
End usersOEM machinery, tank operators, fluid-handling systems and maintenance distributors

Upstream materials. Optical-grade polymers and glass must maintain a consistent refractive interface across production lots, while seals and housings must withstand the process medium. A material selected for mechanical strength may still be unsuitable for a particular solvent or cleaning agent. Suppliers that qualify multiple wetted constructions can support broader applications, but this flexibility increases inventory complexity. The critical purchasing specification is therefore the full wetted assembly rather than the generic family name of one polymer.

Electronics and calibration. The emitter, receiver and switching circuit convert a change in reflected infrared light into a discrete control signal. Production tests need to check dry and immersed states, output polarity and tolerance to supply variations. A poorly controlled optical threshold can lead to inconsistent switching between nominally identical parts. Repeatable calibration and traceable test procedures become important for OEM customers who cannot afford to troubleshoot every finished machine after installation.

Channels and installation. Industrial distributors supply replacement instruments to maintenance teams, while equipment manufacturers may buy optical elements in bulk for direct integration. The former channel emphasizes readily identifiable spare parts and local stock; the latter rewards stable form factors and reference circuits. Installation instructions are a significant part of the delivered value because an incorrectly oriented prism can retain droplets and create false indications. Product support therefore influences repeat purchases even in relatively simple switching applications.

Downstream users. End customers evaluate the level alarm as one component of a larger process-safety or machine-control system. A missed high-level signal can damage equipment, whereas a false low-level alarm can interrupt production. The appropriate switch depends on media clarity, temperature, pressure and maintenance access, not solely the quoted sensor price. This downstream responsibility explains the persistence of higher-priced, fully qualified assemblies alongside low-cost OEM modules.

Product and Technology Developments in the Optical Level Switch Market

  • Product specification Verified
    SST Sensing documents its Optomax industrial infrared range with multiple housing and material configurations for liquid point detection. The commercial significance is flexibility: an OEM can evaluate a compact optical principle and select a more protected assembly for tougher process conditions. The product information establishes available technical options but does not demonstrate a new market-share gain or a dated product launch. Source
  • Product specification Verified
    KOBOLD USA specifies a maximum service temperature of 80 degrees Celsius for the OPT family and describes a hemispherical optical interface that changes reflected light when immersed. This combination is useful for equipment engineers who must balance low switching hysteresis against the thermal demands of a process. The published product data support component selection, but do not imply that the same unit is suitable for hot sterilization or strongly coating liquids. Source
  • Product specification Verified
    WIKA presents the OLS-5200 as a shipbuilding-oriented optoelectronic level switch with vibration resistance, DNV GL approval and a stated operating envelope up to 130 degrees Celsius and 25 bar. The specification highlights the premium end of optical point-level detection, where mechanical integrity and process protection affect procurement. These product attributes are evidence of supplier capability, not evidence that marine applications account for a particular share of global demand. Source
  • Technology benchmark Adjacent
    Emerson describes vibrating-fork level switches with process-oriented diagnostic features, while ifm documents digitally integrated alternatives. These technologies compete for some of the same alarm duties but do not belong in optical-prism switch revenue. Their significance is competitive pressure: optical vendors need to explain where a compact, simple infrared detector is preferable and where difficult media or diagnostic requirements justify a different sensing principle. Source

REPORT SCOPE & SEGMENTATION

Attribute Details
Study Period 2023–2034
Base Year 2025
Estimated Year 2026
Forecast Period 2026–2034
Historical Reference 2023
Market Size 2025 USD 2,915 million
Market Size 2026 USD 3,192 million
Market Size 2034 USD 6,597 million
Growth Rate CAGR of 9.5% over 2025–2034
Unit Revenue (USD million); modeled segment shares in percent
Segmentation By Type, By Application and By Region
By Type Polysulfone Materials · Flurocarbon Materials · Others
By Application Food and Beverage · Pharmaceutical · Liquid Holding Tanks · Hydraulic Reservoirs · Others
By Region Each region considered by Type, Application and selected countries; shares are modeled 2025 estimates.
North AmericaUnited States, Canada
EuropeGermany, United Kingdom, Rest of Europe
Asia-PacificChina, Japan, India, Rest of Asia-Pacific
South AmericaBrazil, Mexico and neighboring markets
Middle East & AfricaSaudi Arabia, United Arab Emirates, South Africa, Rest of region
Key Companies Profiled SST Sensing; KOBOLD; DwyerOmega / Omega Engineering; WIKA
Customization Scope Free report customization (equivalent to up to 4 analyst working days) with purchase. Addition or alteration to country, regional and segment scope.

Frequently Asked Questions

What is the size of the optical level switch market?

Global revenue for this product category is USD 2,915 million in 2025, rising toward USD 6,597 million by 2034 at a 9.5% CAGR across 2025–2034. The 2026 estimate is USD 3,192 million. These standardized-window values are calculated from the published 2023 and 2030 monetary anchors rather than independently reported observations for every year.

How does an infrared optical liquid-level switch work?

An emitter directs infrared light toward a transparent prism at a fixed position in a vessel. When the prism is dry, much of the light returns to the receiver; contact with liquid changes the refractive boundary and reduces the reflected signal. The electronics then change a discrete output used for an alarm or interlock. The device senses a threshold, not the full liquid-height profile, and requires suitable media and mounting.

Which material type has the largest modeled revenue share?

Polysulfone Materials hold the largest estimated 2025 share at ~59%, followed by Flurocarbon Materials at ~25% and other constructions at ~16%. This ordering reflects the broad use of affordable molded tips in equipment and general tank applications. The shares are analytical allocations rather than supplier-disclosed transactions, and the correct wetted material still depends on liquid chemistry, temperature, seals and the installation environment.

What are the principal application segments?

The application categories are Liquid Holding Tanks, Food and Beverage, Hydraulic Reservoirs, Pharmaceutical and Others. Their modeled 2025 shares are ~27%, ~23%, ~19%, ~17% and ~14%, respectively. Tank alarms cover a broad installed base, while regulated or compact equipment can justify higher-value configurations. The categories describe end-use destinations, so a single physical sensor should not be counted twice when supplied inside a finished machine.

Which region leads demand for optical level switches?

Asia-Pacific holds the largest estimated regional share at ~39% in 2025, supported by extensive fluid-handling equipment production and industrial tank installations. North America follows at ~26%, Europe at ~23%, South America at ~7%, and the Middle East and Africa at ~5%. These are modeled revenue shares; the published historical North American figure provides one calibration point but does not independently validate all regional allocations.

Which manufacturers supply optical point-level switches?

Relevant suppliers with identifiable optical liquid-level products include SST Sensing, KOBOLD, DwyerOmega and WIKA. Their offerings differ in tip material, electrical interface, housing protection and target application. A supplier’s total instrumentation turnover is not a reliable measure of its optical-switch business, because many companies also sell pressure, flow, radar, ultrasonic and vibrating-fork products. Product-level qualification is therefore more useful than an unsupported market-share ranking.

Why do some applications choose optical detection over floats?

A compact optical detector has no mechanical float arm or pivot, reducing one source of wear and making installation easier in small vessels. It can provide a fast high-level or low-level signal to a controller when the liquid and mounting geometry are appropriate. The advantage is conditional: residues, foam and retained droplets can affect optical response, so an optical switch is not automatically superior for every fluid.

What are the largest restraints on market growth?

The largest competitive restraint is the availability of other sensing principles for difficult liquids and process conditions. Fouling, droplets and chemical compatibility can also compromise the prism interface, while qualification and wiring changes increase replacement cost. These factors are represented as negative contributions in the growth-impact analysis, not as independently measured percentages of failed installations. Selecting the correct device begins with the actual liquid and process conditions.

What is the difference between an optical switch and a continuous level sensor?

An optical point switch detects whether liquid has reached a particular mounting height and sends a discrete output. A continuous level sensor measures the changing fill level across a range and may use radar, ultrasonic, pressure or another technology. The two can coexist on one vessel: continuous measurement supports inventory or process control, while an independent point alarm may provide a separate protective function. Their revenues should not be combined under the optical-switch category.

What does the 2026–2034 forecast cover?

The forecast includes sales of infrared or optoelectronic liquid point switches and directly integrated optical switching assemblies for the publisher’s Type and Application categories. It excludes unrelated optical networking components and nonoptical level instruments. Market values are expressed in USD million, with modeled 2025 segmentation and regional shares. The forecast extends the original 2023 and 2030 headline anchors at their implied rate; it is not a manufacturer-by-manufacturer audit.

Research Sources & Evidence Base

View research sources used for this overview
  1. SST Sensing. LLHP liquid-level switches, Stainless housings, optical tips and industrial configuration choices.
  2. SST Sensing. Optomax industrial optical switches, Optical point detection and available industrial configurations.
  3. SST Sensing. Optomax Basic OEM range, Miniature sensing elements and integration arrangements.
  4. SST Sensing. Hazardous-area optical switches, Specialist approved constructions and output options.
  5. SST Sensing. Optical tip compatibility, Differences between polymer and glass optical materials.
  6. KOBOLD USA. OPT optical level switch, NPN/PNP output, optical principle, fittings and temperature rating.
  7. WIKA. OLS-5200 optoelectronic switch, Marine application, vibration resistance and operating envelope.
  8. WIKA. OLS-C01 industrial switch, Optical prism operation and industrial design.
  9. DwyerOmega. LVE-950 miniature optical switches, Compact mounting and wetted material variants.
  10. DwyerOmega. Optomax glass-tip switch, Harsh-environment optical interface options.
  11. Omron. Fiber-optic liquid detection, Adjacent optical implementation, not identical product revenue.
  12. ifm. Point-level instrumentation, Adjacent electronic monitoring and interface benchmark.
  13. ifm. Radar level instruments, Alternative continuous sensing architecture.
  14. Emerson. Rosemount 2120 vibrating fork, Competing point-level sensing principle.
  15. Emerson. Rosemount 2140 vibrating fork, Diagnostic alternatives to simple optical point switching.
  16. TE Connectivity. Ultrasonic point-level technology, Alternative nonoptical liquid detection.
Optical Level Switch Market, Size, Trends, Business Strategies 2026-2034

Get Sample Report PDF for Exclusive Insights

Report Sample Includes

  • Table of Contents
  • List of Tables & Figures
  • Charts, Research Methodology, and more...

PDF Icon Download Sample Report PDF

Download Sample Report

Table of Content

Table of Contents
1 Research Methodology and Statistical Scope
1.1 Market Definition and Statistical Scope of Optical Level Switch
1.2 Key Market Segments
1.2.1 Optical Level Switch Segment by Type
1.2.2 Optical Level Switch Segment by Application
1.3 Methodology & Sources of Information
1.3.1 Research Methodology
1.3.2 Research Process
1.3.3 Market Breakdown and Data Triangulation
1.3.4 Base Year
1.3.5 Report Assumptions & Caveats
2 Optical Level Switch Market Overview
2.1 Global Market Overview
2.1.1 Global Optical Level Switch Market Size (M USD) Estimates and Forecasts (2026-2034)
2.1.2 Global Optical Level Switch Sales Estimates and Forecasts (2026-2034)
2.2 Market Segment Executive Summary
2.3 Global Market Size by Region
3 Optical Level Switch Market Competitive Landscape
3.1 Global Optical Level Switch Sales by Manufacturers (2019-2025)
3.2 Global Optical Level Switch Revenue Market Share by Manufacturers (2019-2025)
3.3 Optical Level Switch Market Share by Company Type (Tier 1, Tier 2, and Tier 3)
3.4 Global Optical Level Switch Average Price by Manufacturers (2019-2025)
3.5 Manufacturers Optical Level Switch Sales Sites, Area Served, Product Type
3.6 Optical Level Switch Market Competitive Situation and Trends
3.6.1 Optical Level Switch Market Concentration Rate
3.6.2 Global 5 and 10 Largest Optical Level Switch Players Market Share by Revenue
3.6.3 Mergers & Acquisitions, Expansion
4 Optical Level Switch Industry Chain Analysis
4.1 Optical Level Switch Industry Chain Analysis
4.2 Market Overview of Key Raw Materials
4.3 Midstream Market Analysis
4.4 Downstream Customer Analysis
5 The Development and Dynamics of Optical Level Switch Market
5.1 Key Development Trends
5.2 Driving Factors
5.3 Market Challenges
5.4 Market Restraints
5.5 Industry News
5.5.1 New Product Developments
5.5.2 Mergers & Acquisitions
5.5.3 Expansions
5.5.4 Collaboration/Supply Contracts
5.6 Industry Policies
6 Optical Level Switch Market Segmentation by Type
6.1 Evaluation Matrix of Segment Market Development Potential (Type)
6.2 Global Optical Level Switch Sales Market Share by Type (2019-2025)
6.3 Global Optical Level Switch Market Size Market Share by Type (2019-2025)
6.4 Global Optical Level Switch Price by Type (2019-2025)
7 Optical Level Switch Market Segmentation by Application
7.1 Evaluation Matrix of Segment Market Development Potential (Application)
7.2 Global Optical Level Switch Market Sales by Application (2019-2025)
7.3 Global Optical Level Switch Market Size (M USD) by Application (2019-2025)
7.4 Global Optical Level Switch Sales Growth Rate by Application (2019-2025)
8 Optical Level Switch Market Segmentation by Region
8.1 Global Optical Level Switch Sales by Region
8.1.1 Global Optical Level Switch Sales by Region
8.1.2 Global Optical Level Switch Sales Market Share by Region
8.2 North America
8.2.1 North America Optical Level Switch Sales by Country
8.2.2 U.S.
8.2.3 Canada
8.2.4 Mexico
8.3 Europe
8.3.1 Europe Optical Level Switch Sales by Country
8.3.2 Germany
8.3.3 France
8.3.4 U.K.
8.3.5 Italy
8.3.6 Russia
8.4 Asia Pacific
8.4.1 Asia Pacific Optical Level Switch Sales by Region
8.4.2 China
8.4.3 Japan
8.4.4 South Korea
8.4.5 India
8.4.6 Southeast Asia
8.5 South America
8.5.1 South America Optical Level Switch Sales by Country
8.5.2 Brazil
8.5.3 Argentina
8.5.4 Columbia
8.6 Middle East and Africa
8.6.1 Middle East and Africa Optical Level Switch Sales by Region
8.6.2 Saudi Arabia
8.6.3 UAE
8.6.4 Egypt
8.6.5 Nigeria
8.6.6 South Africa
9 Key Companies Profile
9.1 SST Sensing
9.1.1 SST Sensing Optical Level Switch Basic Information
9.1.2 SST Sensing Optical Level Switch Product Overview
9.1.3 SST Sensing Optical Level Switch Product Market Performance
9.1.4 SST Sensing Business Overview
9.1.5 SST Sensing Optical Level Switch SWOT Analysis
9.1.6 SST Sensing Recent Developments
9.2 Sensorland
9.2.1 Sensorland Optical Level Switch Basic Information
9.2.2 Sensorland Optical Level Switch Product Overview
9.2.3 Sensorland Optical Level Switch Product Market Performance
9.2.4 Sensorland Business Overview
9.2.5 Sensorland Optical Level Switch SWOT Analysis
9.2.6 Sensorland Recent Developments
9.3 Madison Company
9.3.1 Madison Company Optical Level Switch Basic Information
9.3.2 Madison Company Optical Level Switch Product Overview
9.3.3 Madison Company Optical Level Switch Product Market Performance
9.3.4 Madison Company Optical Level Switch SWOT Analysis
9.3.5 Madison Company Business Overview
9.3.6 Madison Company Recent Developments
9.4 Dwyer
9.4.1 Dwyer Optical Level Switch Basic Information
9.4.2 Dwyer Optical Level Switch Product Overview
9.4.3 Dwyer Optical Level Switch Product Market Performance
9.4.4 Dwyer Business Overview
9.4.5 Dwyer Recent Developments
9.5 Teklab
9.5.1 Teklab Optical Level Switch Basic Information
9.5.2 Teklab Optical Level Switch Product Overview
9.5.3 Teklab Optical Level Switch Product Market Performance
9.5.4 Teklab Business Overview
9.5.5 Teklab Recent Developments
9.6 Omega Engineering
9.6.1 Omega Engineering Optical Level Switch Basic Information
9.6.2 Omega Engineering Optical Level Switch Product Overview
9.6.3 Omega Engineering Optical Level Switch Product Market Performance
9.6.4 Omega Engineering Business Overview
9.6.5 Omega Engineering Recent Developments
9.7 Neptune Systems
9.7.1 Neptune Systems Optical Level Switch Basic Information
9.7.2 Neptune Systems Optical Level Switch Product Overview
9.7.3 Neptune Systems Optical Level Switch Product Market Performance
9.7.4 Neptune Systems Business Overview
9.7.5 Neptune Systems Recent Developments
9.8 KOBOLD USA
9.8.1 KOBOLD USA Optical Level Switch Basic Information
9.8.2 KOBOLD USA Optical Level Switch Product Overview
9.8.3 KOBOLD USA Optical Level Switch Product Market Performance
9.8.4 KOBOLD USA Business Overview
9.8.5 KOBOLD USA Recent Developments
9.9 SICK USA
9.9.1 SICK USA Optical Level Switch Basic Information
9.9.2 SICK USA Optical Level Switch Product Overview
9.9.3 SICK USA Optical Level Switch Product Market Performance
9.9.4 SICK USA Business Overview
9.9.5 SICK USA Recent Developments
9.10 Celectric Sdn Bhd
9.10.1 Celectric Sdn Bhd Optical Level Switch Basic Information
9.10.2 Celectric Sdn Bhd Optical Level Switch Product Overview
9.10.3 Celectric Sdn Bhd Optical Level Switch Product Market Performance
9.10.4 Celectric Sdn Bhd Business Overview
9.10.5 Celectric Sdn Bhd Recent Developments
9.11 BD Measure
9.11.1 BD Measure Optical Level Switch Basic Information
9.11.2 BD Measure Optical Level Switch Product Overview
9.11.3 BD Measure Optical Level Switch Product Market Performance
9.11.4 BD Measure Business Overview
9.11.5 BD Measure Recent Developments
9.12 FineTek
9.12.1 FineTek Optical Level Switch Basic Information
9.12.2 FineTek Optical Level Switch Product Overview
9.12.3 FineTek Optical Level Switch Product Market Performance
9.12.4 FineTek Business Overview
9.12.5 FineTek Recent Developments
9.13 LC Automation
9.13.1 LC Automation Optical Level Switch Basic Information
9.13.2 LC Automation Optical Level Switch Product Overview
9.13.3 LC Automation Optical Level Switch Product Market Performance
9.13.4 LC Automation Business Overview
9.13.5 LC Automation Recent Developments
9.14 TECH IMPRO AUTOMATION SOLUTION SDN BHD
9.14.1 TECH IMPRO AUTOMATION SOLUTION SDN BHD Optical Level Switch Basic Information
9.14.2 TECH IMPRO AUTOMATION SOLUTION SDN BHD Optical Level Switch Product Overview
9.14.3 TECH IMPRO AUTOMATION SOLUTION SDN BHD Optical Level Switch Product Market Performance
9.14.4 TECH IMPRO AUTOMATION SOLUTION SDN BHD Business Overview
9.14.5 TECH IMPRO AUTOMATION SOLUTION SDN BHD Recent Developments
9.15 Emerson Climate Technologies
9.15.1 Emerson Climate Technologies Optical Level Switch Basic Information
9.15.2 Emerson Climate Technologies Optical Level Switch Product Overview
9.15.3 Emerson Climate Technologies Optical Level Switch Product Market Performance
9.15.4 Emerson Climate Technologies Business Overview
9.15.5 Emerson Climate Technologies Recent Developments
9.16 Riels Instruments
9.16.1 Riels Instruments Optical Level Switch Basic Information
9.16.2 Riels Instruments Optical Level Switch Product Overview
9.16.3 Riels Instruments Optical Level Switch Product Market Performance
9.16.4 Riels Instruments Business Overview
9.16.5 Riels Instruments Recent Developments
9.17 Cynergy3
9.17.1 Cynergy3 Optical Level Switch Basic Information
9.17.2 Cynergy3 Optical Level Switch Product Overview
9.17.3 Cynergy3 Optical Level Switch Product Market Performance
9.17.4 Cynergy3 Business Overview
9.17.5 Cynergy3 Recent Developments
10 Optical Level Switch Market Forecast by Region
10.1 Global Optical Level Switch Market Size Forecast
10.2 Global Optical Level Switch Market Forecast by Region
10.2.1 North America Market Size Forecast by Country
10.2.2 Europe Optical Level Switch Market Size Forecast by Country
10.2.3 Asia Pacific Optical Level Switch Market Size Forecast by Region
10.2.4 South America Optical Level Switch Market Size Forecast by Country
10.2.5 Middle East and Africa Forecasted Consumption of Optical Level Switch by Country
11 Forecast Market by Type and by Application (2025-2030)
11.1 Global Optical Level Switch Market Forecast by Type (2025-2030)
11.1.1 Global Forecasted Sales of Optical Level Switch by Type (2025-2030)
11.1.2 Global Optical Level Switch Market Size Forecast by Type (2025-2030)
11.1.3 Global Forecasted Price of Optical Level Switch by Type (2025-2030)
11.2 Global Optical Level Switch Market Forecast by Application (2025-2030)
11.2.1 Global Optical Level Switch Sales (K Units) Forecast by Application
11.2.2 Global Optical Level Switch Market Size (M USD) Forecast by Application (2025-2030)
12 Conclusion and Key FindingsList of Tables
Table 1. Introduction of the Type
Table 2. Introduction of the Application
Table 3. Market Size (M USD) Segment Executive Summary
Table 4. Optical Level Switch Market Size Comparison by Region (M USD)
Table 5. Global Optical Level Switch Sales (K Units) by Manufacturers (2019-2025)
Table 6. Global Optical Level Switch Sales Market Share by Manufacturers (2019-2025)
Table 7. Global Optical Level Switch Revenue (M USD) by Manufacturers (2019-2025)
Table 8. Global Optical Level Switch Revenue Share by Manufacturers (2019-2025)
Table 9. Company Type (Tier 1, Tier 2, and Tier 3) & (based on the Revenue in Optical Level Switch as of 2022)
Table 10. Global Market Optical Level Switch Average Price (USD/Unit) of Key Manufacturers (2019-2025)
Table 11. Manufacturers Optical Level Switch Sales Sites and Area Served
Table 12. Manufacturers Optical Level Switch Product Type
Table 13. Global Optical Level Switch Manufacturers Market Concentration Ratio (CR5 and HHI)
Table 14. Mergers & Acquisitions, Expansion Plans
Table 15. Industry Chain Map of Optical Level Switch
Table 16. Market Overview of Key Raw Materials
Table 17. Midstream Market Analysis
Table 18. Downstream Customer Analysis
Table 19. Key Development Trends
Table 20. Driving Factors
Table 21. Optical Level Switch Market Challenges
Table 22. Global Optical Level Switch Sales by Type (K Units)
Table 23. Global Optical Level Switch Market Size by Type (M USD)
Table 24. Global Optical Level Switch Sales (K Units) by Type (2019-2025)
Table 25. Global Optical Level Switch Sales Market Share by Type (2019-2025)
Table 26. Global Optical Level Switch Market Size (M USD) by Type (2019-2025)
Table 27. Global Optical Level Switch Market Size Share by Type (2019-2025)
Table 28. Global Optical Level Switch Price (USD/Unit) by Type (2019-2025)
Table 29. Global Optical Level Switch Sales (K Units) by Application
Table 30. Global Optical Level Switch Market Size by Application
Table 31. Global Optical Level Switch Sales by Application (2019-2025) & (K Units)
Table 32. Global Optical Level Switch Sales Market Share by Application (2019-2025)
Table 33. Global Optical Level Switch Sales by Application (2019-2025) & (M USD)
Table 34. Global Optical Level Switch Market Share by Application (2019-2025)
Table 35. Global Optical Level Switch Sales Growth Rate by Application (2019-2025)
Table 36. Global Optical Level Switch Sales by Region (2019-2025) & (K Units)
Table 37. Global Optical Level Switch Sales Market Share by Region (2019-2025)
Table 38. North America Optical Level Switch Sales by Country (2019-2025) & (K Units)
Table 39. Europe Optical Level Switch Sales by Country (2019-2025) & (K Units)
Table 40. Asia Pacific Optical Level Switch Sales by Region (2019-2025) & (K Units)
Table 41. South America Optical Level Switch Sales by Country (2019-2025) & (K Units)
Table 42. Middle East and Africa Optical Level Switch Sales by Region (2019-2025) & (K Units)
Table 43. SST Sensing Optical Level Switch Basic Information
Table 44. SST Sensing Optical Level Switch Product Overview
Table 45. SST Sensing Optical Level Switch Sales (K Units), Revenue (M USD), Price (USD/Unit) and Gross Margin (2019-2025)
Table 46. SST Sensing Business Overview
Table 47. SST Sensing Optical Level Switch SWOT Analysis
Table 48. SST Sensing Recent Developments
Table 49. Sensorland Optical Level Switch Basic Information
Table 50. Sensorland Optical Level Switch Product Overview
Table 51. Sensorland Optical Level Switch Sales (K Units), Revenue (M USD), Price (USD/Unit) and Gross Margin (2019-2025)
Table 52. Sensorland Business Overview
Table 53. Sensorland Optical Level Switch SWOT Analysis
Table 54. Sensorland Recent Developments
Table 55. Madison Company Optical Level Switch Basic Information
Table 56. Madison Company Optical Level Switch Product Overview
Table 57. Madison Company Optical Level Switch Sales (K Units), Revenue (M USD), Price (USD/Unit) and Gross Margin (2019-2025)
Table 58. Madison Company Optical Level Switch SWOT Analysis
Table 59. Madison Company Business Overview
Table 60. Madison Company Recent Developments
Table 61. Dwyer Optical Level Switch Basic Information
Table 62. Dwyer Optical Level Switch Product Overview
Table 63. Dwyer Optical Level Switch Sales (K Units), Revenue (M USD), Price (USD/Unit) and Gross Margin (2019-2025)
Table 64. Dwyer Business Overview
Table 65. Dwyer Recent Developments
Table 66. Teklab Optical Level Switch Basic Information
Table 67. Teklab Optical Level Switch Product Overview
Table 68. Teklab Optical Level Switch Sales (K Units), Revenue (M USD), Price (USD/Unit) and Gross Margin (2019-2025)
Table 69. Teklab Business Overview
Table 70. Teklab Recent Developments
Table 71. Omega Engineering Optical Level Switch Basic Information
Table 72. Omega Engineering Optical Level Switch Product Overview
Table 73. Omega Engineering Optical Level Switch Sales (K Units), Revenue (M USD), Price (USD/Unit) and Gross Margin (2019-2025)
Table 74. Omega Engineering Business Overview
Table 75. Omega Engineering Recent Developments
Table 76. Neptune Systems Optical Level Switch Basic Information
Table 77. Neptune Systems Optical Level Switch Product Overview
Table 78. Neptune Systems Optical Level Switch Sales (K Units), Revenue (M USD), Price (USD/Unit) and Gross Margin (2019-2025)
Table 79. Neptune Systems Business Overview
Table 80. Neptune Systems Recent Developments
Table 81. KOBOLD USA Optical Level Switch Basic Information
Table 82. KOBOLD USA Optical Level Switch Product Overview
Table 83. KOBOLD USA Optical Level Switch Sales (K Units), Revenue (M USD), Price (USD/Unit) and Gross Margin (2019-2025)
Table 84. KOBOLD USA Business Overview
Table 85. KOBOLD USA Recent Developments
Table 86. SICK USA Optical Level Switch Basic Information
Table 87. SICK USA Optical Level Switch Product Overview
Table 88. SICK USA Optical Level Switch Sales (K Units), Revenue (M USD), Price (USD/Unit) and Gross Margin (2019-2025)
Table 89. SICK USA Business Overview
Table 90. SICK USA Recent Developments
Table 91. Celectric Sdn Bhd Optical Level Switch Basic Information
Table 92. Celectric Sdn Bhd Optical Level Switch Product Overview
Table 93. Celectric Sdn Bhd Optical Level Switch Sales (K Units), Revenue (M USD), Price (USD/Unit) and Gross Margin (2019-2025)
Table 94. Celectric Sdn Bhd Business Overview
Table 95. Celectric Sdn Bhd Recent Developments
Table 96. BD Measure Optical Level Switch Basic Information
Table 97. BD Measure Optical Level Switch Product Overview
Table 98. BD Measure Optical Level Switch Sales (K Units), Revenue (M USD), Price (USD/Unit) and Gross Margin (2019-2025)
Table 99. BD Measure Business Overview
Table 100. BD Measure Recent Developments
Table 101. FineTek Optical Level Switch Basic Information
Table 102. FineTek Optical Level Switch Product Overview
Table 103. FineTek Optical Level Switch Sales (K Units), Revenue (M USD), Price (USD/Unit) and Gross Margin (2019-2025)
Table 104. FineTek Business Overview
Table 105. FineTek Recent Developments
Table 106. LC Automation Optical Level Switch Basic Information
Table 107. LC Automation Optical Level Switch Product Overview
Table 108. LC Automation Optical Level Switch Sales (K Units), Revenue (M USD), Price (USD/Unit) and Gross Margin (2019-2025)
Table 109. LC Automation Business Overview
Table 110. LC Automation Recent Developments
Table 111. TECH IMPRO AUTOMATION SOLUTION SDN BHD Optical Level Switch Basic Information
Table 112. TECH IMPRO AUTOMATION SOLUTION SDN BHD Optical Level Switch Product Overview
Table 113. TECH IMPRO AUTOMATION SOLUTION SDN BHD Optical Level Switch Sales (K Units), Revenue (M USD), Price (USD/Unit) and Gross Margin (2019-2025)
Table 114. TECH IMPRO AUTOMATION SOLUTION SDN BHD Business Overview
Table 115. TECH IMPRO AUTOMATION SOLUTION SDN BHD Recent Developments
Table 116. Emerson Climate Technologies Optical Level Switch Basic Information
Table 117. Emerson Climate Technologies Optical Level Switch Product Overview
Table 118. Emerson Climate Technologies Optical Level Switch Sales (K Units), Revenue (M USD), Price (USD/Unit) and Gross Margin (2019-2025)
Table 119. Emerson Climate Technologies Business Overview
Table 120. Emerson Climate Technologies Recent Developments
Table 121. Riels Instruments Optical Level Switch Basic Information
Table 122. Riels Instruments Optical Level Switch Product Overview
Table 123. Riels Instruments Optical Level Switch Sales (K Units), Revenue (M USD), Price (USD/Unit) and Gross Margin (2019-2025)
Table 124. Riels Instruments Business Overview
Table 125. Riels Instruments Recent Developments
Table 126. Cynergy3 Optical Level Switch Basic Information
Table 127. Cynergy3 Optical Level Switch Product Overview
Table 128. Cynergy3 Optical Level Switch Sales (K Units), Revenue (M USD), Price (USD/Unit) and Gross Margin (2019-2025)
Table 129. Cynergy3 Business Overview
Table 130. Cynergy3 Recent Developments
Table 131. Global Optical Level Switch Sales Forecast by Region (2025-2030) & (K Units)
Table 132. Global Optical Level Switch Market Size Forecast by Region (2025-2030) & (M USD)
Table 133. North America Optical Level Switch Sales Forecast by Country (2025-2030) & (K Units)
Table 134. North America Optical Level Switch Market Size Forecast by Country (2025-2030) & (M USD)
Table 135. Europe Optical Level Switch Sales Forecast by Country (2025-2030) & (K Units)
Table 136. Europe Optical Level Switch Market Size Forecast by Country (2025-2030) & (M USD)
Table 137. Asia Pacific Optical Level Switch Sales Forecast by Region (2025-2030) & (K Units)
Table 138. Asia Pacific Optical Level Switch Market Size Forecast by Region (2025-2030) & (M USD)
Table 139. South America Optical Level Switch Sales Forecast by Country (2025-2030) & (K Units)
Table 140. South America Optical Level Switch Market Size Forecast by Country (2025-2030) & (M USD)
Table 141. Middle East and Africa Optical Level Switch Consumption Forecast by Country (2025-2030) & (Units)
Table 142. Middle East and Africa Optical Level Switch Market Size Forecast by Country (2025-2030) & (M USD)
Table 143. Global Optical Level Switch Sales Forecast by Type (2025-2030) & (K Units)
Table 144. Global Optical Level Switch Market Size Forecast by Type (2025-2030) & (M USD)
Table 145. Global Optical Level Switch Price Forecast by Type (2025-2030) & (USD/Unit)
Table 146. Global Optical Level Switch Sales (K Units) Forecast by Application (2025-2030)
Table 147. Global Optical Level Switch Market Size Forecast by Application (2025-2030) & (M USD)
List of Figures
Figure 1. Product Picture of Optical Level Switch
Figure 2. Data Triangulation
Figure 3. Key Caveats
Figure 4. Global Optical Level Switch Market Size (M USD), 2026-2034
Figure 5. Global Optical Level Switch Market Size (M USD) (2026-2034)
Figure 6. Global Optical Level Switch Sales (K Units) & (2026-2034)
Figure 7. Evaluation Matrix of Segment Market Development Potential (Type)
Figure 8. Evaluation Matrix of Segment Market Development Potential (Application)
Figure 9. Evaluation Matrix of Regional Market Development Potential
Figure 10. Optical Level Switch Market Size by Country (M USD)
Figure 11. Optical Level Switch Sales Share by Manufacturers in 2023
Figure 12. Global Optical Level Switch Revenue Share by Manufacturers in 2023
Figure 13. Optical Level Switch Market Share by Company Type (Tier 1, Tier 2 and Tier 3): 2023
Figure 14. Global Market Optical Level Switch Average Price (USD/Unit) of Key Manufacturers in 2023
Figure 15. The Global 5 and 10 Largest Players: Market Share by Optical Level Switch Revenue in 2023
Figure 16. Evaluation Matrix of Segment Market Development Potential (Type)
Figure 17. Global Optical Level Switch Market Share by Type
Figure 18. Sales Market Share of Optical Level Switch by Type (2019-2025)
Figure 19. Sales Market Share of Optical Level Switch by Type in 2023
Figure 20. Market Size Share of Optical Level Switch by Type (2019-2025)
Figure 21. Market Size Market Share of Optical Level Switch by Type in 2023
Figure 22. Evaluation Matrix of Segment Market Development Potential (Application)
Figure 23. Global Optical Level Switch Market Share by Application
Figure 24. Global Optical Level Switch Sales Market Share by Application (2019-2025)
Figure 25. Global Optical Level Switch Sales Market Share by Application in 2023
Figure 26. Global Optical Level Switch Market Share by Application (2019-2025)
Figure 27. Global Optical Level Switch Market Share by Application in 2023
Figure 28. Global Optical Level Switch Sales Growth Rate by Application (2019-2025)
Figure 29. Global Optical Level Switch Sales Market Share by Region (2019-2025)
Figure 30. North America Optical Level Switch Sales and Growth Rate (2019-2025) & (K Units)
Figure 31. North America Optical Level Switch Sales Market Share by Country in 2023
Figure 32. U.S. Optical Level Switch Sales and Growth Rate (2019-2025) & (K Units)
Figure 33. Canada Optical Level Switch Sales (K Units) and Growth Rate (2019-2025)
Figure 34. Mexico Optical Level Switch Sales (Units) and Growth Rate (2019-2025)
Figure 35. Europe Optical Level Switch Sales and Growth Rate (2019-2025) & (K Units)
Figure 36. Europe Optical Level Switch Sales Market Share by Country in 2023
Figure 37. Germany Optical Level Switch Sales and Growth Rate (2019-2025) & (K Units)
Figure 38. France Optical Level Switch Sales and Growth Rate (2019-2025) & (K Units)
Figure 39. U.K. Optical Level Switch Sales and Growth Rate (2019-2025) & (K Units)
Figure 40. Italy Optical Level Switch Sales and Growth Rate (2019-2025) & (K Units)
Figure 41. Russia Optical Level Switch Sales and Growth Rate (2019-2025) & (K Units)
Figure 42. Asia Pacific Optical Level Switch Sales and Growth Rate (K Units)
Figure 43. Asia Pacific Optical Level Switch Sales Market Share by Region in 2023
Figure 44. China Optical Level Switch Sales and Growth Rate (2019-2025) & (K Units)
Figure 45. Japan Optical Level Switch Sales and Growth Rate (2019-2025) & (K Units)
Figure 46. South Korea Optical Level Switch Sales and Growth Rate (2019-2025) & (K Units)
Figure 47. India Optical Level Switch Sales and Growth Rate (2019-2025) & (K Units)
Figure 48. Southeast Asia Optical Level Switch Sales and Growth Rate (2019-2025) & (K Units)
Figure 49. South America Optical Level Switch Sales and Growth Rate (K Units)
Figure 50. South America Optical Level Switch Sales Market Share by Country in 2023
Figure 51. Brazil Optical Level Switch Sales and Growth Rate (2019-2025) & (K Units)
Figure 52. Argentina Optical Level Switch Sales and Growth Rate (2019-2025) & (K Units)
Figure 53. Columbia Optical Level Switch Sales and Growth Rate (2019-2025) & (K Units)
Figure 54. Middle East and Africa Optical Level Switch Sales and Growth Rate (K Units)
Figure 55. Middle East and Africa Optical Level Switch Sales Market Share by Region in 2023
Figure 56. Saudi Arabia Optical Level Switch Sales and Growth Rate (2019-2025) & (K Units)
Figure 57. UAE Optical Level Switch Sales and Growth Rate (2019-2025) & (K Units)
Figure 58. Egypt Optical Level Switch Sales and Growth Rate (2019-2025) & (K Units)
Figure 59. Nigeria Optical Level Switch Sales and Growth Rate (2019-2025) & (K Units)
Figure 60. South Africa Optical Level Switch Sales and Growth Rate (2019-2025) & (K Units)
Figure 61. Global Optical Level Switch Sales Forecast by Volume (2026-2034) & (K Units)
Figure 62. Global Optical Level Switch Market Size Forecast by Value (2026-2034) & (M USD)
Figure 63. Global Optical Level Switch Sales Market Share Forecast by Type (2025-2030)
Figure 64. Global Optical Level Switch Market Share Forecast by Type (2025-2030)
Figure 65. Global Optical Level Switch Sales Forecast by Application (2025-2030)
Figure 66. Global Optical Level Switch Market Share Forecast by Application (2025-2030)