Non-residential Occupancy Sensors Market, Size, Trends, Business Strategies 2025-2032

Global Non-residential Occupancy Sensors market size was estimated at USD 1473 million in 2023 and is projected to reach USD 1739.01 million by 2030, exhibiting a CAGR of 2.40% during the forecast period.

PDF Icon Download Sample Report PDF
  • Quick Dispatch

    All Orders

  • Secure Payment

    100% Secure Payment

Compare

$1,500.00$4,250.00

Clear

Non-residential Occupancy Sensors Market Overview

Vacancy sensors, also known as occupancy sensors, are electronic devices designed to detect the presence or absence of people within a specific area or space. These sensors are commonly used in lighting and HVAC (heating, ventilation, and air conditioning) systems to automatically control the operation of lighting, fans, and other devices based on occupancy status.

This report provides a deep insight into the global Non-residential Occupancy Sensors Market covering all its essential aspects. This ranges from a macro overview of the market to micro details of the market size, competitive landscape, development trend, niche market, key market drivers and challenges, SWOT analysis, value chain analysis, etc.

The analysis helps the reader to shape the competition within the industries and strategies for the competitive environment to enhance the potential profit. Furthermore, it provides a simple framework for evaluating and accessing the position of the business organization. The report structure also focuses on the competitive landscape of the Global Non-residential Occupancy Sensors Market, this report introduces in detail the market share, market performance, product situation, operation situation, etc. of the main players, which helps the readers in the industry to identify the main competitors and deeply understand the competition pattern of the market.
In a word, this report is a must-read for industry players, investors, researchers, consultants, business strategists, and all those who have any kind of stake or are planning to foray into the Non-residential Occupancy Sensors Market in any manner.

Non-residential Occupancy Sensors Market Analysis:

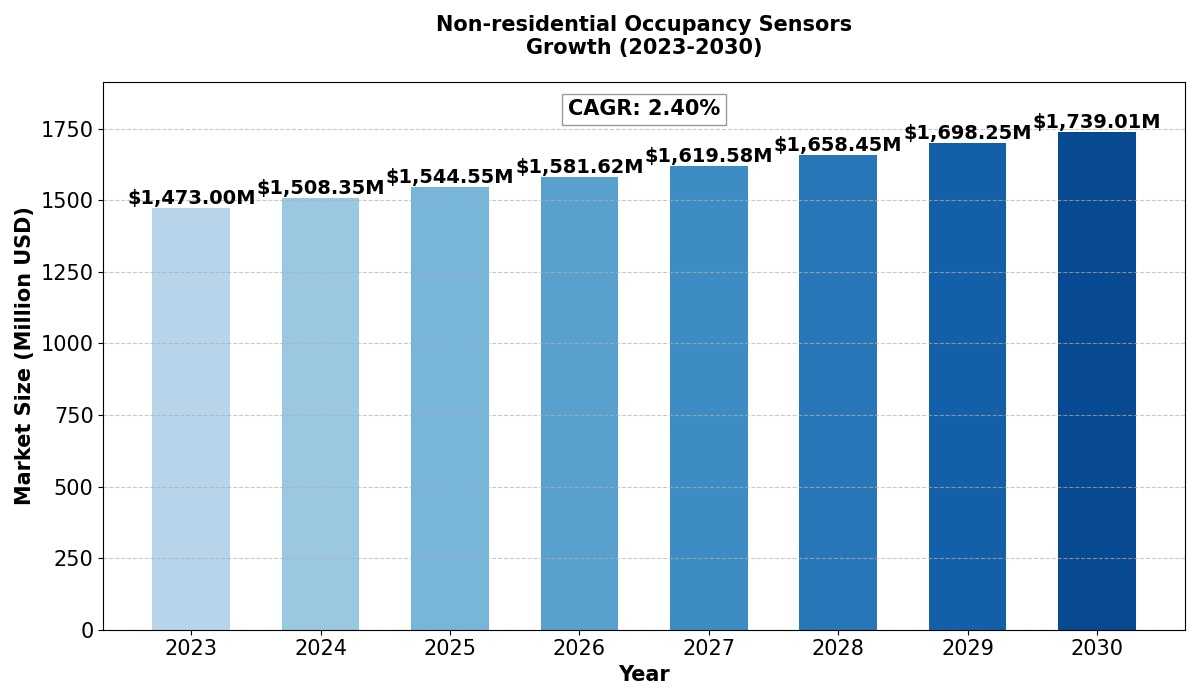
The global Non-residential Occupancy Sensors market size was estimated at USD 1473 million in 2023 and is projected to reach USD 1739.01 million by 2030, exhibiting a CAGR of 2.40% during the forecast period.

North America Non-residential Occupancy Sensors market size was USD 383.82 million in 2023, at a CAGR of 2.06% during the forecast period of 2025 through 2030.

Non-residential Occupancy Sensors Key Market Trends  :

  • Growing Demand for Energy Efficiency
    Rising awareness of energy conservation is driving the adoption of occupancy sensors in commercial buildings, reducing unnecessary power consumption in lighting and HVAC systems.

  • Integration with Smart Building Technologies
    The increasing deployment of IoT and AI-powered sensors in smart offices, hotels, and retail spaces is enhancing automation and operational efficiency.

  • Stricter Government Regulations on Energy Usage
    Regulatory frameworks promoting energy-efficient infrastructure are encouraging businesses to adopt occupancy sensors to comply with sustainability standards.

  • Rising Adoption in Commercial and Industrial Spaces
    Businesses are implementing occupancy sensors in offices, retail stores, and hospitality venues to optimize energy use and improve security.

  • Advancements in Sensor Technologies
    Innovations in PIR, ultrasonic, and dual-technology sensors are improving accuracy and reducing false triggers, enhancing reliability in diverse environments.

Non-residential Occupancy Sensors Market Regional Analysis :

semi insight

  • North America:Strong demand driven by EVs, 5G infrastructure, and renewable energy, with the U.S. leading the market.
  • Europe:Growth fueled by automotive electrification, renewable energy, and strong regulatory support, with Germany as a key player.
  • Asia-Pacific:Dominates the market due to large-scale manufacturing in China and Japan, with growing demand from EVs, 5G, and semiconductors.
  • South America:Emerging market, driven by renewable energy and EV adoption, with Brazil leading growth.
  • Middle East & Africa:Gradual growth, mainly due to investments in renewable energy and EV infrastructure, with Saudi Arabia and UAE as key contributors.

Non-residential Occupancy Sensors Market Segmentation :

The research report includes specific segments by region (country), manufacturers, Type, and Application. Market segmentation creates subsets of a market based on product type, end-user or application, Geographic, and other factors. By understanding the market segments, the decision-maker can leverage this targeting in the product, sales, and marketing strategies. Market segments can power your product development cycles by informing how you create product offerings for different segments.

Key Company

  • Signify
  • Schneider Electric
  • Honeywell
  • GE Current
  • Johnson Controls
  • Legrand
  • Crestron Electronics
  • Lutron Electronics
  • Acuity Brands
  • OPTEX
  • Leviton Manufacturing Co.
  • Inc
  • Enerlites
  • Hubbell

Market Segmentation (by Type)

  • PIR (Passive Infrared) Sensors
  • Ultrasonic Sensors
  • Dual-technology Occupancy Sensors
  • Others

Market Segmentation (by Application)

  • Office
  • Shop
  • Hospitality
  • Others

Drivers

  • Increased Focus on Energy Savings
    Companies are adopting occupancy sensors to cut energy costs by automatically controlling lighting and HVAC systems based on occupancy.

  • Advancements in Wireless and IoT-enabled Sensors
    Smart sensors with wireless connectivity and remote monitoring capabilities are gaining popularity in modern commercial buildings.

  • Growing Adoption of Green Building Initiatives
    Sustainability trends are encouraging the use of energy-efficient technologies, including occupancy sensors, to meet LEED and BREEAM certification standards.

Restraints

  • High Initial Installation Costs
    The cost of sensor implementation and integration with existing infrastructure can be a barrier for small businesses.

  • Technical Challenges in Large Commercial Spaces
    Some sensors struggle with accuracy in complex environments with partitions, high ceilings, or fluctuating occupancy levels.

  • Privacy Concerns and Data Security Issues
    As sensors collect occupancy data, concerns over personal privacy and cybersecurity risks may hinder widespread adoption.

Opportunities

  • Expansion of Smart Offices and Smart Cities
    Increasing investments in smart infrastructure present significant growth potential for occupancy sensor technology.

  • Development of AI-powered Sensors
    AI-driven analytics can enhance sensor accuracy, optimize building operations, and provide predictive maintenance insights.

  • Emerging Markets Adoption
    Growing commercial construction in Asia-Pacific and Latin America offers new opportunities for sensor manufacturers.

Challenges

  • Limited Retrofitting Compatibility
    Older buildings may require significant modifications to accommodate modern occupancy sensors, increasing costs and complexity.

  • Variability in Sensor Performance
    Environmental factors like temperature, humidity, and obstruction can impact sensor efficiency, requiring advanced calibration.

  • Market Competition and Price Pressures
    The presence of multiple sensor manufacturers is leading to pricing challenges, affecting profit margins for businesses.

Key Benefits of This Market Research:

  • Industry drivers, restraints, and opportunities covered in the study
  • Neutral perspective on the market performance
  • Recent industry trends and developments
  • Competitive landscape & strategies of key players
  • Potential & niche segments and regions exhibiting promising growth covered
  • Historical, current, and projected market size, in terms of value
  • In-depth analysis of the Non-residential Occupancy Sensors Market
  • Overview of the regional outlook of the Non-residential Occupancy Sensors Market:

Key Reasons to Buy this Report:

  • Access to date statistics compiled by our researchers. These provide you with historical and forecast data, which is analyzed to tell you why your market is set to change
  • This enables you to anticipate market changes to remain ahead of your competitors
  • You will be able to copy data from the Excel spreadsheet straight into your marketing plans, business presentations, or other strategic documents
  • The concise analysis, clear graph, and table format will enable you to pinpoint the information you require quickly
  • Provision of market value (USD Billion) data for each segment and sub-segment
  • Indicates the region and segment that is expected to witness the fastest growth as well as to dominate the market
  • Includes in-depth analysis of the market from various perspectives through Porters five forces analysis
  • Provides insight into the market through Value Chain
  • Market dynamics scenario, along with growth opportunities of the market in the years to come
  • 6-month post-sales analyst support

Customization of the Report
In case of any queries or customization requirements, please connect with our sales team, who will ensure that your requirements are met.

FAQs

What are the key driving factors and opportunities in the Non-residential Occupancy Sensors market?
The market is driven by increasing demand for energy efficiency, integration with smart buildings, and advancements in sensor technology. Opportunities exist in AI-powered sensors, smart city projects, and emerging markets.


Which region is projected to have the largest share?
North America is expected to lead the market due to strong regulatory support for energy efficiency and the widespread adoption of smart building solutions.


Who are the top players in the global Non-residential Occupancy Sensors market?
Leading companies include Signify, Schneider Electric, Honeywell, GE Current, Johnson Controls, Legrand, Crestron Electronics, and Lutron Electronics.


What are the latest technological advancements in the industry?
Recent innovations include AI-driven occupancy detection, wireless IoT-enabled sensors, and dual-technology solutions that enhance accuracy and reliability.


What is the current size of the global Non-residential Occupancy Sensors market?
The market was valued at USD 1473 million in 2023 and is projected to reach USD 1739.01 million by 2030, growing at a CAGR of 2.40% during the forecast period.

Non-residential Occupancy Sensors Market, Size, Trends, Business Strategies 2025-2032

Get Sample Report PDF for Exclusive Insights

Report Sample Includes

  • Table of Contents
  • List of Tables & Figures
  • Charts, Research Methodology, and more...
PDF Icon Download Sample Report PDF

Download Sample Report

Table of Content

Table of Contents
1 Research Methodology and Statistical Scope
1.1 Market Definition and Statistical Scope of Non-residential Occupancy Sensors
1.2 Key Market Segments
1.2.1 Non-residential Occupancy Sensors Segment by Type
1.2.2 Non-residential Occupancy Sensors Segment by Application
1.3 Methodology & Sources of Information
1.3.1 Research Methodology
1.3.2 Research Process
1.3.3 Market Breakdown and Data Triangulation
1.3.4 Base Year
1.3.5 Report Assumptions & Caveats
2 Non-residential Occupancy Sensors Market Overview
2.1 Global Market Overview
2.1.1 Global Non-residential Occupancy Sensors Market Size (M USD) Estimates and Forecasts (2019-2030)
2.1.2 Global Non-residential Occupancy Sensors Sales Estimates and Forecasts (2019-2030)
2.2 Market Segment Executive Summary
2.3 Global Market Size by Region
3 Non-residential Occupancy Sensors Market Competitive Landscape
3.1 Global Non-residential Occupancy Sensors Sales by Manufacturers (2019-2025)
3.2 Global Non-residential Occupancy Sensors Revenue Market Share by Manufacturers (2019-2025)
3.3 Non-residential Occupancy Sensors Market Share by Company Type (Tier 1, Tier 2, and Tier 3)
3.4 Global Non-residential Occupancy Sensors Average Price by Manufacturers (2019-2025)
3.5 Manufacturers Non-residential Occupancy Sensors Sales Sites, Area Served, Product Type
3.6 Non-residential Occupancy Sensors Market Competitive Situation and Trends
3.6.1 Non-residential Occupancy Sensors Market Concentration Rate
3.6.2 Global 5 and 10 Largest Non-residential Occupancy Sensors Players Market Share by Revenue
3.6.3 Mergers & Acquisitions, Expansion
4 Non-residential Occupancy Sensors Industry Chain Analysis
4.1 Non-residential Occupancy Sensors Industry Chain Analysis
4.2 Market Overview of Key Raw Materials
4.3 Midstream Market Analysis
4.4 Downstream Customer Analysis
5 The Development and Dynamics of Non-residential Occupancy Sensors Market
5.1 Key Development Trends
5.2 Driving Factors
5.3 Market Challenges
5.4 Market Restraints
5.5 Industry News
5.5.1 New Product Developments
5.5.2 Mergers & Acquisitions
5.5.3 Expansions
5.5.4 Collaboration/Supply Contracts
5.6 Industry Policies
6 Non-residential Occupancy Sensors Market Segmentation by Type
6.1 Evaluation Matrix of Segment Market Development Potential (Type)
6.2 Global Non-residential Occupancy Sensors Sales Market Share by Type (2019-2025)
6.3 Global Non-residential Occupancy Sensors Market Size Market Share by Type (2019-2025)
6.4 Global Non-residential Occupancy Sensors Price by Type (2019-2025)
7 Non-residential Occupancy Sensors Market Segmentation by Application
7.1 Evaluation Matrix of Segment Market Development Potential (Application)
7.2 Global Non-residential Occupancy Sensors Market Sales by Application (2019-2025)
7.3 Global Non-residential Occupancy Sensors Market Size (M USD) by Application (2019-2025)
7.4 Global Non-residential Occupancy Sensors Sales Growth Rate by Application (2019-2025)
8 Non-residential Occupancy Sensors Market Segmentation by Region
8.1 Global Non-residential Occupancy Sensors Sales by Region
8.1.1 Global Non-residential Occupancy Sensors Sales by Region
8.1.2 Global Non-residential Occupancy Sensors Sales Market Share by Region
8.2 North America
8.2.1 North America Non-residential Occupancy Sensors Sales by Country
8.2.2 U.S.
8.2.3 Canada
8.2.4 Mexico
8.3 Europe
8.3.1 Europe Non-residential Occupancy Sensors Sales by Country
8.3.2 Germany
8.3.3 France
8.3.4 U.K.
8.3.5 Italy
8.3.6 Russia
8.4 Asia Pacific
8.4.1 Asia Pacific Non-residential Occupancy Sensors Sales by Region
8.4.2 China
8.4.3 Japan
8.4.4 South Korea
8.4.5 India
8.4.6 Southeast Asia
8.5 South America
8.5.1 South America Non-residential Occupancy Sensors Sales by Country
8.5.2 Brazil
8.5.3 Argentina
8.5.4 Columbia
8.6 Middle East and Africa
8.6.1 Middle East and Africa Non-residential Occupancy Sensors Sales by Region
8.6.2 Saudi Arabia
8.6.3 UAE
8.6.4 Egypt
8.6.5 Nigeria
8.6.6 South Africa
9 Key Companies Profile
9.1 Signify
9.1.1 Signify Non-residential Occupancy Sensors Basic Information
9.1.2 Signify Non-residential Occupancy Sensors Product Overview
9.1.3 Signify Non-residential Occupancy Sensors Product Market Performance
9.1.4 Signify Business Overview
9.1.5 Signify Non-residential Occupancy Sensors SWOT Analysis
9.1.6 Signify Recent Developments
9.2 Schneider Electric
9.2.1 Schneider Electric Non-residential Occupancy Sensors Basic Information
9.2.2 Schneider Electric Non-residential Occupancy Sensors Product Overview
9.2.3 Schneider Electric Non-residential Occupancy Sensors Product Market Performance
9.2.4 Schneider Electric Business Overview
9.2.5 Schneider Electric Non-residential Occupancy Sensors SWOT Analysis
9.2.6 Schneider Electric Recent Developments
9.3 Honeywell
9.3.1 Honeywell Non-residential Occupancy Sensors Basic Information
9.3.2 Honeywell Non-residential Occupancy Sensors Product Overview
9.3.3 Honeywell Non-residential Occupancy Sensors Product Market Performance
9.3.4 Honeywell Non-residential Occupancy Sensors SWOT Analysis
9.3.5 Honeywell Business Overview
9.3.6 Honeywell Recent Developments
9.4 GE Current
9.4.1 GE Current Non-residential Occupancy Sensors Basic Information
9.4.2 GE Current Non-residential Occupancy Sensors Product Overview
9.4.3 GE Current Non-residential Occupancy Sensors Product Market Performance
9.4.4 GE Current Business Overview
9.4.5 GE Current Recent Developments
9.5 Johnson Controls
9.5.1 Johnson Controls Non-residential Occupancy Sensors Basic Information
9.5.2 Johnson Controls Non-residential Occupancy Sensors Product Overview
9.5.3 Johnson Controls Non-residential Occupancy Sensors Product Market Performance
9.5.4 Johnson Controls Business Overview
9.5.5 Johnson Controls Recent Developments
9.6 Legrand
9.6.1 Legrand Non-residential Occupancy Sensors Basic Information
9.6.2 Legrand Non-residential Occupancy Sensors Product Overview
9.6.3 Legrand Non-residential Occupancy Sensors Product Market Performance
9.6.4 Legrand Business Overview
9.6.5 Legrand Recent Developments
9.7 Crestron Electronics
9.7.1 Crestron Electronics Non-residential Occupancy Sensors Basic Information
9.7.2 Crestron Electronics Non-residential Occupancy Sensors Product Overview
9.7.3 Crestron Electronics Non-residential Occupancy Sensors Product Market Performance
9.7.4 Crestron Electronics Business Overview
9.7.5 Crestron Electronics Recent Developments
9.8 Lutron Electronics
9.8.1 Lutron Electronics Non-residential Occupancy Sensors Basic Information
9.8.2 Lutron Electronics Non-residential Occupancy Sensors Product Overview
9.8.3 Lutron Electronics Non-residential Occupancy Sensors Product Market Performance
9.8.4 Lutron Electronics Business Overview
9.8.5 Lutron Electronics Recent Developments
9.9 Acuity Brands
9.9.1 Acuity Brands Non-residential Occupancy Sensors Basic Information
9.9.2 Acuity Brands Non-residential Occupancy Sensors Product Overview
9.9.3 Acuity Brands Non-residential Occupancy Sensors Product Market Performance
9.9.4 Acuity Brands Business Overview
9.9.5 Acuity Brands Recent Developments
9.10 OPTEX
9.10.1 OPTEX Non-residential Occupancy Sensors Basic Information
9.10.2 OPTEX Non-residential Occupancy Sensors Product Overview
9.10.3 OPTEX Non-residential Occupancy Sensors Product Market Performance
9.10.4 OPTEX Business Overview
9.10.5 OPTEX Recent Developments
9.11 Leviton Manufacturing Co.
9.11.1 Leviton Manufacturing Co. Non-residential Occupancy Sensors Basic Information
9.11.2 Leviton Manufacturing Co. Non-residential Occupancy Sensors Product Overview
9.11.3 Leviton Manufacturing Co. Non-residential Occupancy Sensors Product Market Performance
9.11.4 Leviton Manufacturing Co. Business Overview
9.11.5 Leviton Manufacturing Co. Recent Developments
9.12 Inc
9.12.1 Inc Non-residential Occupancy Sensors Basic Information
9.12.2 Inc Non-residential Occupancy Sensors Product Overview
9.12.3 Inc Non-residential Occupancy Sensors Product Market Performance
9.12.4 Inc Business Overview
9.12.5 Inc Recent Developments
9.13 Enerlites
9.13.1 Enerlites Non-residential Occupancy Sensors Basic Information
9.13.2 Enerlites Non-residential Occupancy Sensors Product Overview
9.13.3 Enerlites Non-residential Occupancy Sensors Product Market Performance
9.13.4 Enerlites Business Overview
9.13.5 Enerlites Recent Developments
9.14 Hubbell
9.14.1 Hubbell Non-residential Occupancy Sensors Basic Information
9.14.2 Hubbell Non-residential Occupancy Sensors Product Overview
9.14.3 Hubbell Non-residential Occupancy Sensors Product Market Performance
9.14.4 Hubbell Business Overview
9.14.5 Hubbell Recent Developments
10 Non-residential Occupancy Sensors Market Forecast by Region
10.1 Global Non-residential Occupancy Sensors Market Size Forecast
10.2 Global Non-residential Occupancy Sensors Market Forecast by Region
10.2.1 North America Market Size Forecast by Country
10.2.2 Europe Non-residential Occupancy Sensors Market Size Forecast by Country
10.2.3 Asia Pacific Non-residential Occupancy Sensors Market Size Forecast by Region
10.2.4 South America Non-residential Occupancy Sensors Market Size Forecast by Country
10.2.5 Middle East and Africa Forecasted Consumption of Non-residential Occupancy Sensors by Country
11 Forecast Market by Type and by Application (2025-2030)
11.1 Global Non-residential Occupancy Sensors Market Forecast by Type (2025-2030)
11.1.1 Global Forecasted Sales of Non-residential Occupancy Sensors by Type (2025-2030)
11.1.2 Global Non-residential Occupancy Sensors Market Size Forecast by Type (2025-2030)
11.1.3 Global Forecasted Price of Non-residential Occupancy Sensors by Type (2025-2030)
11.2 Global Non-residential Occupancy Sensors Market Forecast by Application (2025-2030)
11.2.1 Global Non-residential Occupancy Sensors Sales (K Units) Forecast by Application
11.2.2 Global Non-residential Occupancy Sensors Market Size (M USD) Forecast by Application (2025-2030)
12 Conclusion and Key FindingsList of Tables
Table 1. Introduction of the Type
Table 2. Introduction of the Application
Table 3. Market Size (M USD) Segment Executive Summary
Table 4. Non-residential Occupancy Sensors Market Size Comparison by Region (M USD)
Table 5. Global Non-residential Occupancy Sensors Sales (K Units) by Manufacturers (2019-2025)
Table 6. Global Non-residential Occupancy Sensors Sales Market Share by Manufacturers (2019-2025)
Table 7. Global Non-residential Occupancy Sensors Revenue (M USD) by Manufacturers (2019-2025)
Table 8. Global Non-residential Occupancy Sensors Revenue Share by Manufacturers (2019-2025)
Table 9. Company Type (Tier 1, Tier 2, and Tier 3) & (based on the Revenue in Non-residential Occupancy Sensors as of 2022)
Table 10. Global Market Non-residential Occupancy Sensors Average Price (USD/Unit) of Key Manufacturers (2019-2025)
Table 11. Manufacturers Non-residential Occupancy Sensors Sales Sites and Area Served
Table 12. Manufacturers Non-residential Occupancy Sensors Product Type
Table 13. Global Non-residential Occupancy Sensors Manufacturers Market Concentration Ratio (CR5 and HHI)
Table 14. Mergers & Acquisitions, Expansion Plans
Table 15. Industry Chain Map of Non-residential Occupancy Sensors
Table 16. Market Overview of Key Raw Materials
Table 17. Midstream Market Analysis
Table 18. Downstream Customer Analysis
Table 19. Key Development Trends
Table 20. Driving Factors
Table 21. Non-residential Occupancy Sensors Market Challenges
Table 22. Global Non-residential Occupancy Sensors Sales by Type (K Units)
Table 23. Global Non-residential Occupancy Sensors Market Size by Type (M USD)
Table 24. Global Non-residential Occupancy Sensors Sales (K Units) by Type (2019-2025)
Table 25. Global Non-residential Occupancy Sensors Sales Market Share by Type (2019-2025)
Table 26. Global Non-residential Occupancy Sensors Market Size (M USD) by Type (2019-2025)
Table 27. Global Non-residential Occupancy Sensors Market Size Share by Type (2019-2025)
Table 28. Global Non-residential Occupancy Sensors Price (USD/Unit) by Type (2019-2025)
Table 29. Global Non-residential Occupancy Sensors Sales (K Units) by Application
Table 30. Global Non-residential Occupancy Sensors Market Size by Application
Table 31. Global Non-residential Occupancy Sensors Sales by Application (2019-2025) & (K Units)
Table 32. Global Non-residential Occupancy Sensors Sales Market Share by Application (2019-2025)
Table 33. Global Non-residential Occupancy Sensors Sales by Application (2019-2025) & (M USD)
Table 34. Global Non-residential Occupancy Sensors Market Share by Application (2019-2025)
Table 35. Global Non-residential Occupancy Sensors Sales Growth Rate by Application (2019-2025)
Table 36. Global Non-residential Occupancy Sensors Sales by Region (2019-2025) & (K Units)
Table 37. Global Non-residential Occupancy Sensors Sales Market Share by Region (2019-2025)
Table 38. North America Non-residential Occupancy Sensors Sales by Country (2019-2025) & (K Units)
Table 39. Europe Non-residential Occupancy Sensors Sales by Country (2019-2025) & (K Units)
Table 40. Asia Pacific Non-residential Occupancy Sensors Sales by Region (2019-2025) & (K Units)
Table 41. South America Non-residential Occupancy Sensors Sales by Country (2019-2025) & (K Units)
Table 42. Middle East and Africa Non-residential Occupancy Sensors Sales by Region (2019-2025) & (K Units)
Table 43. Signify Non-residential Occupancy Sensors Basic Information
Table 44. Signify Non-residential Occupancy Sensors Product Overview
Table 45. Signify Non-residential Occupancy Sensors Sales (K Units), Revenue (M USD), Price (USD/Unit) and Gross Margin (2019-2025)
Table 46. Signify Business Overview
Table 47. Signify Non-residential Occupancy Sensors SWOT Analysis
Table 48. Signify Recent Developments
Table 49. Schneider Electric Non-residential Occupancy Sensors Basic Information
Table 50. Schneider Electric Non-residential Occupancy Sensors Product Overview
Table 51. Schneider Electric Non-residential Occupancy Sensors Sales (K Units), Revenue (M USD), Price (USD/Unit) and Gross Margin (2019-2025)
Table 52. Schneider Electric Business Overview
Table 53. Schneider Electric Non-residential Occupancy Sensors SWOT Analysis
Table 54. Schneider Electric Recent Developments
Table 55. Honeywell Non-residential Occupancy Sensors Basic Information
Table 56. Honeywell Non-residential Occupancy Sensors Product Overview
Table 57. Honeywell Non-residential Occupancy Sensors Sales (K Units), Revenue (M USD), Price (USD/Unit) and Gross Margin (2019-2025)
Table 58. Honeywell Non-residential Occupancy Sensors SWOT Analysis
Table 59. Honeywell Business Overview
Table 60. Honeywell Recent Developments
Table 61. GE Current Non-residential Occupancy Sensors Basic Information
Table 62. GE Current Non-residential Occupancy Sensors Product Overview
Table 63. GE Current Non-residential Occupancy Sensors Sales (K Units), Revenue (M USD), Price (USD/Unit) and Gross Margin (2019-2025)
Table 64. GE Current Business Overview
Table 65. GE Current Recent Developments
Table 66. Johnson Controls Non-residential Occupancy Sensors Basic Information
Table 67. Johnson Controls Non-residential Occupancy Sensors Product Overview
Table 68. Johnson Controls Non-residential Occupancy Sensors Sales (K Units), Revenue (M USD), Price (USD/Unit) and Gross Margin (2019-2025)
Table 69. Johnson Controls Business Overview
Table 70. Johnson Controls Recent Developments
Table 71. Legrand Non-residential Occupancy Sensors Basic Information
Table 72. Legrand Non-residential Occupancy Sensors Product Overview
Table 73. Legrand Non-residential Occupancy Sensors Sales (K Units), Revenue (M USD), Price (USD/Unit) and Gross Margin (2019-2025)
Table 74. Legrand Business Overview
Table 75. Legrand Recent Developments
Table 76. Crestron Electronics Non-residential Occupancy Sensors Basic Information
Table 77. Crestron Electronics Non-residential Occupancy Sensors Product Overview
Table 78. Crestron Electronics Non-residential Occupancy Sensors Sales (K Units), Revenue (M USD), Price (USD/Unit) and Gross Margin (2019-2025)
Table 79. Crestron Electronics Business Overview
Table 80. Crestron Electronics Recent Developments
Table 81. Lutron Electronics Non-residential Occupancy Sensors Basic Information
Table 82. Lutron Electronics Non-residential Occupancy Sensors Product Overview
Table 83. Lutron Electronics Non-residential Occupancy Sensors Sales (K Units), Revenue (M USD), Price (USD/Unit) and Gross Margin (2019-2025)
Table 84. Lutron Electronics Business Overview
Table 85. Lutron Electronics Recent Developments
Table 86. Acuity Brands Non-residential Occupancy Sensors Basic Information
Table 87. Acuity Brands Non-residential Occupancy Sensors Product Overview
Table 88. Acuity Brands Non-residential Occupancy Sensors Sales (K Units), Revenue (M USD), Price (USD/Unit) and Gross Margin (2019-2025)
Table 89. Acuity Brands Business Overview
Table 90. Acuity Brands Recent Developments
Table 91. OPTEX Non-residential Occupancy Sensors Basic Information
Table 92. OPTEX Non-residential Occupancy Sensors Product Overview
Table 93. OPTEX Non-residential Occupancy Sensors Sales (K Units), Revenue (M USD), Price (USD/Unit) and Gross Margin (2019-2025)
Table 94. OPTEX Business Overview
Table 95. OPTEX Recent Developments
Table 96. Leviton Manufacturing Co. Non-residential Occupancy Sensors Basic Information
Table 97. Leviton Manufacturing Co. Non-residential Occupancy Sensors Product Overview
Table 98. Leviton Manufacturing Co. Non-residential Occupancy Sensors Sales (K Units), Revenue (M USD), Price (USD/Unit) and Gross Margin (2019-2025)
Table 99. Leviton Manufacturing Co. Business Overview
Table 100. Leviton Manufacturing Co. Recent Developments
Table 101. Inc Non-residential Occupancy Sensors Basic Information
Table 102. Inc Non-residential Occupancy Sensors Product Overview
Table 103. Inc Non-residential Occupancy Sensors Sales (K Units), Revenue (M USD), Price (USD/Unit) and Gross Margin (2019-2025)
Table 104. Inc Business Overview
Table 105. Inc Recent Developments
Table 106. Enerlites Non-residential Occupancy Sensors Basic Information
Table 107. Enerlites Non-residential Occupancy Sensors Product Overview
Table 108. Enerlites Non-residential Occupancy Sensors Sales (K Units), Revenue (M USD), Price (USD/Unit) and Gross Margin (2019-2025)
Table 109. Enerlites Business Overview
Table 110. Enerlites Recent Developments
Table 111. Hubbell Non-residential Occupancy Sensors Basic Information
Table 112. Hubbell Non-residential Occupancy Sensors Product Overview
Table 113. Hubbell Non-residential Occupancy Sensors Sales (K Units), Revenue (M USD), Price (USD/Unit) and Gross Margin (2019-2025)
Table 114. Hubbell Business Overview
Table 115. Hubbell Recent Developments
Table 116. Global Non-residential Occupancy Sensors Sales Forecast by Region (2025-2030) & (K Units)
Table 117. Global Non-residential Occupancy Sensors Market Size Forecast by Region (2025-2030) & (M USD)
Table 118. North America Non-residential Occupancy Sensors Sales Forecast by Country (2025-2030) & (K Units)
Table 119. North America Non-residential Occupancy Sensors Market Size Forecast by Country (2025-2030) & (M USD)
Table 120. Europe Non-residential Occupancy Sensors Sales Forecast by Country (2025-2030) & (K Units)
Table 121. Europe Non-residential Occupancy Sensors Market Size Forecast by Country (2025-2030) & (M USD)
Table 122. Asia Pacific Non-residential Occupancy Sensors Sales Forecast by Region (2025-2030) & (K Units)
Table 123. Asia Pacific Non-residential Occupancy Sensors Market Size Forecast by Region (2025-2030) & (M USD)
Table 124. South America Non-residential Occupancy Sensors Sales Forecast by Country (2025-2030) & (K Units)
Table 125. South America Non-residential Occupancy Sensors Market Size Forecast by Country (2025-2030) & (M USD)
Table 126. Middle East and Africa Non-residential Occupancy Sensors Consumption Forecast by Country (2025-2030) & (Units)
Table 127. Middle East and Africa Non-residential Occupancy Sensors Market Size Forecast by Country (2025-2030) & (M USD)
Table 128. Global Non-residential Occupancy Sensors Sales Forecast by Type (2025-2030) & (K Units)
Table 129. Global Non-residential Occupancy Sensors Market Size Forecast by Type (2025-2030) & (M USD)
Table 130. Global Non-residential Occupancy Sensors Price Forecast by Type (2025-2030) & (USD/Unit)
Table 131. Global Non-residential Occupancy Sensors Sales (K Units) Forecast by Application (2025-2030)
Table 132. Global Non-residential Occupancy Sensors Market Size Forecast by Application (2025-2030) & (M USD)
List of Figures
Figure 1. Product Picture of Non-residential Occupancy Sensors
Figure 2. Data Triangulation
Figure 3. Key Caveats
Figure 4. Global Non-residential Occupancy Sensors Market Size (M USD), 2019-2030
Figure 5. Global Non-residential Occupancy Sensors Market Size (M USD) (2019-2030)
Figure 6. Global Non-residential Occupancy Sensors Sales (K Units) & (2019-2030)
Figure 7. Evaluation Matrix of Segment Market Development Potential (Type)
Figure 8. Evaluation Matrix of Segment Market Development Potential (Application)
Figure 9. Evaluation Matrix of Regional Market Development Potential
Figure 10. Non-residential Occupancy Sensors Market Size by Country (M USD)
Figure 11. Non-residential Occupancy Sensors Sales Share by Manufacturers in 2023
Figure 12. Global Non-residential Occupancy Sensors Revenue Share by Manufacturers in 2023
Figure 13. Non-residential Occupancy Sensors Market Share by Company Type (Tier 1, Tier 2 and Tier 3): 2023
Figure 14. Global Market Non-residential Occupancy Sensors Average Price (USD/Unit) of Key Manufacturers in 2023
Figure 15. The Global 5 and 10 Largest Players: Market Share by Non-residential Occupancy Sensors Revenue in 2023
Figure 16. Evaluation Matrix of Segment Market Development Potential (Type)
Figure 17. Global Non-residential Occupancy Sensors Market Share by Type
Figure 18. Sales Market Share of Non-residential Occupancy Sensors by Type (2019-2025)
Figure 19. Sales Market Share of Non-residential Occupancy Sensors by Type in 2023
Figure 20. Market Size Share of Non-residential Occupancy Sensors by Type (2019-2025)
Figure 21. Market Size Market Share of Non-residential Occupancy Sensors by Type in 2023
Figure 22. Evaluation Matrix of Segment Market Development Potential (Application)
Figure 23. Global Non-residential Occupancy Sensors Market Share by Application
Figure 24. Global Non-residential Occupancy Sensors Sales Market Share by Application (2019-2025)
Figure 25. Global Non-residential Occupancy Sensors Sales Market Share by Application in 2023
Figure 26. Global Non-residential Occupancy Sensors Market Share by Application (2019-2025)
Figure 27. Global Non-residential Occupancy Sensors Market Share by Application in 2023
Figure 28. Global Non-residential Occupancy Sensors Sales Growth Rate by Application (2019-2025)
Figure 29. Global Non-residential Occupancy Sensors Sales Market Share by Region (2019-2025)
Figure 30. North America Non-residential Occupancy Sensors Sales and Growth Rate (2019-2025) & (K Units)
Figure 31. North America Non-residential Occupancy Sensors Sales Market Share by Country in 2023
Figure 32. U.S. Non-residential Occupancy Sensors Sales and Growth Rate (2019-2025) & (K Units)
Figure 33. Canada Non-residential Occupancy Sensors Sales (K Units) and Growth Rate (2019-2025)
Figure 34. Mexico Non-residential Occupancy Sensors Sales (Units) and Growth Rate (2019-2025)
Figure 35. Europe Non-residential Occupancy Sensors Sales and Growth Rate (2019-2025) & (K Units)
Figure 36. Europe Non-residential Occupancy Sensors Sales Market Share by Country in 2023
Figure 37. Germany Non-residential Occupancy Sensors Sales and Growth Rate (2019-2025) & (K Units)
Figure 38. France Non-residential Occupancy Sensors Sales and Growth Rate (2019-2025) & (K Units)
Figure 39. U.K. Non-residential Occupancy Sensors Sales and Growth Rate (2019-2025) & (K Units)
Figure 40. Italy Non-residential Occupancy Sensors Sales and Growth Rate (2019-2025) & (K Units)
Figure 41. Russia Non-residential Occupancy Sensors Sales and Growth Rate (2019-2025) & (K Units)
Figure 42. Asia Pacific Non-residential Occupancy Sensors Sales and Growth Rate (K Units)
Figure 43. Asia Pacific Non-residential Occupancy Sensors Sales Market Share by Region in 2023
Figure 44. China Non-residential Occupancy Sensors Sales and Growth Rate (2019-2025) & (K Units)
Figure 45. Japan Non-residential Occupancy Sensors Sales and Growth Rate (2019-2025) & (K Units)
Figure 46. South Korea Non-residential Occupancy Sensors Sales and Growth Rate (2019-2025) & (K Units)
Figure 47. India Non-residential Occupancy Sensors Sales and Growth Rate (2019-2025) & (K Units)
Figure 48. Southeast Asia Non-residential Occupancy Sensors Sales and Growth Rate (2019-2025) & (K Units)
Figure 49. South America Non-residential Occupancy Sensors Sales and Growth Rate (K Units)
Figure 50. South America Non-residential Occupancy Sensors Sales Market Share by Country in 2023
Figure 51. Brazil Non-residential Occupancy Sensors Sales and Growth Rate (2019-2025) & (K Units)
Figure 52. Argentina Non-residential Occupancy Sensors Sales and Growth Rate (2019-2025) & (K Units)
Figure 53. Columbia Non-residential Occupancy Sensors Sales and Growth Rate (2019-2025) & (K Units)
Figure 54. Middle East and Africa Non-residential Occupancy Sensors Sales and Growth Rate (K Units)
Figure 55. Middle East and Africa Non-residential Occupancy Sensors Sales Market Share by Region in 2023
Figure 56. Saudi Arabia Non-residential Occupancy Sensors Sales and Growth Rate (2019-2025) & (K Units)
Figure 57. UAE Non-residential Occupancy Sensors Sales and Growth Rate (2019-2025) & (K Units)
Figure 58. Egypt Non-residential Occupancy Sensors Sales and Growth Rate (2019-2025) & (K Units)
Figure 59. Nigeria Non-residential Occupancy Sensors Sales and Growth Rate (2019-2025) & (K Units)
Figure 60. South Africa Non-residential Occupancy Sensors Sales and Growth Rate (2019-2025) & (K Units)
Figure 61. Global Non-residential Occupancy Sensors Sales Forecast by Volume (2019-2030) & (K Units)
Figure 62. Global Non-residential Occupancy Sensors Market Size Forecast by Value (2019-2030) & (M USD)
Figure 63. Global Non-residential Occupancy Sensors Sales Market Share Forecast by Type (2025-2030)
Figure 64. Global Non-residential Occupancy Sensors Market Share Forecast by Type (2025-2030)
Figure 65. Global Non-residential Occupancy Sensors Sales Forecast by Application (2025-2030)
Figure 66. Global Non-residential Occupancy Sensors Market Share Forecast by Application (2025-2030)