Nano-magnetic Devices Market Overview
The nano-magnetic devices are useful in these scenarios as they can reduce size of electronics considerably and also increase its efficiency. These devices also helps in reduction of size and increase in product longevity. Nano-magnetic devices have multiple advantages like low static power dissipation, high density, robustness towards thermal noise room temperature operation, and radiation hardened nature. Radiation-resistant is another feature of nano-magnetic devices.
This report provides a deep insight into the global Nano-magnetic Devices market covering all its essential aspects. This ranges from a macro overview of the market to micro details of the market size, competitive landscape, development trend, niche market, key market drivers and challenges, SWOT analysis, value chain analysis, etc.
The analysis helps the reader to shape the competition within the industries and strategies for the competitive environment to enhance the potential profit. Furthermore, it provides a simple framework for evaluating and accessing the position of the business organization. The report structure also focuses on the competitive landscape of the Global Nano-magnetic Devices Market, this report introduces in detail the market share, market performance, product situation, operation situation, etc. of the main players, which helps the readers in the industry to identify the main competitors and deeply understand the competition pattern of the market.
In a word, this report is a must-read for industry players, investors, researchers, consultants, business strategists, and all those who have any kind of stake or are planning to foray into the Nano-magnetic Devices market in any manner.
Nano-magnetic Devices Market Analysis:
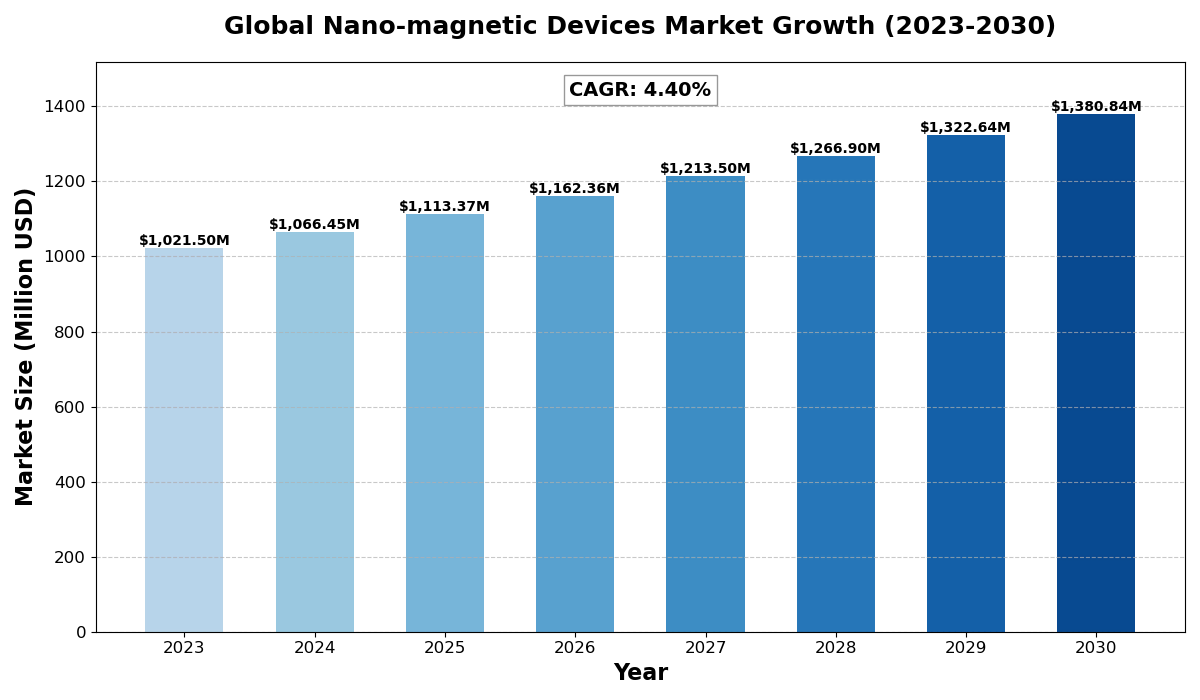
The global Nano-magnetic Devices Market size was estimated at USD 1021.50 million in 2023 and is projected to reach USD 1380.84 million by 2030, exhibiting a CAGR of 4.40% during the forecast period.
North America Nano-magnetic Devices market size was USD 266.17 million in 2023, at a CAGR of 3.77% during the forecast period of 2025 through 2030.
Nano-magnetic Devices Key Market Trends :
- Growing Demand for Miniaturization: The increasing need for compact and efficient electronic devices is driving the adoption of nano-magnetic technologies.
- Advancements in Quantum Computing: Nano-magnetic devices are playing a crucial role in quantum computing developments, enhancing storage and processing capabilities.
- Rise in Healthcare Applications: These devices are being integrated into medical imaging and diagnostics, leading to better patient care and early disease detection.
- Increased Investment in R&D: Major companies and governments are heavily investing in research to enhance nano-magnetic device performance and efficiency.
- Sustainability and Energy Efficiency: Growing environmental concerns are pushing manufacturers toward energy-efficient and sustainable nano-magnetic solutions.
Nano-magnetic Devices Market Regional Analysis :

-
North America:
Strong demand driven by EVs, 5G infrastructure, and renewable energy, with the U.S. leading the market.
-
Europe:
Growth fueled by automotive electrification, renewable energy, and strong regulatory support, with Germany as a key player.
-
Asia-Pacific:
Dominates the market due to large-scale manufacturing in China and Japan, with growing demand from EVs, 5G, and semiconductors.
-
South America:
Emerging market, driven by renewable energy and EV adoption, with Brazil leading growth.
-
Middle East & Africa:
Gradual growth, mainly due to investments in renewable energy and EV infrastructure, with Saudi Arabia and UAE as key contributors.
Nano-magnetic Devices Market Segmentation :
The research report includes specific segments by region (country), manufacturers, Type, and Application. Market segmentation creates subsets of a market based on product type, end-user or application, Geographic, and other factors. By understanding the market segments, the decision-maker can leverage this targeting in the product, sales, and marketing strategies. Market segments can power your product development cycles by informing how you create product offerings for different segments.
Key Company
- IBM
- Intel
- Samsung Electronics
- LG Electronics
- Fujitsu
- Microsoft
Market Segmentation (by Type)
- Sensors
- Separation
- Data Storage
- Imaging
- Others
Market Segmentation (by Application)
- Electronics & IT
- Medical & Healthcare
- Energy
- Environment
Drivers
- Growing Electronics Industry: The rapid expansion of consumer electronics, IT, and telecommunications industries is fueling the demand for nano-magnetic devices.
- High Data Storage Demand: Rising need for high-capacity data storage in data centers and cloud computing is boosting the adoption of nano-magnetic memory technologies.
- Increased Application in Medical Devices: The growing usage of nano-magnetic devices in medical imaging, diagnostics, and targeted drug delivery is driving market growth.
Restraints
- High Manufacturing Costs: The complex fabrication processes and high initial costs may hinder market expansion, especially for small manufacturers.
- Technical Challenges: Issues like thermal stability and magnetic interference can limit the efficiency of nano-magnetic devices.
- Regulatory Concerns: Strict government regulations regarding nano-materials and radiation exposure may pose challenges to market growth.
Opportunities
- Expansion in Renewable Energy Sector: Nano-magnetic devices are increasingly used in renewable energy applications, such as energy harvesting and storage solutions.
- Emerging Markets Growth: Developing countries in Asia-Pacific and Latin America present untapped opportunities due to rising industrialization and technology adoption.
- Advancements in AI and IoT: The integration of nano-magnetic technology with AI and IoT is opening new avenues in smart devices and autonomous systems.
Challenges
- Complex Manufacturing Process: The intricate nature of nano-magnetic device fabrication requires specialized expertise, posing a challenge for mass production.
- Short Product Lifecycle: Rapid technological advancements may lead to shorter product lifecycles, increasing R&D costs.
- Supply Chain Disruptions: Dependency on rare earth materials and geopolitical tensions may create supply chain constraints for manufacturers.
Key Benefits of This Market Research:
- Industry drivers, restraints, and opportunities covered in the study
- Neutral perspective on the market performance
- Recent industry trends and developments
- Competitive landscape & strategies of key players
- Potential & niche segments and regions exhibiting promising growth covered
- Historical, current, and projected market size, in terms of value
- In-depth analysis of the Nano-magnetic Devices Market
- Overview of the regional outlook of the Nano-magnetic Devices Market:
Key Reasons to Buy this Report:
- Access to date statistics compiled by our researchers. These provide you with historical and forecast data, which is analyzed to tell you why your market is set to change
- This enables you to anticipate market changes to remain ahead of your competitors
- You will be able to copy data from the Excel spreadsheet straight into your marketing plans, business presentations, or other strategic documents
- The concise analysis, clear graph, and table format will enable you to pinpoint the information you require quickly
- Provision of market value (USD Billion) data for each segment and sub-segment
- Indicates the region and segment that is expected to witness the fastest growth as well as to dominate the market
- Includes in-depth analysis of the market from various perspectives through Porters five forces analysis
- Provides insight into the market through Value Chain
- Market dynamics scenario, along with growth opportunities of the market in the years to come
- 6-month post-sales analyst support
Customization of the Report
In case of any queries or customization requirements, please connect with our sales team, who will ensure that your requirements are met.
FAQs
Q: What are the key driving factors and opportunities in the Nano-magnetic Devices market?
A: The main drivers include the growing electronics industry, high demand for data storage, and increasing medical applications. Opportunities lie in renewable energy, emerging markets, and AI integration.
Q: Which region is projected to have the largest market share?
A: North America currently holds a significant share, but Asia-Pacific is expected to witness the fastest growth due to increasing industrialization and technology adoption.
Q: Who are the top players in the global Nano-magnetic Devices market?
A: Leading players include IBM, Intel, Samsung Electronics, LG Electronics, Fujitsu, and Microsoft.
Q: What are the latest technological advancements in the industry?
A: Innovations include nano-magnetic memory for quantum computing, energy-efficient magnetoresistive RAM, and advanced magnetic sensors for medical diagnostics.
Q: What is the current size of the global Nano-magnetic Devices market?
A: The market was valued at USD 1021.50 million in 2023 and is expected to reach USD 1380.84 million by 2030, growing at a CAGR of 4.40%.

Get Sample Report PDF for Exclusive Insights
Report Sample Includes
- Table of Contents
- List of Tables & Figures
- Charts, Research Methodology, and more...


