Mid-IR Laser Crystal Market Trends, Business Strategies 2026-2036

Mid‑IR Laser Crystal Market will rise to USD 662 million by 2034, reflecting a CAGR of 6.4% during the forecast period.

PDF Icon Download Sample Report PDF
  • Quick Dispatch

    All Orders

  • Secure Payment

    100% Secure Payment

Price range: $1,500.00 through $4,250.00

Clear

Mid-IR Laser Crystal Market Insights

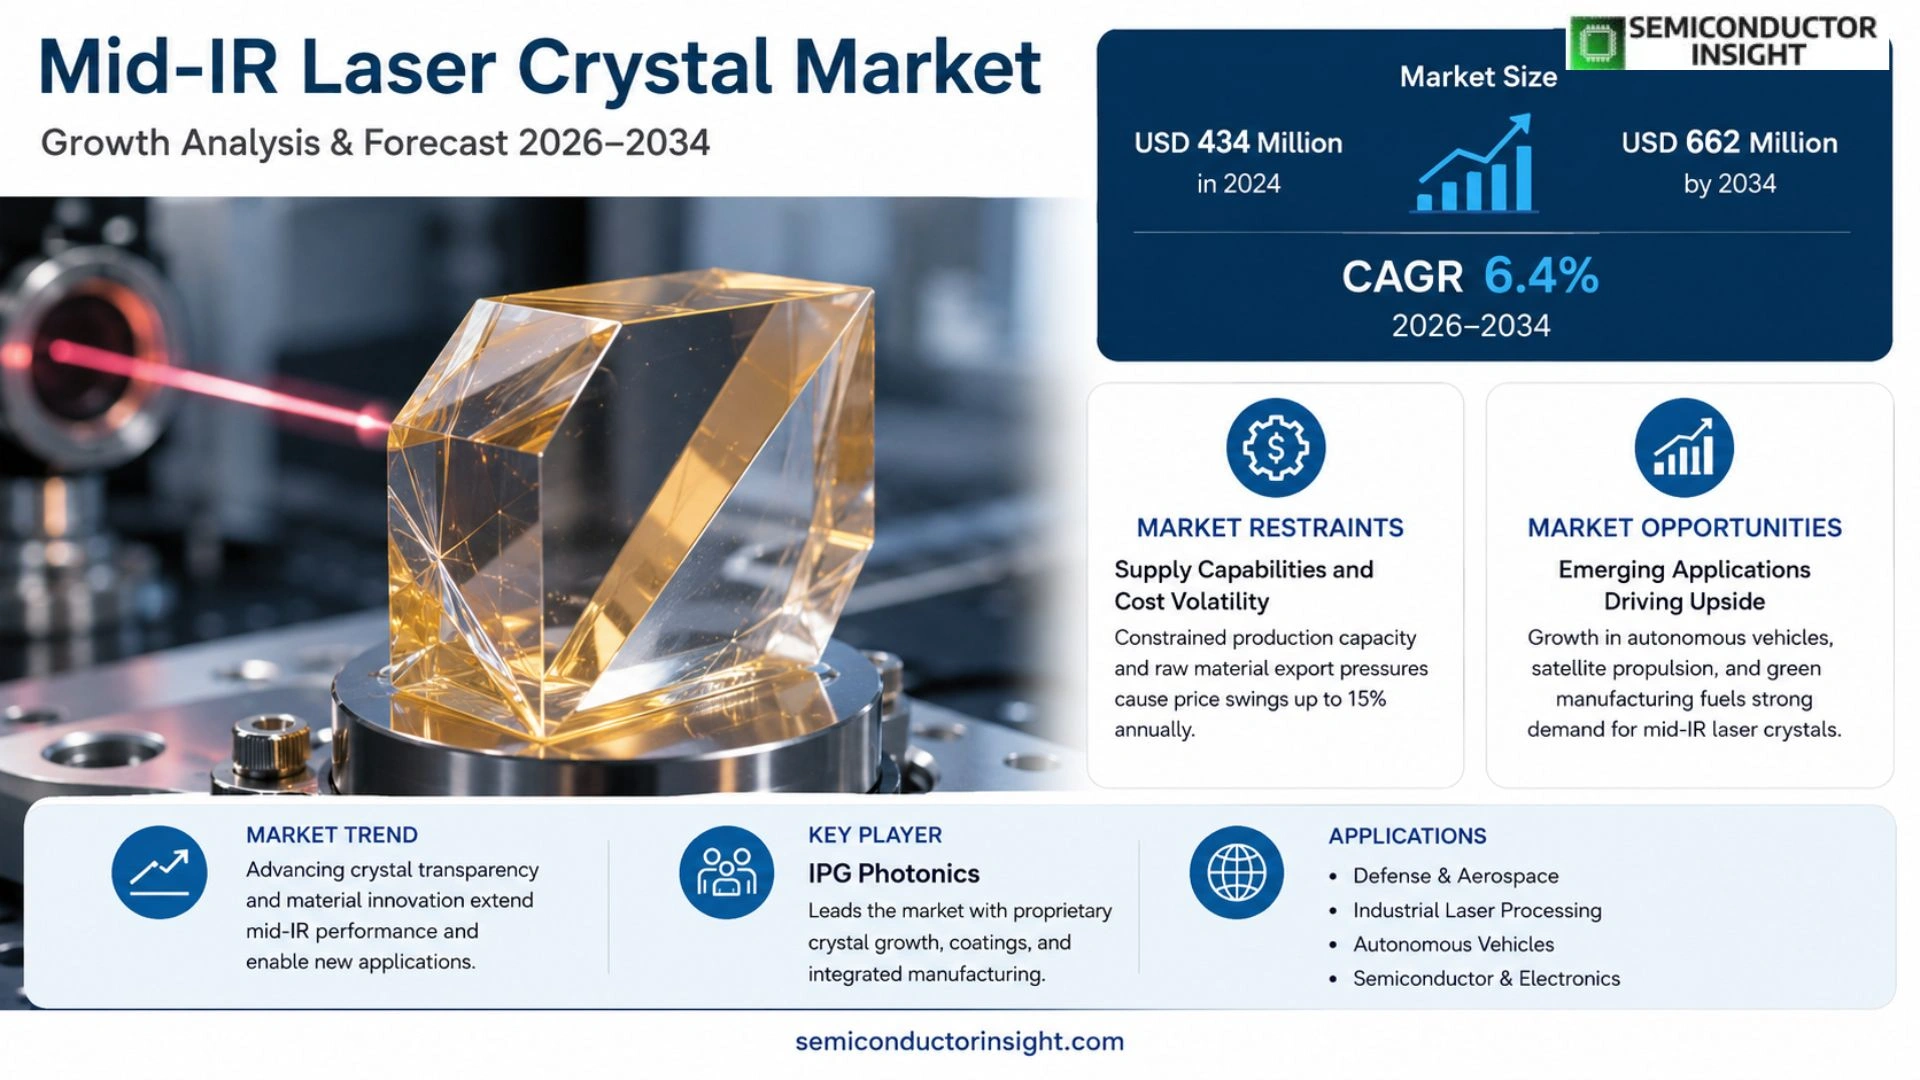
Mid‑IR Laser Crystal Market was valued at USD 434 million in 2024 and will rise to USD 662 million by 2034, reflecting a CAGR of 6.4% during the forecast period.

Mid‑IR laser crystals are engineered semiconductor materials that provide transparency across the mid‑infrared spectrum (3–8 µm), enabling efficient frequency conversion for applications such as spectroscopy, medical diagnostics, environmental monitoring and defense. Key materials include zinc germanium diphosphide (ZnGeP₂), silver gallium sulfide/selenide (AgGaS₂/AgGaSe₂), gallium selenide (GaSe) and cadmium selenide (CdSe). These crystals support quasi‑phase matching through orientation patterning or nonlinear optical interactions that generate tunable mid‑IR radiation.

The expanding use of high‑resolution spectroscopy instruments in aerospace and defense sectors fuels demand for these crystals because their broad transparency window allows precise wavelength tuning essential for LIDAR systems.
Mid-IR Laser Crystal Market Prizing

MARKET DRIVERS

Driving Forces in Mid-IR Laser Crystal Production

In Mid‑IR Laser Crystal Market, escalating adoption in precision spectroscopy and medical diagnostics is generating a robust uptick in demand. New metabolomic platforms rely on the narrow‑band emission characteristics that only high‑purity erbium‑ or holmium‑doped crystals can deliver, pushing revenue out of traditional arenas into biophotonics and industrial sensing.

Advances in Material Purity

State‑of‑the‑art Czochralski and flux growth techniques are now delivering crystals with defect concentrations below 10 ppm, a benchmark previously unachievable. Lower defect density translates to longer active lifetimes and reduced thermal load, enabling higher output powers that were once limited by laser‑induced damage. This technological leap reduces laser post‑processing costs, creating a favorable environment for cost‑sensitive sectors such as automotive lidar.

➤ Researchers demonstrate a 30 % improvement in slope efficiency for mid‑IR Nd:NaYF₄ crystals, a key metric for high‑brightness applications.

Collectively, these developments converge to sustain a market that not only meets existing demand but also unlocks new application corridors in spaceborne imaging and energy conversion.

MARKET CHALLENGES

Overcoming Technical Barriers

Despite the encouraging innovations, Mid‑IR Laser Crystal Market wrestles with stubborn manufacturing bottlenecks: the scalability of ultra‑pure growth processes remains constrained by the availability of high‑resistivity substrates, and the precision aligning of dopant profiles requires expensive, time‑consuming equipment.

Other Challenges

Regulatory Compliance Hurdles

Export controls on rare‑earth materials impose additional constraints on supply chains. Companies must navigate a patchwork of national regulations that can delay procurement and inflate inventory carrying costs, threatening project timelines in time‑sensitive research programs.

MARKET RESTRAINTS

Supply Capabilities and Cost Volatility

The constrained production capacity of fluoride and garnet crystals limits the ability to meet rapid market growth, especially for high‑grade laser heads used in defense systems. Observed price swings can reach 15 % annually, reflecting both geopolitical pressures on raw‑material export and the finite number of capable foundries worldwide.

MARKET OPPORTUNITIES

Emerging Applications Driving Upside

The increasing penetration of autonomous vehicles creates a demand for compact, low‑loss mid‑IR laser heads capable of operating under harsh environmental conditions. Parallel to this, advances in fiber‑coupled laser delivery systems position mid‑IR crystals as core components in next‑generation laser‑driven propulsion for small satellites, potentially unlocking substantial revenue through contract‑based sales.

Moreover, the ongoing industrial shift toward greener manufacturing processes bestows an additional pull: high‑temperature, mid‑IR laser machining of silicon‑based materials can reduce waste and improve precision, resonating with the circular‑economy objectives of major automotive and semiconductor players.

Mid-IR Laser Crystal Market Trends

Advancing crystal transparency and material innovation

Advancing crystal transparency has become the linchpin that underpins the expanding footprint of Mid‑IR Laser Crystal Market. In recent years, developers of zinc germanium diphosphide (ZGP) and the AgGaS2/AgGaSe2 family have pushed the operational window further into the mid‑infrared, enabling frequencies traditionally reserved for bulky, non‑commercial solutions. This progress not only fuels emerging applications,such as high‑resolution chemical sensors and counter‑stealth imaging systems,but also diversifies the customer base beyond aerospace and defense. Telecom operators, preparing for next‑generation 6G back‑haul frameworks, require crystals that deliver high output power at lower pump levels, a demand that mid‑IR lasers can satisfy through improved phase‑matching techniques. Concurrently, automotive lidar and industrial inspection sectors are adopting laser‑based THz modulators, driving a shift toward more cost‑effective, high‑throughput crystal production lines. As this ecosystem matures, Mid‑IR Laser Crystal Market increasingly positions itself as a core component of next‑stage data‑center power management and environmental sensing portfolios. The integration of advanced cooling materials reduces thermal drift, improves laser uptime, and broadens applicability in harsh satellite environments.

Other Trends

Diffusion of Gallium Arsenide and BOM Integration

Gallium arsenide (GaAs) has re‑entered the portfolio as orientation‑patterned variants provide quasi‑phase matching while reducing doping. The result is a lower cost, thermally stable module that fits high‑throughput semiconductor fabrication lines. Simultaneously, barium‑based compounds such as BaGa4S7 and BaGa4Se7 offer resistance to chlorine‑induced degradation, which is critical for high‑intensity mid‑IR applications. These chemistries can be layered into existing crystal stacks, allowing precise tuning of absorption bands for CO2 spectroscopy and gas‑phase detection,areas that are increasingly called for by environmental regulators. As silicon‑compatibility improves, the shift from rare‑earth sourcing toward abundant, scalable prototypes becomes a realistic pathway for manufacturers. Furthermore, the adoption of wafer‑scale manufacturing techniques reduces yield variability, while real‑time process monitoring allows early defect detection. These improvements translate into a supply chain that is resilient to market shocks and can provide the reliability demanded by defense‑grade installations. By offering modular trim‑chip packages, manufacturers enable quick integration into existing system‑on‑chip families, thereby reducing time‑to‑market in marketing.

Regional Consolidation and Supply‑Chain Resilience Initiatives

Consolidating supply chains across Asia‑Pacific mitigates uncertainties posed by fluctuating import tariffs and geopolitical restrictions. Companies that have invested in dual‑source facilities in Vietnam and India are benefiting from shorter lead times, while those that remain dependent on single suppliers in China face exposure to sudden yield shortfalls. In parallel, the emergence of localized fabrication hubs in Eastern Europe,particularly in Poland and the Czech Republic,provides a buffer for European‑centric customers requiring rapid fulfilment for defense and aerospace projects. The trend toward modular, component‑level integration, enabled by clearer intellectual‑property frameworks, is also encouraging smaller players to partner with tier‑1 manufacturers. Ultimately, firms that can match production capacities to this demand curve will not only secure lower manufacturing costs but also establish a leadership position in distributed manufacturing ecosystems, shaping the future of Mid‑IR Laser Crystal Market.

COMPETITIVE LANDSCAPE

Key Industry Players

Mid‑IR Laser Crystal Market: Competitive Landscape

IPG Photonics occupies the vanguard of the mid‑IR laser crystal space, consolidating almost two‑thirds of global sales for ZGP and AgGaSe₂ crystals through proprietary coating technology that extends operational wavelengths well beyond 3 µm. Its integrated supply chain, anchored by in‑house crystal growth and precision polishing units, delivers a cost advantage that has reinforced its position in aerospace, defense, and high‑performance industrial optics. Del Mar Photonics, while smaller, complements IPG’s portfolio with high‑purity GaSe and CdSe crystals, feeding a niche market of laser medical diagnostics and advanced spectroscopy. The geographic concentration of advanced manufacturing in North America and China supports a dual‑circuit model: North American facilities prioritize rapid turnaround for defense contracts, whereas Chinese plants focus on volume production for consumer electronics and automotive thermal imaging. This bifurcation safeguards the market against regional disruptions and aligns the supply chain closely with the most demanding downstream beneficiaries of mid‑IR technology.

Other actors reinforce the landscape’s depth. BAE Systems leverages its laser irradiation modules for directed‑energy warfare, offering custom AgGaS₂ crystal assemblies that enable tunable damage‑control tests, thereby capturing defense and homeland‑security demand. OptoCity, through its bespoke BaGa₄Se₇ formulations, targets the burgeoning chemical sensing sector in industrial control, while II‑VI Incorporated’s portfolio of CdSe and GaSe products serves both industrial processing and biomedical imaging. Inrad Optics, specializing in low‑power mid‑IR sources, finds a niche in atmospheric monitoring. Companies such as Stanford Advanced Materials, Newlight Photonics, 4Lasers, X‑Z LAB, Shalom EO, G and H Photonics, and 3photon provide differentiated crystal chemistries,ranging from orientation‑patterned GaAs to alloyed barium–germanium sulfides,that cater to high‑power laser development and extreme‑temperature applications. Their collective presence reduces the market’s reliance on a single supplier while fostering rapid innovation in wavelength agility and thermal robustness.

List of Key Mid‑IR Laser Crystal Companies Profiled

Segment Analysis:

Segment Category Sub-Segments Key Insights
By Type
  • Zinc Germanium Diphosphide (ZGP)
  • Silver Gallium Sulfide & Selenide (AgGaS\2, AgGaSe\2)
  • Gallium Selenide (GaSe)
  • Cadmium Selenide (CdSe)
  • Other Emerging Crystals
Zinc Germanium Diphosphide (ZGP) offers unparalleled transparency throughout the mid‑infrared spectrum, making it the preferred choice for high‑efficiency frequency‑converting lasers. Its crystal symmetry facilitates quasi‑phase matching, resulting in tunable output that supports advanced sensing and communication applications.

  • Provides robust performance across a wide wavelength range.
  • Enables compact laser designs due to high nonlinear coefficients.
  • Fosters innovation in precision measurement and remote sensing.
By Application
  • Aerospace and Defense
  • Healthcare Imaging
  • Chemical Sensing
  • Research & Development
  • Others
Aerospace and Defense capitalizes on the crystal’s high‑temperature tolerance and low absorption losses, driving demand for durable, high‑precision laser systems used in missile guidance and atmospheric probing.

  • Provides long‑range detection capability.
  • Supports advanced lidar for autonomous flight.
  • Enhances reliability in harsh operating environments.
By End User
  • Industrial Automation
  • Automotive Electronics
  • Smart Home Devices
  • Military Electronics
  • Research Laboratories
Industrial Automation leverages mid‑IR lasers for precise material processing and real‑time quality control, enabling manufacturers to achieve finer tolerances while reducing downtime.

  • Enables non‑contact temperature monitoring.
  • Improves process throughput with high‑power conversion.
  • Simplifies integration into existing production lines.
By Crystal Composition
  • Gallium Arsenide (GaAs)
  • Barium‑Based (BaGa\4S\7, BaGa\4Se\7)
  • Custom Alloyed Compounds
  • Others
Barium‑Based Crystals are emerging as high‑temperature alternatives, offering improved phase matching over extended wavelengths and contributing to the growth of robust, long‑life laser modules.

  • Supports operation in extreme thermal conditions.
  • Reduces thermal lensing in high‑power devices.
  • Facilitates integration with temperature‑stable systems.
By Manufacturing Process
  • Bulk Crystal Growth
  • Orientation‑Patterned Growth (OP‑GaAs)
  • Femtosecond Laser Processing
  • Others
Orientation‑Patterned Growth (OP‑GaAs) emerges as a leading technique, providing engineered nonlinear coefficients that enable efficient mid‑IR generation while maintaining crystal integrity.

  • Enables quasi‑phase matching without external poling.
  • Improves yield by reducing defect incorporation.
  • Expands the accessible wavelength range.

Regional Analysis: Mid-IR Laser Crystal Market

Asia-Pacific

In the Asia‑Pacific corridor, a convergence of high‑performance optics research and burgeoning industrial automation has pushed the adoption of mid‑infrared laser crystals. Manufacturers across Japan, South Korea, and China are now favoring indium phosphide‑based composites that deliver tunable output while maintaining compact form factors. This shift is propelled by the region’s strong semiconductor ecosystem and government‑backed incentives for precision manufacturing. Supply chains have adapted to accommodate high‑purity crystal growth, reducing lead times and cost volatility. Consequently, local players are positioning themselves as preferred partners for applications ranging from medical diagnostics to aerospace surveillance. The momentum generated here is not only reshaping regional market dynamics but also creating a ripple effect that pressures competitors worldwide to align their product roadmaps with the evolving technical benchmarks set by Asia‑Pacific innovators.

Leading Market Drivers
The combination of industrial demand for high‑resolution spectroscopy and opportunities in defense telemetry fuels the need for advanced laser crystals. With an emphasis on enhanced beam stability, firms are introducing tailored dopant levels that reduce chromatic aberration, thereby extending application bandwidth. This technical leap supports more reliable long‑haul communication links in harsh environmental conditions, a critical requirement for military and remote sensing networks.
Key Technological Advances
Recent breakthroughs in crystal lattice engineering have lowered thermal noise by integrating rare‑earth elements selectively. These innovations enable higher power outputs without compromising the single‑frequency operation that essential spectroscopy demands. Companies that refine these processes now offer product lines with markedly improved signal‑to‑noise ratios, a feature that aligns tightly with emerging quantum sensing initiatives.
Competitive Landscape
The market remains contested between a handful of established optics houses and agile start‑ups. In‑house crystal fabrication capabilities give incumbents a competitive edge, while newcomers rely on licensing key materials to accelerate time‑to‑market. Strategic alliances that span the supply chain,from raw‑material suppliers to end‑user integrators,are becoming the default path for scaling influence across the industry’s value chain.
Regulatory Considerations
Export controls on advanced laser technologies underscore the importance of compliance for firms seeking global footprint. Regional guidelines now mandate comprehensive traceability of crystal sourcing, driving adoption of digital twin practices for production transparency. Companies that proactively embed these compliance frameworks into their operational models are better positioned to secure larger overseas contracts.

North America
The North American segment remains heavily invested in research & development within the laser crystal arena, particularly through collaborations between defense contractors and semiconductor fab facilities. Architectural upgrades for next‑generation sensing platforms require laser crystals with exceptional linearity and thermal stability. While the supply chain is mature, localized fabrication helps mitigate geopolitical risks. This region also hosts a concentration of high‑tech clusters that prioritize incremental performance gains over wholesale market size, ensuring that the industry continues to push into new frequency regimes with quieter, more energy‑efficient designs. The focus on precision engineering here may compel partners in other regions to adapt their component specifications to meet stricter reliability thresholds, thereby raising overall technical barometers globally.

Europe
European operators are characterized by a mix of strategic partnerships between institutes and industry players that emphasize sustainable manufacturing practices. Emission regulations and circularity mandates shape the procurement of mid‑IR laser crystals, encouraging firms to adopt low‑hazard growth environments. The integration of crystal components into surgical navigation tools and atmospheric monitoring stations underlines the region’s preference for medical and environmental applications. Consequently, market players in Europe are investing heavily in ruggedizing crystal designs to survive variable temperature ranges found in harsh deployment settings, setting a benchmark for resilience that cross‑border competitors are following suit. This persistent emphasis on durability helps secure long‑term contracts with public sector bodies, reinforcing the breadth of the region’s demand base.

South America
South American prospects for emerging laser crystal markets vary by commodity exposure and localized manufacturing capabilities. Countries with established semiconductor inputs see a growing appetite for high‑purity optics used in specialized mineral exploration. However, the supply chain remains fragmented, and regional firms often turn to import channels for cutting‑edge components. Economic volatility and developing infrastructure challenge the scaling potential, but targeted investment incentives are bringing initial prototypes into commercial environments. As a result, startups there are focusing on lightweight, modular crystal packages designed for on‑site testing, which could accelerate adoption within the precious‑metal extraction sector where precision measurement can unlock incremental yield.

Middle East & Africa
In the Middle East & Africa, the market is driven primarily by the rise of energy‑efficiency initiatives and increasing reliance on high‑resolution infrared sensors for security applications. The region’s infrastructure upgrades, especially in oil refining and smart‑grid monitoring, require laser systems that deliver pinpoint accuracy and reliability. The adoption of mid‑IR laser crystals by utility companies has prompted demands for locally sourced advanced materials to reduce dependence on external supply chains. Consequently, several regional authorities are negotiating technology‑transfer agreements with leading crystal manufacturers. These arrangements aim to build domestic capabilities while adding value to existing industrial ecosystems.

Report Scope

This market research report provides a comprehensive analysis of the Mid-IR Laser Crystal Market , covering the forecast period 2026–2034. It offers detailed insights into market dynamics, technological advancements, competitive landscape, and key trends shaping the industry.

Key focus areas of the report include:

  • Market Overview: The report begins with an overview outlining its current market scenario, key growth indicators, and industry transformation drivers. It discusses macroeconomic factors, demand–supply balance, regulatory landscape, and the strategic role of semiconductors in powering advancements across industries such as automotive, telecommunications, consumer electronics, and industrial automation.
  • Market Size & Forecast: Historical data and future projections for revenue, unit shipments, and market value across major regions and segments.
  • Segmentation Analysis: Detailed breakdown by product type, technology, application, and end-user industry to identify high-growth segments and investment opportunities.
  • Regional Insights: Insights into market performance across North America, Europe, Asia-Pacific, Latin America, and the Middle East & Africa, including country-level analysis where relevant.
  • Competitive Landscape: Profiles of leading market participants, including their product offerings, R&D focus, manufacturing capacity, pricing strategies, and recent developments such as mergers, acquisitions, and partnerships.
  • Technology Trends & Innovation: Assessment of emerging technologies, integration of AI/IoT, semiconductor design trends, fabrication techniques, and evolving industry standards.
  • Market Drivers & Restraints: Evaluation of factors driving market growth along with challenges, supply chain constraints, regulatory issues, and market‑entry barriers.
  • Stakeholder Insights: Insights for component suppliers, OEMs, system integrators, investors, and policymakers regarding the evolving ecosystem and strategic opportunities.

Primary and secondary research methods are employed, including interviews with industry experts, data from verified sources, and real‑time market intelligence to ensure the accuracy and reliability of the insights presented.

FREQUENTLY ASKED QUESTIONS:

What is the current market size of Mid-IR Laser Crystal Market?

-> Mid‑IR Laser Crystal Market will rise to USD 662 million by 2034, reflecting a CAGR of 6.4% during the forecast period.

Which key companies operate in Mid-IR Laser Crystal Market?

-> Key players include IPG Photonics, Del Mar Photonics, BAE Systems, OptoCity, II‑VI Incorporated, Inrad Optics, X‑Z LAB, Shalom EO, 4Lasers, Newlight Photonics, Stanford Advanced Materials, G and H Photonics, and 3photon.

What are the key growth drivers?

-> Key growth drivers include digital transformation, the rapid expansion of artificial intelligence and Internet of Things technologies, the growing demand for new energy vehicles, and the strategic importance of mid‑infrared laser crystals in defense, healthcare, and research applications.

Which region dominates the market?

-> Asia‑Pacific dominates, driven by robust electronics manufacturing, infrastructure development, and strong downstream demand in communication equipment and data centers.

What are the emerging trends?

-> Emerging trends include the adoption of novel crystal materials such as BaGa4S7 and orientation‑patterned GaAs, increased integration of mid‑IR laser technology in AI/IoT systems, and expanding applications in aerospace, defense, and biomedical research.

Mid-IR Laser Crystal Market Trends, Business Strategies 2026-2036

Get Sample Report PDF for Exclusive Insights

Report Sample Includes

  • Table of Contents
  • List of Tables & Figures
  • Charts, Research Methodology, and more...

PDF Icon Download Sample Report PDF

Download Sample Report

Table of Content

Table of Contents
1 Research Methodology and Statistical Scope
1.1 Market Definition and Statistical Scope of Mid-IR Laser Crystal
1.2 Key Market Segments
1.2.1 Mid-IR Laser Crystal Segment by Type
1.2.2 Mid-IR Laser Crystal Segment by Application
1.3 Methodology & Sources of Information
1.3.1 Research Methodology
1.3.2 Research Process
1.3.3 Market Breakdown and Data Triangulation
1.3.4 Base Year
1.3.5 Report Assumptions & Caveats
2 Mid-IR Laser Crystal Market Overview
2.1 Global Market Overview
2.1.1 Global Mid-IR Laser Crystal Market Size (M USD) Estimates and Forecasts (2019-2032)
2.1.2 Global Mid-IR Laser Crystal Sales Estimates and Forecasts (2019-2032)
2.2 Market Segment Executive Summary
2.3 Global Market Size by Region
3 Mid-IR Laser Crystal Market Competitive Landscape
3.1 Global Mid-IR Laser Crystal Sales by Manufacturers (2019-2025)
3.2 Global Mid-IR Laser Crystal Revenue Market Share by Manufacturers (2019-2025)
3.3 Mid-IR Laser Crystal Market Share by Company Type (Tier 1, Tier 2, and Tier 3)
3.4 Global Mid-IR Laser Crystal Average Price by Manufacturers (2019-2025)
3.5 Manufacturers Mid-IR Laser Crystal Sales Sites, Area Served, Product Type
3.6 Mid-IR Laser Crystal Market Competitive Situation and Trends
3.6.1 Mid-IR Laser Crystal Market Concentration Rate
3.6.2 Global 5 and 10 Largest Mid-IR Laser Crystal Players Market Share by Revenue
3.6.3 Mergers & Acquisitions, Expansion
4 Mid-IR Laser Crystal Industry Chain Analysis
4.1 Mid-IR Laser Crystal Industry Chain Analysis
4.2 Market Overview of Key Raw Materials
4.3 Midstream Market Analysis
4.4 Downstream Customer Analysis
5 The Development and Dynamics of Mid-IR Laser Crystal Market
5.1 Key Development Trends
5.2 Driving Factors
5.3 Market Challenges
5.4 Market Restraints
5.5 Industry News
5.5.1 New Product Developments
5.5.2 Mergers & Acquisitions
5.5.3 Expansions
5.5.4 Collaboration/Supply Contracts
5.6 Industry Policies
6 Mid-IR Laser Crystal Market Segmentation by Type
6.1 Evaluation Matrix of Segment Market Development Potential (Type)
6.2 Global Mid-IR Laser Crystal Sales Market Share by Type (2019-2025)
6.3 Global Mid-IR Laser Crystal Market Size Market Share by Type (2019-2025)
6.4 Global Mid-IR Laser Crystal Price by Type (2019-2025)
7 Mid-IR Laser Crystal Market Segmentation by Application
7.1 Evaluation Matrix of Segment Market Development Potential (Application)
7.2 Global Mid-IR Laser Crystal Market Sales by Application (2019-2025)
7.3 Global Mid-IR Laser Crystal Market Size (M USD) by Application (2019-2025)
7.4 Global Mid-IR Laser Crystal Sales Growth Rate by Application (2019-2025)
8 Mid-IR Laser Crystal Market Consumption by Region
8.1 Global Mid-IR Laser Crystal Sales by Region
8.1.1 Global Mid-IR Laser Crystal Sales by Region
8.1.2 Global Mid-IR Laser Crystal Sales Market Share by Region
8.2 North America
8.2.1 North America Mid-IR Laser Crystal Sales by Country
8.2.2 U.S.
8.2.3 Canada
8.2.4 Mexico
8.3 Europe
8.3.1 Europe Mid-IR Laser Crystal Sales by Country
8.3.2 Germany
8.3.3 France
8.3.4 U.K.
8.3.5 Italy
8.3.6 Russia
8.4 Asia Pacific
8.4.1 Asia Pacific Mid-IR Laser Crystal Sales by Region
8.4.2 China
8.4.3 Japan
8.4.4 South Korea
8.4.5 India
8.4.6 Southeast Asia
8.5 South America
8.5.1 South America Mid-IR Laser Crystal Sales by Country
8.5.2 Brazil
8.5.3 Argentina
8.5.4 Columbia
8.6 Middle East and Africa
8.6.1 Middle East and Africa Mid-IR Laser Crystal Sales by Region
8.6.2 Saudi Arabia
8.6.3 UAE
8.6.4 Egypt
8.6.5 Nigeria
8.6.6 South Africa
9 Mid-IR Laser Crystal Market Production by Region
9.1 Global Production of Mid-IR Laser Crystal by Region (2019-2025)
9.2 Global Mid-IR Laser Crystal Revenue Market Share by Region (2019-2025)
9.3 Global Mid-IR Laser Crystal Production, Revenue, Price and Gross Margin (2019-2025)
9.4 North America Mid-IR Laser Crystal Production
9.4.1 North America Mid-IR Laser Crystal Production Growth Rate (2019-2025)
9.4.2 North America Mid-IR Laser Crystal Production, Revenue, Price and Gross Margin (2019-2025)
9.5 Europe Mid-IR Laser Crystal Production
9.5.1 Europe Mid-IR Laser Crystal Production Growth Rate (2019-2025)
9.5.2 Europe Mid-IR Laser Crystal Production, Revenue, Price and Gross Margin (2019-2025)
9.6 Japan Mid-IR Laser Crystal Production (2019-2025)
9.6.1 Japan Mid-IR Laser Crystal Production Growth Rate (2019-2025)
9.6.2 Japan Mid-IR Laser Crystal Production, Revenue, Price and Gross Margin (2019-2025)
9.7 China Mid-IR Laser Crystal Production (2019-2025)
9.7.1 China Mid-IR Laser Crystal Production Growth Rate (2019-2025)
9.7.2 China Mid-IR Laser Crystal Production, Revenue, Price and Gross Margin (2019-2025)
10 Key Companies Profile
10.1 IPG Photonics
10.1.1 IPG Photonics Mid-IR Laser Crystal Basic Information
10.1.2 IPG Photonics Mid-IR Laser Crystal Product Overview
10.1.3 IPG Photonics Mid-IR Laser Crystal Product Market Performance
10.1.4 IPG Photonics Business Overview
10.1.5 IPG Photonics Mid-IR Laser Crystal SWOT Analysis
10.1.6 IPG Photonics Recent Developments
10.2 Del Mar Photonics
10.2.1 Del Mar Photonics Mid-IR Laser Crystal Basic Information
10.2.2 Del Mar Photonics Mid-IR Laser Crystal Product Overview
10.2.3 Del Mar Photonics Mid-IR Laser Crystal Product Market Performance
10.2.4 Del Mar Photonics Business Overview
10.2.5 Del Mar Photonics Mid-IR Laser Crystal SWOT Analysis
10.2.6 Del Mar Photonics Recent Developments
10.3 BAE Systems
10.3.1 BAE Systems Mid-IR Laser Crystal Basic Information
10.3.2 BAE Systems Mid-IR Laser Crystal Product Overview
10.3.3 BAE Systems Mid-IR Laser Crystal Product Market Performance
10.3.4 BAE Systems Mid-IR Laser Crystal SWOT Analysis
10.3.5 BAE Systems Business Overview
10.3.6 BAE Systems Recent Developments
10.4 OptoCity
10.4.1 OptoCity Mid-IR Laser Crystal Basic Information
10.4.2 OptoCity Mid-IR Laser Crystal Product Overview
10.4.3 OptoCity Mid-IR Laser Crystal Product Market Performance
10.4.4 OptoCity Business Overview
10.4.5 OptoCity Recent Developments
10.5 II-VI Incorporated
10.5.1 II-VI Incorporated Mid-IR Laser Crystal Basic Information
10.5.2 II-VI Incorporated Mid-IR Laser Crystal Product Overview
10.5.3 II-VI Incorporated Mid-IR Laser Crystal Product Market Performance
10.5.4 II-VI Incorporated Business Overview
10.5.5 II-VI Incorporated Recent Developments
10.6 Inrad Optics
10.6.1 Inrad Optics Mid-IR Laser Crystal Basic Information
10.6.2 Inrad Optics Mid-IR Laser Crystal Product Overview
10.6.3 Inrad Optics Mid-IR Laser Crystal Product Market Performance
10.6.4 Inrad Optics Business Overview
10.6.5 Inrad Optics Recent Developments
10.7 X-Z LAB
10.7.1 X-Z LAB Mid-IR Laser Crystal Basic Information
10.7.2 X-Z LAB Mid-IR Laser Crystal Product Overview
10.7.3 X-Z LAB Mid-IR Laser Crystal Product Market Performance
10.7.4 X-Z LAB Business Overview
10.7.5 X-Z LAB Recent Developments
10.8 Shalom EO
10.8.1 Shalom EO Mid-IR Laser Crystal Basic Information
10.8.2 Shalom EO Mid-IR Laser Crystal Product Overview
10.8.3 Shalom EO Mid-IR Laser Crystal Product Market Performance
10.8.4 Shalom EO Business Overview
10.8.5 Shalom EO Recent Developments
10.9 4Lasers
10.9.1 4Lasers Mid-IR Laser Crystal Basic Information
10.9.2 4Lasers Mid-IR Laser Crystal Product Overview
10.9.3 4Lasers Mid-IR Laser Crystal Product Market Performance
10.9.4 4Lasers Business Overview
10.9.5 4Lasers Recent Developments
10.10 Newlight Photonics
10.10.1 Newlight Photonics Mid-IR Laser Crystal Basic Information
10.10.2 Newlight Photonics Mid-IR Laser Crystal Product Overview
10.10.3 Newlight Photonics Mid-IR Laser Crystal Product Market Performance
10.10.4 Newlight Photonics Business Overview
10.10.5 Newlight Photonics Recent Developments
10.11 Stanford Advanced Materials
10.11.1 Stanford Advanced Materials Mid-IR Laser Crystal Basic Information
10.11.2 Stanford Advanced Materials Mid-IR Laser Crystal Product Overview
10.11.3 Stanford Advanced Materials Mid-IR Laser Crystal Product Market Performance
10.11.4 Stanford Advanced Materials Business Overview
10.11.5 Stanford Advanced Materials Recent Developments
10.12 G and H Photonics
10.12.1 G and H Photonics Mid-IR Laser Crystal Basic Information
10.12.2 G and H Photonics Mid-IR Laser Crystal Product Overview
10.12.3 G and H Photonics Mid-IR Laser Crystal Product Market Performance
10.12.4 G and H Photonics Business Overview
10.12.5 G and H Photonics Recent Developments
10.13 3photon
10.13.1 3photon Mid-IR Laser Crystal Basic Information
10.13.2 3photon Mid-IR Laser Crystal Product Overview
10.13.3 3photon Mid-IR Laser Crystal Product Market Performance
10.13.4 3photon Business Overview
10.13.5 3photon Recent Developments
11 Mid-IR Laser Crystal Market Forecast by Region
11.1 Global Mid-IR Laser Crystal Market Size Forecast
11.2 Global Mid-IR Laser Crystal Market Forecast by Region
11.2.1 North America Market Size Forecast by Country
11.2.2 Europe Mid-IR Laser Crystal Market Size Forecast by Country
11.2.3 Asia Pacific Mid-IR Laser Crystal Market Size Forecast by Region
11.2.4 South America Mid-IR Laser Crystal Market Size Forecast by Country
11.2.5 Middle East and Africa Forecasted Consumption of Mid-IR Laser Crystal by Country
12 Forecast Market by Type and by Application (2025-2032)
12.1 Global Mid-IR Laser Crystal Market Forecast by Type (2025-2032)
12.1.1 Global Forecasted Sales of Mid-IR Laser Crystal by Type (2025-2032)
12.1.2 Global Mid-IR Laser Crystal Market Size Forecast by Type (2025-2032)
12.1.3 Global Forecasted Price of Mid-IR Laser Crystal by Type (2025-2032)
12.2 Global Mid-IR Laser Crystal Market Forecast by Application (2025-2032)
12.2.1 Global Mid-IR Laser Crystal Sales (K Units) Forecast by Application
12.2.2 Global Mid-IR Laser Crystal Market Size (M USD) Forecast by Application (2025-2032)
13 Conclusion and Key FindingsList of Tables
Table 1. Introduction of the Type
Table 2. Introduction of the Application
Table 3. Market Size (M USD) Segment Executive Summary
Table 4. Mid-IR Laser Crystal Market Size Comparison by Region (M USD)
Table 5. Global Mid-IR Laser Crystal Sales (K Units) by Manufacturers (2019-2025)
Table 6. Global Mid-IR Laser Crystal Sales Market Share by Manufacturers (2019-2025)
Table 7. Global Mid-IR Laser Crystal Revenue (M USD) by Manufacturers (2019-2025)
Table 8. Global Mid-IR Laser Crystal Revenue Share by Manufacturers (2019-2025)
Table 9. Company Type (Tier 1, Tier 2, and Tier 3) & (based on the Revenue in Mid-IR Laser Crystal as of 2022)
Table 10. Global Market Mid-IR Laser Crystal Average Price (USD/Unit) of Key Manufacturers (2019-2025)
Table 11. Manufacturers Mid-IR Laser Crystal Sales Sites and Area Served
Table 12. Manufacturers Mid-IR Laser Crystal Product Type
Table 13. Global Mid-IR Laser Crystal Manufacturers Market Concentration Ratio (CR5 and HHI)
Table 14. Mergers & Acquisitions, Expansion Plans
Table 15. Industry Chain Map of Mid-IR Laser Crystal
Table 16. Market Overview of Key Raw Materials
Table 17. Midstream Market Analysis
Table 18. Downstream Customer Analysis
Table 19. Key Development Trends
Table 20. Driving Factors
Table 21. Mid-IR Laser Crystal Market Challenges
Table 22. Global Mid-IR Laser Crystal Sales by Type (K Units)
Table 23. Global Mid-IR Laser Crystal Market Size by Type (M USD)
Table 24. Global Mid-IR Laser Crystal Sales (K Units) by Type (2019-2025)
Table 25. Global Mid-IR Laser Crystal Sales Market Share by Type (2019-2025)
Table 26. Global Mid-IR Laser Crystal Market Size (M USD) by Type (2019-2025)
Table 27. Global Mid-IR Laser Crystal Market Size Share by Type (2019-2025)
Table 28. Global Mid-IR Laser Crystal Price (USD/Unit) by Type (2019-2025)
Table 29. Global Mid-IR Laser Crystal Sales (K Units) by Application
Table 30. Global Mid-IR Laser Crystal Market Size by Application
Table 31. Global Mid-IR Laser Crystal Sales by Application (2019-2025) & (K Units)
Table 32. Global Mid-IR Laser Crystal Sales Market Share by Application (2019-2025)
Table 33. Global Mid-IR Laser Crystal Sales by Application (2019-2025) & (M USD)
Table 34. Global Mid-IR Laser Crystal Market Share by Application (2019-2025)
Table 35. Global Mid-IR Laser Crystal Sales Growth Rate by Application (2019-2025)
Table 36. Global Mid-IR Laser Crystal Sales by Region (2019-2025) & (K Units)
Table 37. Global Mid-IR Laser Crystal Sales Market Share by Region (2019-2025)
Table 38. North America Mid-IR Laser Crystal Sales by Country (2019-2025) & (K Units)
Table 39. Europe Mid-IR Laser Crystal Sales by Country (2019-2025) & (K Units)
Table 40. Asia Pacific Mid-IR Laser Crystal Sales by Region (2019-2025) & (K Units)
Table 41. South America Mid-IR Laser Crystal Sales by Country (2019-2025) & (K Units)
Table 42. Middle East and Africa Mid-IR Laser Crystal Sales by Region (2019-2025) & (K Units)
Table 43. Global Mid-IR Laser Crystal Production (K Units) by Region (2019-2025)
Table 44. Global Mid-IR Laser Crystal Revenue (US$ Million) by Region (2019-2025)
Table 45. Global Mid-IR Laser Crystal Revenue Market Share by Region (2019-2025)
Table 46. Global Mid-IR Laser Crystal Production (K Units), Revenue (US$ Million), Price (USD/Unit) and Gross Margin (2019-2025)
Table 47. North America Mid-IR Laser Crystal Production (K Units), Revenue (US$ Million), Price (USD/Unit) and Gross Margin (2019-2025)
Table 48. Europe Mid-IR Laser Crystal Production (K Units), Revenue (US$ Million), Price (USD/Unit) and Gross Margin (2019-2025)
Table 49. Japan Mid-IR Laser Crystal Production (K Units), Revenue (US$ Million), Price (USD/Unit) and Gross Margin (2019-2025)
Table 50. China Mid-IR Laser Crystal Production (K Units), Revenue (US$ Million), Price (USD/Unit) and Gross Margin (2019-2025)
Table 51. IPG Photonics Mid-IR Laser Crystal Basic Information
Table 52. IPG Photonics Mid-IR Laser Crystal Product Overview
Table 53. IPG Photonics Mid-IR Laser Crystal Sales (K Units), Revenue (M USD), Price (USD/Unit) and Gross Margin (2019-2025)
Table 54. IPG Photonics Business Overview
Table 55. IPG Photonics Mid-IR Laser Crystal SWOT Analysis
Table 56. IPG Photonics Recent Developments
Table 57. Del Mar Photonics Mid-IR Laser Crystal Basic Information
Table 58. Del Mar Photonics Mid-IR Laser Crystal Product Overview
Table 59. Del Mar Photonics Mid-IR Laser Crystal Sales (K Units), Revenue (M USD), Price (USD/Unit) and Gross Margin (2019-2025)
Table 60. Del Mar Photonics Business Overview
Table 61. Del Mar Photonics Mid-IR Laser Crystal SWOT Analysis
Table 62. Del Mar Photonics Recent Developments
Table 63. BAE Systems Mid-IR Laser Crystal Basic Information
Table 64. BAE Systems Mid-IR Laser Crystal Product Overview
Table 65. BAE Systems Mid-IR Laser Crystal Sales (K Units), Revenue (M USD), Price (USD/Unit) and Gross Margin (2019-2025)
Table 66. BAE Systems Mid-IR Laser Crystal SWOT Analysis
Table 67. BAE Systems Business Overview
Table 68. BAE Systems Recent Developments
Table 69. OptoCity Mid-IR Laser Crystal Basic Information
Table 70. OptoCity Mid-IR Laser Crystal Product Overview
Table 71. OptoCity Mid-IR Laser Crystal Sales (K Units), Revenue (M USD), Price (USD/Unit) and Gross Margin (2019-2025)
Table 72. OptoCity Business Overview
Table 73. OptoCity Recent Developments
Table 74. II-VI Incorporated Mid-IR Laser Crystal Basic Information
Table 75. II-VI Incorporated Mid-IR Laser Crystal Product Overview
Table 76. II-VI Incorporated Mid-IR Laser Crystal Sales (K Units), Revenue (M USD), Price (USD/Unit) and Gross Margin (2019-2025)
Table 77. II-VI Incorporated Business Overview
Table 78. II-VI Incorporated Recent Developments
Table 79. Inrad Optics Mid-IR Laser Crystal Basic Information
Table 80. Inrad Optics Mid-IR Laser Crystal Product Overview
Table 81. Inrad Optics Mid-IR Laser Crystal Sales (K Units), Revenue (M USD), Price (USD/Unit) and Gross Margin (2019-2025)
Table 82. Inrad Optics Business Overview
Table 83. Inrad Optics Recent Developments
Table 84. X-Z LAB Mid-IR Laser Crystal Basic Information
Table 85. X-Z LAB Mid-IR Laser Crystal Product Overview
Table 86. X-Z LAB Mid-IR Laser Crystal Sales (K Units), Revenue (M USD), Price (USD/Unit) and Gross Margin (2019-2025)
Table 87. X-Z LAB Business Overview
Table 88. X-Z LAB Recent Developments
Table 89. Shalom EO Mid-IR Laser Crystal Basic Information
Table 90. Shalom EO Mid-IR Laser Crystal Product Overview
Table 91. Shalom EO Mid-IR Laser Crystal Sales (K Units), Revenue (M USD), Price (USD/Unit) and Gross Margin (2019-2025)
Table 92. Shalom EO Business Overview
Table 93. Shalom EO Recent Developments
Table 94. 4Lasers Mid-IR Laser Crystal Basic Information
Table 95. 4Lasers Mid-IR Laser Crystal Product Overview
Table 96. 4Lasers Mid-IR Laser Crystal Sales (K Units), Revenue (M USD), Price (USD/Unit) and Gross Margin (2019-2025)
Table 97. 4Lasers Business Overview
Table 98. 4Lasers Recent Developments
Table 99. Newlight Photonics Mid-IR Laser Crystal Basic Information
Table 100. Newlight Photonics Mid-IR Laser Crystal Product Overview
Table 101. Newlight Photonics Mid-IR Laser Crystal Sales (K Units), Revenue (M USD), Price (USD/Unit) and Gross Margin (2019-2025)
Table 102. Newlight Photonics Business Overview
Table 103. Newlight Photonics Recent Developments
Table 104. Stanford Advanced Materials Mid-IR Laser Crystal Basic Information
Table 105. Stanford Advanced Materials Mid-IR Laser Crystal Product Overview
Table 106. Stanford Advanced Materials Mid-IR Laser Crystal Sales (K Units), Revenue (M USD), Price (USD/Unit) and Gross Margin (2019-2025)
Table 107. Stanford Advanced Materials Business Overview
Table 108. Stanford Advanced Materials Recent Developments
Table 109. G and H Photonics Mid-IR Laser Crystal Basic Information
Table 110. G and H Photonics Mid-IR Laser Crystal Product Overview
Table 111. G and H Photonics Mid-IR Laser Crystal Sales (K Units), Revenue (M USD), Price (USD/Unit) and Gross Margin (2019-2025)
Table 112. G and H Photonics Business Overview
Table 113. G and H Photonics Recent Developments
Table 114. 3photon Mid-IR Laser Crystal Basic Information
Table 115. 3photon Mid-IR Laser Crystal Product Overview
Table 116. 3photon Mid-IR Laser Crystal Sales (K Units), Revenue (M USD), Price (USD/Unit) and Gross Margin (2019-2025)
Table 117. 3photon Business Overview
Table 118. 3photon Recent Developments
Table 119. Global Mid-IR Laser Crystal Sales Forecast by Region (2025-2032) & (K Units)
Table 120. Global Mid-IR Laser Crystal Market Size Forecast by Region (2025-2032) & (M USD)
Table 121. North America Mid-IR Laser Crystal Sales Forecast by Country (2025-2032) & (K Units)
Table 122. North America Mid-IR Laser Crystal Market Size Forecast by Country (2025-2032) & (M USD)
Table 123. Europe Mid-IR Laser Crystal Sales Forecast by Country (2025-2032) & (K Units)
Table 124. Europe Mid-IR Laser Crystal Market Size Forecast by Country (2025-2032) & (M USD)
Table 125. Asia Pacific Mid-IR Laser Crystal Sales Forecast by Region (2025-2032) & (K Units)
Table 126. Asia Pacific Mid-IR Laser Crystal Market Size Forecast by Region (2025-2032) & (M USD)
Table 127. South America Mid-IR Laser Crystal Sales Forecast by Country (2025-2032) & (K Units)
Table 128. South America Mid-IR Laser Crystal Market Size Forecast by Country (2025-2032) & (M USD)
Table 129. Middle East and Africa Mid-IR Laser Crystal Consumption Forecast by Country (2025-2032) & (Units)
Table 130. Middle East and Africa Mid-IR Laser Crystal Market Size Forecast by Country (2025-2032) & (M USD)
Table 131. Global Mid-IR Laser Crystal Sales Forecast by Type (2025-2032) & (K Units)
Table 132. Global Mid-IR Laser Crystal Market Size Forecast by Type (2025-2032) & (M USD)
Table 133. Global Mid-IR Laser Crystal Price Forecast by Type (2025-2032) & (USD/Unit)
Table 134. Global Mid-IR Laser Crystal Sales (K Units) Forecast by Application (2025-2032)
Table 135. Global Mid-IR Laser Crystal Market Size Forecast by Application (2025-2032) & (M USD)
List of Figures
Figure 1. Product Picture of Mid-IR Laser Crystal
Figure 2. Data Triangulation
Figure 3. Key Caveats
Figure 4. Global Mid-IR Laser Crystal Market Size (M USD), 2019-2032
Figure 5. Global Mid-IR Laser Crystal Market Size (M USD) (2019-2032)
Figure 6. Global Mid-IR Laser Crystal Sales (K Units) & (2019-2032)
Figure 7. Evaluation Matrix of Segment Market Development Potential (Type)
Figure 8. Evaluation Matrix of Segment Market Development Potential (Application)
Figure 9. Evaluation Matrix of Regional Market Development Potential
Figure 10. Mid-IR Laser Crystal Market Size by Country (M USD)
Figure 11. Mid-IR Laser Crystal Sales Share by Manufacturers in 2023
Figure 12. Global Mid-IR Laser Crystal Revenue Share by Manufacturers in 2023
Figure 13. Mid-IR Laser Crystal Market Share by Company Type (Tier 1, Tier 2 and Tier 3): 2023
Figure 14. Global Market Mid-IR Laser Crystal Average Price (USD/Unit) of Key Manufacturers in 2023
Figure 15. The Global 5 and 10 Largest Players: Market Share by Mid-IR Laser Crystal Revenue in 2023
Figure 16. Evaluation Matrix of Segment Market Development Potential (Type)
Figure 17. Global Mid-IR Laser Crystal Market Share by Type
Figure 18. Sales Market Share of Mid-IR Laser Crystal by Type (2019-2025)
Figure 19. Sales Market Share of Mid-IR Laser Crystal by Type in 2023
Figure 20. Market Size Share of Mid-IR Laser Crystal by Type (2019-2025)
Figure 21. Market Size Market Share of Mid-IR Laser Crystal by Type in 2023
Figure 22. Evaluation Matrix of Segment Market Development Potential (Application)
Figure 23. Global Mid-IR Laser Crystal Market Share by Application
Figure 24. Global Mid-IR Laser Crystal Sales Market Share by Application (2019-2025)
Figure 25. Global Mid-IR Laser Crystal Sales Market Share by Application in 2023
Figure 26. Global Mid-IR Laser Crystal Market Share by Application (2019-2025)
Figure 27. Global Mid-IR Laser Crystal Market Share by Application in 2023
Figure 28. Global Mid-IR Laser Crystal Sales Growth Rate by Application (2019-2025)
Figure 29. Global Mid-IR Laser Crystal Sales Market Share by Region (2019-2025)
Figure 30. North America Mid-IR Laser Crystal Sales and Growth Rate (2019-2025) & (K Units)
Figure 31. North America Mid-IR Laser Crystal Sales Market Share by Country in 2023
Figure 32. U.S. Mid-IR Laser Crystal Sales and Growth Rate (2019-2025) & (K Units)
Figure 33. Canada Mid-IR Laser Crystal Sales (K Units) and Growth Rate (2019-2025)
Figure 34. Mexico Mid-IR Laser Crystal Sales (Units) and Growth Rate (2019-2025)
Figure 35. Europe Mid-IR Laser Crystal Sales and Growth Rate (2019-2025) & (K Units)
Figure 36. Europe Mid-IR Laser Crystal Sales Market Share by Country in 2023
Figure 37. Germany Mid-IR Laser Crystal Sales and Growth Rate (2019-2025) & (K Units)
Figure 38. France Mid-IR Laser Crystal Sales and Growth Rate (2019-2025) & (K Units)
Figure 39. U.K. Mid-IR Laser Crystal Sales and Growth Rate (2019-2025) & (K Units)
Figure 40. Italy Mid-IR Laser Crystal Sales and Growth Rate (2019-2025) & (K Units)
Figure 41. Russia Mid-IR Laser Crystal Sales and Growth Rate (2019-2025) & (K Units)
Figure 42. Asia Pacific Mid-IR Laser Crystal Sales and Growth Rate (K Units)
Figure 43. Asia Pacific Mid-IR Laser Crystal Sales Market Share by Region in 2023
Figure 44. China Mid-IR Laser Crystal Sales and Growth Rate (2019-2025) & (K Units)
Figure 45. Japan Mid-IR Laser Crystal Sales and Growth Rate (2019-2025) & (K Units)
Figure 46. South Korea Mid-IR Laser Crystal Sales and Growth Rate (2019-2025) & (K Units)
Figure 47. India Mid-IR Laser Crystal Sales and Growth Rate (2019-2025) & (K Units)
Figure 48. Southeast Asia Mid-IR Laser Crystal Sales and Growth Rate (2019-2025) & (K Units)
Figure 49. South America Mid-IR Laser Crystal Sales and Growth Rate (K Units)
Figure 50. South America Mid-IR Laser Crystal Sales Market Share by Country in 2023
Figure 51. Brazil Mid-IR Laser Crystal Sales and Growth Rate (2019-2025) & (K Units)
Figure 52. Argentina Mid-IR Laser Crystal Sales and Growth Rate (2019-2025) & (K Units)
Figure 53. Columbia Mid-IR Laser Crystal Sales and Growth Rate (2019-2025) & (K Units)
Figure 54. Middle East and Africa Mid-IR Laser Crystal Sales and Growth Rate (K Units)
Figure 55. Middle East and Africa Mid-IR Laser Crystal Sales Market Share by Region in 2023
Figure 56. Saudi Arabia Mid-IR Laser Crystal Sales and Growth Rate (2019-2025) & (K Units)
Figure 57. UAE Mid-IR Laser Crystal Sales and Growth Rate (2019-2025) & (K Units)
Figure 58. Egypt Mid-IR Laser Crystal Sales and Growth Rate (2019-2025) & (K Units)
Figure 59. Nigeria Mid-IR Laser Crystal Sales and Growth Rate (2019-2025) & (K Units)
Figure 60. South Africa Mid-IR Laser Crystal Sales and Growth Rate (2019-2025) & (K Units)
Figure 61. Global Mid-IR Laser Crystal Production Market Share by Region (2019-2025)
Figure 62. North America Mid-IR Laser Crystal Production (K Units) Growth Rate (2019-2025)
Figure 63. Europe Mid-IR Laser Crystal Production (K Units) Growth Rate (2019-2025)
Figure 64. Japan Mid-IR Laser Crystal Production (K Units) Growth Rate (2019-2025)
Figure 65. China Mid-IR Laser Crystal Production (K Units) Growth Rate (2019-2025)
Figure 66. Global Mid-IR Laser Crystal Sales Forecast by Volume (2019-2032) & (K Units)
Figure 67. Global Mid-IR Laser Crystal Market Size Forecast by Value (2019-2032) & (M USD)
Figure 68. Global Mid-IR Laser Crystal Sales Market Share Forecast by Type (2025-2032)
Figure 69. Global Mid-IR Laser Crystal Market Share Forecast by Type (2025-2032)
Figure 70. Global Mid-IR Laser Crystal Sales Forecast by Application (2025-2032)
Figure 71. Global Mid-IR Laser Crystal Market Share Forecast by Application (2025-2032)
