Micro Display Market, Emerging Trends, Technological Advancements, and Business Strategies 2025-2032

Micro Display Market was valued at USD 970 million in 2024 and is projected to reach USD 7.54 billion by 2032, exhibiting a CAGR of 34.9% during the forecast period

PDF Icon Download Sample Report PDF
  • Quick Dispatch

    All Orders

  • Secure Payment

    100% Secure Payment

Price range: $1,500.00 through $4,250.00

Clear

MARKET INSIGHTS

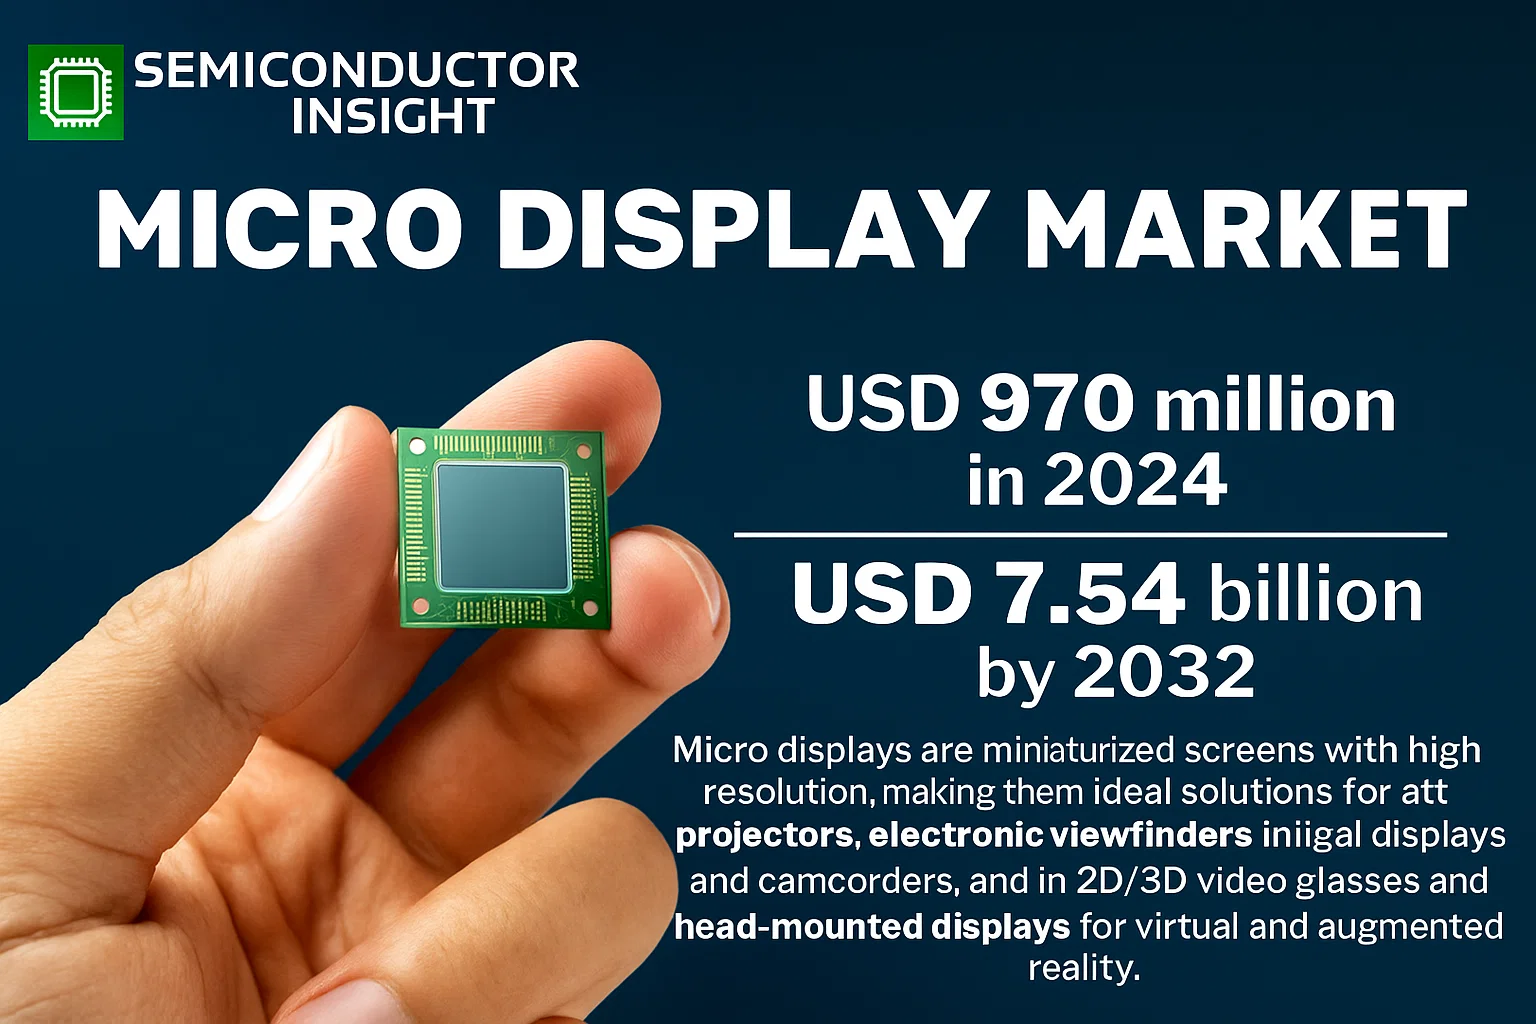
Global Micro Display Market was valued at USD 970 million in 2024 and is projected to reach USD 7.54 billion by 2032, exhibiting a CAGR of 34.9% during the forecast period. Micro displays are miniaturized screens with high resolution, making them ideal solutions for battery-powered portable systems and wearables. Their small size makes them useful for applications requiring compact displays, and they are already being used in products like projectors, electronic viewfinders in digital cameras and camcorders, and in 2D/3D video glasses and head-mounted displays for virtual and augmented reality.

The market’s rapid growth is driven by several factors, including the increasing adoption of augmented reality (AR) and virtual reality (VR) headsets across various industries, from gaming and entertainment to professional training and healthcare. The rising demand for high-resolution displays in consumer electronics, such as smartphones and smartwatches, also contributes to market expansion. Additionally, advancements in display technology, such as the development of OLED-on-silicon (OLEDoS) and microLED (mLED) technologies, are enabling higher pixel densities and better power efficiency, which is crucial for portable devices. The growing investment in semiconductor manufacturing and the expansion of the Internet of Things (IoT) ecosystem are further accelerating market growth.

Micro Display Market

MARKET DRIVERS

Rising Demand for High-Resolution Near-to-Eye Devices

The proliferation of Augmented Reality (AR) and Virtual Reality (VR) headsets is a primary driver for the micro display market. These devices require compact, high-pixel-density displays to create immersive visual experiences. The increasing adoption of AR/VR in consumer electronics, enterprise training, and healthcare applications is fueling significant demand for advanced micro displays like OLED-on-silicon and LCoS.

Advancements in Display Technology and Miniaturization

Continuous innovation in semiconductor and display technologies has enabled the production of smaller, more efficient, and brighter micro displays. Technologies such as MicroLED are emerging, offering superior brightness, contrast, and power efficiency compared to traditional LCD and OLED solutions. This technological progression is critical for applications in head-up displays (HUDs) for automotive and aviation, where performance and reliability are paramount.

The global market for micro displays is projected to grow at a compound annual growth rate of approximately 18% over the next five years, largely driven by the consumer electronics and automotive sectors.

Furthermore, the growing integration of micro displays in medical devices, such as digital eyepieces for surgical microscopes and wearable diagnostic tools, provides a steady stream of demand from a high-value industry.

MARKET CHALLENGES

High Manufacturing Costs and Complex Production Processes

The fabrication of micro displays involves highly complex and capital-intensive processes, such as silicon backplane manufacturing and precision assembly. This results in high per-unit costs, which can limit adoption in price-sensitive consumer markets and create significant barriers to entry for new players.

Other Challenges

Technical Limitations
Achieving high brightness and resolution while maintaining low power consumption and managing heat dissipation remains a significant technical hurdle, especially for micro displays used in bright ambient light conditions.

MARKET RESTRAINTS

Supply Chain Vulnerabilities and Component Shortages

The micro display market is susceptible to disruptions in the global supply chain for specialized materials and components, such as high-purity silicon wafers and rare-earth elements for phosphors. Geopolitical tensions and trade restrictions can exacerbate these vulnerabilities, leading to production delays and increased costs for manufacturers.

MARKET OPPORTUNITIES

Expansion into Automotive Augmented Reality

The automotive industry presents a substantial growth opportunity for micro displays, particularly with the development of augmented reality head-up displays (AR-HUDs). These systems project critical driving information onto the windshield, enhancing driver safety and experience. The trend towards autonomous and connected vehicles is expected to accelerate the adoption of this technology.

Micro Display Market Trends
Explosive Growth Fueled by Wearable and Immersive Technology

The global Micro Display market is experiencing unprecedented expansion, with a valuation of $970 million in 2024 that is projected to surge to approximately $7,543 million by 2032. This represents a remarkable compound annual growth rate (CAGR) of 34.9% during the forecast period. The primary driver of this growth is the escalating demand for compact, high-resolution display solutions in battery-powered portable systems and wearable devices. The critical advantage of micro displays lies in their miniaturized screen size, making them indispensable for applications where space is at a premium, such as in electronic viewfinders for digital cameras, advanced projectors, and head-mounted displays for virtual and augmented reality systems.

Other Trends

Dominance of OLED Technology and Consumer Electronics

In terms of product technology, OLED micro displays are the dominant segment, holding a market share exceeding 30%. Their superiority in contrast ratio, response time, and power efficiency makes them particularly well-suited for immersive applications like AR/VR headsets. Concurrently, the consumer electronics sector remains the largest application segment, accounting for over 35% of the market. This is a direct result of the proliferation of AR/VR hardware, smart glasses, and other personal viewing devices that rely on high-performance micro displays.

Consolidated Competitive Landscape and Regional Leadership

The competitive landscape is characterized by a high degree of concentration, with the top five players, including Sony Semiconductor Solutions Corporation, Seiko Epson Corporation, OmniVision, eMagin Corporation, and Kopin Corporation, collectively holding about 40% of the global market share. This concentration underscores the significant technological and capital barriers to entry in the high-precision manufacturing of micro displays. Geographically, Japan is the largest market, commanding a share of approximately 27%, supported by its strong consumer electronics and industrial base. It is closely followed by North America and China, which are major hubs for both the development and consumption of advanced display technologies.

Segmentation and Future Market Vectors

Beyond consumer electronics, other application segments such as military and defense, medical instruments, and industrial testing are contributing to market diversification. Each of these sectors leverages the unique benefits of micro displays for specialized equipment, from medical headlamps and surgical scopes to military helmet-mounted displays. Looking ahead, the market’s trajectory is firmly tied to the continued innovation in augmented and virtual reality, the evolution of wearable technology, and advancements in display technologies that offer higher resolutions and greater energy efficiency, ensuring the micro display market remains a dynamic and critical component of the broader electronics industry.

COMPETITIVE LANDSCAPE

Key Industry Players

A Market Shaped by Technological Innovation and Strategic Positioning

The global micro display market features a consolidated vendor landscape, with the top five players collectively commanding approximately 40% of the market share. Sony Semiconductor Solutions Corporation stands as the undisputed leader, leveraging its advanced OLED and LCoS (Liquid Crystal on Silicon) technologies to serve high-growth applications like AR/VR headsets, camera viewfinders, and high-end projectors. Its dominant position is reinforced by significant R&D investments and strong partnerships with major consumer electronics brands. Seiko Epson Corporation is another pivotal player, renowned for its high-temperature polysilicon (HTPS) LCD microdisplays, which are widely adopted in projectors and industrial equipment, cementing its role as a cornerstone of the market.

Beyond the top-tier leaders, numerous specialized and niche companies contribute significantly to the market’s diversity and innovation. Key players such as Kopin Corporation and eMagin Corporation are critical in advancing OLED microdisplay technology, particularly for demanding applications in military, aerospace, and medical devices where high brightness and resolution are paramount. OMNIVISION specializes in compact display solutions for consumer electronics, while several smaller or specialized firms like Dresden Microdisplay GmbH, Syndiant, and HOLOEYE Photonics AG focus on specific technologies like LCoS or applications in areas such as spectroscopy and holography. This diverse ecosystem of suppliers ensures robust competition and drives continuous technological improvement across different product segments and geographic regions.

List of Key Micro Display Companies Profiled

Segment Analysis:

Segment Category Sub-Segments Key Insights
By Type
  • OLED
  • LCoS
  • DLP
  • LCD
OLED technology is the dominant force in the micro display landscape, valued for its superior contrast ratios, deep blacks, and fast response times which are critical for high-quality imaging in near-eye applications. The self-emissive nature of OLEDs allows for thinner and more power-efficient displays, making them exceptionally well-suited for the demands of modern wearable technology, such as augmented and virtual reality headsets. While LCoS offers excellent resolution for projection systems and DLP is renowned for its color fidelity, the inherent advantages of OLED in compact form factors and visual performance solidify its leading position.
By Application
  • Consumer Electronics
  • Automotive And Transportation
  • Military And Defense
  • Medical Instruments
  • Industrial Testing
  • Others
Consumer Electronics represents the most significant application segment, driven by the widespread and growing adoption of microdisplays in AR/VR headsets, smart glasses, and advanced camera viewfinders. The relentless innovation in consumer gadgets, emphasizing portability and immersive user experiences, creates a powerful and continuous demand. Although segments like military and defense require high-reliability displays for critical applications and the automotive sector is increasingly integrating heads-up displays, the sheer volume and rapid evolution of consumer electronics products ensure this segment’s leadership, with technology companies continuously pushing the boundaries of miniaturization and performance.
By End User
  • Individual Consumers
  • Enterprises & Industrial
  • Government & Defense
Individual Consumers constitute the primary end-user group, as sales of personal electronic devices like VR gaming systems, augmented reality smart glasses, and high-end digital cameras directly target this demographic. The demand is fueled by the desire for cutting-edge technology, entertainment, and enhanced digital interaction. While enterprise and industrial users leverage microdisplays for specialized applications such as remote maintenance and design visualization, and government/defense sectors utilize them for training and simulation, the mass-market appeal and high-volume production for individual consumers drive the market’s scale and innovation cycles most prominently.
By Product Integration
  • Head-Mounted Displays
  • Projectors
  • Electronic Viewfinders
  • Others
Head-Mounted Displays are the leading product category for micro display integration, as they are the core component of both virtual reality and augmented reality systems that require high-resolution, low-latency visuals directly in the user’s field of view. The immersive nature of these applications demands the unique properties of microdisplays. Projectors benefit from microdisplay technology for creating portable, high-quality images, and electronic viewfinders in professional cameras rely on them for accurate previews, but the transformative and rapidly expanding market for AR/VR wearables firmly positions head-mounted displays as the key growth driver and leading integration point.
By Technology Innovation Focus
  • Resolution & Pixel Density
  • Power Efficiency
  • Brightness & Contrast
Resolution & Pixel Density is the paramount area of innovation, driven by the critical need to eliminate the screen-door effect and deliver crystal-clear, immersive visuals in near-eye applications like AR/VR. As these displays are viewed extremely closely, achieving ultra-high pixel density is essential for user comfort and realism. While advancements in power efficiency are crucial for extending battery life in portable devices and improvements in brightness are necessary for outdoor AR use, the relentless push for higher resolution remains the primary technical challenge and focus for industry leaders, directly impacting the quality of the user experience.

Regional Analysis: Micro Display Market

Asia-Pacific

The Asia-Pacific region stands as the undisputed leader in the global micro display market, driven by a powerful combination of manufacturing prowess, technological innovation, and immense consumer demand. The region, particularly countries like China, Japan, South Korea, and Taiwan, is home to the world’s leading manufacturers of micro displays and the consumer electronics that utilize them. This creates a robust and integrated supply chain that fuels rapid adoption and cost-effective production. The high density of technology companies focused on augmented reality (AR), virtual reality (VR) headsets, and high-resolution camera viewfinders provides a constant stream of demand and R&D investment. Furthermore, strong government support for technological advancement and the presence of a massive, tech-savvy population make Asia-Pacific the primary growth engine and innovation hub for micro display technologies, shaping global trends and product development cycles.

Manufacturing and Supply Chain Hub
The region’s dominance is heavily anchored in its unparalleled manufacturing infrastructure. It hosts the majority of global production facilities for key micro display technologies like LCoS, OLEDoS, and Micro-LED. This concentration allows for efficient scaling, rapid prototyping, and significant cost advantages, making it the preferred sourcing destination for global electronics brands. The deep integration of component suppliers and assembly plants creates a resilient and responsive ecosystem.
Consumer Electronics Innovation
Asia-Pacific is the epicenter for the development of consumer devices that are primary drivers of micro display demand. Major technology firms in the region are at the forefront of designing and marketing AR/VR headsets, high-end digital cameras, and wearable technology. This direct link between end-product innovation and the components they require creates a powerful, self-reinforcing cycle of demand and technological advancement for higher resolution and more efficient micro displays.
Strong R&D Investment
There is a sustained and significant investment in research and development from both corporate and governmental entities across the region. Companies are aggressively pursuing next-generation display technologies to gain a competitive edge, focusing on improving pixel density, brightness, and energy efficiency. Government initiatives often support these efforts, recognizing micro displays as a critical technology for future economic leadership in the digital and industrial sectors.
Vast and Eager Market Base
The region contains the world’s largest and fastest-adopting market for new technologies. A young, urban, and increasingly affluent population demonstrates a strong appetite for advanced electronic products featuring micro displays. This large internal market provides a solid foundation for sales volume, allowing manufacturers to achieve economies of scale and test new products before a global rollout, further cementing the region’s leading position.

North America
North America represents a highly influential and technologically advanced market for micro displays, characterized by strong demand from both enterprise and consumer sectors. The region is a hub for pioneering AR and VR software development and is home to major technology giants that drive innovation in head-mounted displays for gaming, enterprise training, and healthcare applications. Significant investment in defense and aerospace sectors also fuels demand for high-performance micro displays used in head-up displays (HUDs) and night vision systems. While manufacturing is less concentrated than in Asia-Pacific, North America’s strength lies in its cutting-edge R&D, strong intellectual property creation, and the presence of early adopter markets that set global trends for product features and applications.

Europe
Europe maintains a strong position in the micro display market, with a focus on high-value, specialized applications. The region exhibits robust demand in the automotive industry for advanced dashboard displays and HUDs, as well as in the medical field for sophisticated surgical and diagnostic equipment. European companies are renowned for their engineering excellence and often lead in niche segments requiring high reliability and precision, such as industrial automation and scientific instrumentation. Collaboration between academic institutions and industry fosters innovation, particularly in developing energy-efficient and high-resolution display solutions. The market is characterized by stringent quality standards and a steady demand for premium technological components.

South America
The micro display market in South America is an emerging region with growth potential largely tied to the gradual adoption of newer technologies. The market is currently dominated by demand for consumer electronics, such as smartphones and televisions, with the adoption of AR/VR and other advanced applications still in earlier stages. Economic fluctuations can impact the pace of investment and consumer spending on high-tech goods. However, increasing digitalization efforts and a growing middle class present future opportunities for market expansion, particularly in urban centers where technology adoption rates are higher and there is growing interest in entertainment and educational applications utilizing micro displays.

Middle East & Africa
The Middle East & Africa region presents a diverse and developing landscape for the micro display market. Wealthier Gulf Cooperation Council (GCC) countries are investing in smart city initiatives, defense systems, and luxury entertainment, creating demand for high-end display solutions. In contrast, broader market growth across Africa is more gradual, driven primarily by the expanding mobile phone market and increasing internet penetration. The region’s overall potential is significant but uneven, with adoption heavily dependent on economic development, infrastructure investment, and the localization of technology distribution channels. The focus is often on durable and cost-effective display solutions suitable for specific local conditions.

Report Scope

This market research report provides a comprehensive analysis of the Micro Display Market , covering the forecast period 2025–2032. It offers detailed insights into market dynamics, technological advancements, competitive landscape, and key trends shaping the industry.

Key focus areas of the report include:

  • Market Overview: The report begins with an overview outlining its current market scenario, key growth indicators, and industry transformation drivers. It discusses macroeconomic factors, demand–supply balance, regulatory landscape, and the strategic role of semiconductors in powering advancements across industries such as automotive, telecommunications, consumer electronics, and industrial automation.
  • Market Size & Forecast: Historical data and future projections for revenue, unit shipments, and market value across major regions and segments.
  • Segmentation Analysis: Detailed breakdown by product type, technology, application, and end-user industry to identify high-growth segments and investment opportunities.
  • Regional Insights: Insights into market performance across North America, Europe, Asia-Pacific, Latin America, and the Middle East & Africa, including country-level analysis where relevant.
  • Competitive Landscape: Profiles of leading market participants, including their product offerings, R&D focus, manufacturing capacity, pricing strategies, and recent developments such as mergers, acquisitions, and partnerships.
  • Technology Trends & Innovation: Assessment of emerging technologies, integration of AI/IoT, semiconductor design trends, fabrication techniques, and evolving industry standards.
  • Market Drivers & Restraints: Evaluation of factors driving market growth along with challenges, supply chain constraints, regulatory issues, and market-entry barriers.
  • Stakeholder Insights: Insights for component suppliers, OEMs, system integrators, investors, and policymakers regarding the evolving ecosystem and strategic opportunities.

Primary and secondary research methods are employed, including interviews with industry experts, data from verified sources, and real-time market intelligence to ensure the accuracy and reliability of the insights presented.

FREQUENTLY ASKED QUESTIONS:

What is the current market size of Micro Display Market?

-> Global Micro Display Market was valued at USD 970 million in 2024 and is projected to reach USD 7543 million by 2032, growing at a CAGR of 34.9% during the forecast period.

Which key companies operate in Micro Display Market?

-> Key players include Sony Semiconductor Solutions Corporation, Seiko Epson Corporation, OmniVision, eMagin Corporation, and Kopin Corporation, among others. The top 5 players hold a combined market share of about 40%.

What are the key growth drivers?

-> Key growth drivers include the demand for miniaturized screen size and high resolution in battery-powered portable systems and wearables, and expanding use in products like projectors, electronic viewfinders, and head-mounted displays for virtual and augmented reality.

Which region dominates the market?

-> Japan is the largest market, with a share of about 27%, followed by North America and China.

What are the emerging trends?

-> Emerging trends include the dominance of OLED technology (over 30% share) and the significant market share of the consumer electronics application segment (over 35%).

Micro Display Market, Emerging Trends, Technological Advancements, and Business Strategies 2025-2032

Get Sample Report PDF for Exclusive Insights

Report Sample Includes

  • Table of Contents
  • List of Tables & Figures
  • Charts, Research Methodology, and more...
PDF Icon Download Sample Report PDF

Download Sample Report

Table of Content

1 Introduction to Research & Analysis Reports
1.1 Micro Display Market Definition
1.2 Market Segments
1.2.1 Segment by Type
1.2.2 Segment by Application
1.3 Global Micro Display Market Overview
1.4 Features & Benefits of This Report
1.5 Methodology & Sources of Information
1.5.1 Research Methodology
1.5.2 Research Process
1.5.3 Base Year
1.5.4 Report Assumptions & Caveats
2 Global Micro Display Overall Market Size
2.1 Global Micro Display Market Size: 2024 VS 2031
2.2 Global Micro Display Market Size, Prospects & Forecasts: 2020-2031
2.3 Global Micro Display Sales: 2020-2031
3 Company Landscape
3.1 Top Micro Display Players in Global Market
3.2 Top Global Micro Display Companies Ranked by Revenue
3.3 Global Micro Display Revenue by Companies
3.4 Global Micro Display Sales by Companies
3.5 Global Micro Display Price by Manufacturer (2020-2025)
3.6 Top 3 and Top 5 Micro Display Companies in Global Market, by Revenue in 2024
3.7 Global Manufacturers Micro Display Product Type
3.8 Tier 1, Tier 2, and Tier 3 Micro Display Players in Global Market
3.8.1 List of Global Tier 1 Micro Display Companies
3.8.2 List of Global Tier 2 and Tier 3 Micro Display Companies
4 Sights by Product
4.1 Overview
4.1.1 Segment by Type – Global Micro Display Market Size Markets, 2024 & 2031
4.1.2 OLED
4.1.3 LCoS
4.1.4 DLP
4.1.5 LCD
4.2 Segment by Type – Global Micro Display Revenue & Forecasts
4.2.1 Segment by Type – Global Micro Display Revenue, 2020-2025
4.2.2 Segment by Type – Global Micro Display Revenue, 2026-2031
4.2.3 Segment by Type – Global Micro Display Revenue Market Share, 2020-2031
4.3 Segment by Type – Global Micro Display Sales & Forecasts
4.3.1 Segment by Type – Global Micro Display Sales, 2020-2025
4.3.2 Segment by Type – Global Micro Display Sales, 2026-2031
4.3.3 Segment by Type – Global Micro Display Sales Market Share, 2020-2031
4.4 Segment by Type – Global Micro Display Price (Manufacturers Selling Prices), 2020-2031
5 Sights by Application
5.1 Overview
5.1.1 Segment by Application – Global Micro Display Market Size, 2024 & 2031
5.1.2 Consumer Electronics
5.1.3 Automotive And Transportation
5.1.4 Military And Defense
5.1.5 Medical Instruments
5.1.6 Industrial Testing
5.1.7 Others
5.2 Segment by Application – Global Micro Display Revenue & Forecasts
5.2.1 Segment by Application – Global Micro Display Revenue, 2020-2025
5.2.2 Segment by Application – Global Micro Display Revenue, 2026-2031
5.2.3 Segment by Application – Global Micro Display Revenue Market Share, 2020-2031
5.3 Segment by Application – Global Micro Display Sales & Forecasts
5.3.1 Segment by Application – Global Micro Display Sales, 2020-2025
5.3.2 Segment by Application – Global Micro Display Sales, 2026-2031
5.3.3 Segment by Application – Global Micro Display Sales Market Share, 2020-2031
5.4 Segment by Application – Global Micro Display Price (Manufacturers Selling Prices), 2020-2031
6 Sights by Region
6.1 By Region – Global Micro Display Market Size, 2024 & 2031
6.2 By Region – Global Micro Display Revenue & Forecasts
6.2.1 By Region – Global Micro Display Revenue, 2020-2025
6.2.2 By Region – Global Micro Display Revenue, 2026-2031
6.2.3 By Region – Global Micro Display Revenue Market Share, 2020-2031
6.3 By Region – Global Micro Display Sales & Forecasts
6.3.1 By Region – Global Micro Display Sales, 2020-2025
6.3.2 By Region – Global Micro Display Sales, 2026-2031
6.3.3 By Region – Global Micro Display Sales Market Share, 2020-2031
6.4 North America
6.4.1 By Country – North America Micro Display Revenue, 2020-2031
6.4.2 By Country – North America Micro Display Sales, 2020-2031
6.4.3 United States Micro Display Market Size, 2020-2031
6.4.4 Canada Micro Display Market Size, 2020-2031
6.4.5 Mexico Micro Display Market Size, 2020-2031
6.5 Europe
6.5.1 By Country – Europe Micro Display Revenue, 2020-2031
6.5.2 By Country – Europe Micro Display Sales, 2020-2031
6.5.3 Germany Micro Display Market Size, 2020-2031
6.5.4 France Micro Display Market Size, 2020-2031
6.5.5 U.K. Micro Display Market Size, 2020-2031
6.5.6 Italy Micro Display Market Size, 2020-2031
6.5.7 Russia Micro Display Market Size, 2020-2031
6.5.8 Nordic Countries Micro Display Market Size, 2020-2031
6.5.9 Benelux Micro Display Market Size, 2020-2031
6.6 Asia
6.6.1 By Region – Asia Micro Display Revenue, 2020-2031
6.6.2 By Region – Asia Micro Display Sales, 2020-2031
6.6.3 China Micro Display Market Size, 2020-2031
6.6.4 Japan Micro Display Market Size, 2020-2031
6.6.5 South Korea Micro Display Market Size, 2020-2031
6.6.6 Southeast Asia Micro Display Market Size, 2020-2031
6.6.7 India Micro Display Market Size, 2020-2031
6.7 South America
6.7.1 By Country – South America Micro Display Revenue, 2020-2031
6.7.2 By Country – South America Micro Display Sales, 2020-2031
6.7.3 Brazil Micro Display Market Size, 2020-2031
6.7.4 Argentina Micro Display Market Size, 2020-2031
6.8 Middle East & Africa
6.8.1 By Country – Middle East & Africa Micro Display Revenue, 2020-2031
6.8.2 By Country – Middle East & Africa Micro Display Sales, 2020-2031
6.8.3 Turkey Micro Display Market Size, 2020-2031
6.8.4 Israel Micro Display Market Size, 2020-2031
6.8.5 Saudi Arabia Micro Display Market Size, 2020-2031
6.8.6 UAE Micro Display Market Size, 2020-2031
7 Manufacturers & Brands Profiles
7.1 Sony
7.1.1 Sony Company Summary
7.1.2 Sony Business Overview
7.1.3 Sony Micro Display Major Product Offerings
7.1.4 Sony Micro Display Sales and Revenue in Global (2020-2025)
7.1.5 Sony Key News & Latest Developments
7.2 Seiko Epson
7.2.1 Seiko Epson Company Summary
7.2.2 Seiko Epson Business Overview
7.2.3 Seiko Epson Micro Display Major Product Offerings
7.2.4 Seiko Epson Micro Display Sales and Revenue in Global (2020-2025)
7.2.5 Seiko Epson Key News & Latest Developments
7.3 OMNIVISION
7.3.1 OMNIVISION Company Summary
7.3.2 OMNIVISION Business Overview
7.3.3 OMNIVISION Micro Display Major Product Offerings
7.3.4 OMNIVISION Micro Display Sales and Revenue in Global (2020-2025)
7.3.5 OMNIVISION Key News & Latest Developments
7.4 eMagin Corporation
7.4.1 eMagin Corporation Company Summary
7.4.2 eMagin Corporation Business Overview
7.4.3 eMagin Corporation Micro Display Major Product Offerings
7.4.4 eMagin Corporation Micro Display Sales and Revenue in Global (2020-2025)
7.4.5 eMagin Corporation Key News & Latest Developments
7.5 OLiGHTEK Opto-Electronic
7.5.1 OLiGHTEK Opto-Electronic Company Summary
7.5.2 OLiGHTEK Opto-Electronic Business Overview
7.5.3 OLiGHTEK Opto-Electronic Micro Display Major Product Offerings
7.5.4 OLiGHTEK Opto-Electronic Micro Display Sales and Revenue in Global (2020-2025)
7.5.5 OLiGHTEK Opto-Electronic Key News & Latest Developments
7.6 Kopin Corporation
7.6.1 Kopin Corporation Company Summary
7.6.2 Kopin Corporation Business Overview
7.6.3 Kopin Corporation Micro Display Major Product Offerings
7.6.4 Kopin Corporation Micro Display Sales and Revenue in Global (2020-2025)
7.6.5 Kopin Corporation Key News & Latest Developments
7.7 Microoled
7.7.1 Microoled Company Summary
7.7.2 Microoled Business Overview
7.7.3 Microoled Micro Display Major Product Offerings
7.7.4 Microoled Micro Display Sales and Revenue in Global (2020-2025)
7.7.5 Microoled Key News & Latest Developments
7.8 RAONTECH
7.8.1 RAONTECH Company Summary
7.8.2 RAONTECH Business Overview
7.8.3 RAONTECH Micro Display Major Product Offerings
7.8.4 RAONTECH Micro Display Sales and Revenue in Global (2020-2025)
7.8.5 RAONTECH Key News & Latest Developments
7.9 Jasper Display Corp
7.9.1 Jasper Display Corp Company Summary
7.9.2 Jasper Display Corp Business Overview
7.9.3 Jasper Display Corp Micro Display Major Product Offerings
7.9.4 Jasper Display Corp Micro Display Sales and Revenue in Global (2020-2025)
7.9.5 Jasper Display Corp Key News & Latest Developments
7.10 Dresden Microdisplay GmbH
7.10.1 Dresden Microdisplay GmbH Company Summary
7.10.2 Dresden Microdisplay GmbH Business Overview
7.10.3 Dresden Microdisplay GmbH Micro Display Major Product Offerings
7.10.4 Dresden Microdisplay GmbH Micro Display Sales and Revenue in Global (2020-2025)
7.10.5 Dresden Microdisplay GmbH Key News & Latest Developments
7.11 Syndiant
7.11.1 Syndiant Company Summary
7.11.2 Syndiant Business Overview
7.11.3 Syndiant Micro Display Major Product Offerings
7.11.4 Syndiant Micro Display Sales and Revenue in Global (2020-2025)
7.11.5 Syndiant Key News & Latest Developments
7.12 HOLOEYE Photonics AG
7.12.1 HOLOEYE Photonics AG Company Summary
7.12.2 HOLOEYE Photonics AG Business Overview
7.12.3 HOLOEYE Photonics AG Micro Display Major Product Offerings
7.12.4 HOLOEYE Photonics AG Micro Display Sales and Revenue in Global (2020-2025)
7.12.5 HOLOEYE Photonics AG Key News & Latest Developments
7.13 Guo Zhao Optoelectronics
7.13.1 Guo Zhao Optoelectronics Company Summary
7.13.2 Guo Zhao Optoelectronics Business Overview
7.13.3 Guo Zhao Optoelectronics Micro Display Major Product Offerings
7.13.4 Guo Zhao Optoelectronics Micro Display Sales and Revenue in Global (2020-2025)
7.13.5 Guo Zhao Optoelectronics Key News & Latest Developments
7.14 Semiconductor Integrated Display Technology
7.14.1 Semiconductor Integrated Display Technology Company Summary
7.14.2 Semiconductor Integrated Display Technology Business Overview
7.14.3 Semiconductor Integrated Display Technology Micro Display Major Product Offerings
7.14.4 Semiconductor Integrated Display Technology Micro Display Sales and Revenue in Global (2020-2025)
7.14.5 Semiconductor Integrated Display Technology Key News & Latest Developments
7.15 SeeYA Technology
7.15.1 SeeYA Technology Company Summary
7.15.2 SeeYA Technology Business Overview
7.15.3 SeeYA Technology Micro Display Major Product Offerings
7.15.4 SeeYA Technology Micro Display Sales and Revenue in Global (2020-2025)
7.15.5 SeeYA Technology Key News & Latest Developments
8 Global Micro Display Production Capacity, Analysis
8.1 Global Micro Display Production Capacity, 2020-2031
8.2 Micro Display Production Capacity of Key Manufacturers in Global Market
8.3 Global Micro Display Production by Region
9 Key Market Trends, Opportunity, Drivers and Restraints
9.1 Market Opportunities & Trends
9.2 Market Drivers
9.3 Market Restraints
10 Micro Display Supply Chain Analysis
10.1 Micro Display Industry Value Chain
10.2 Micro Display Upstream Market
10.3 Micro Display Downstream and Clients
10.4 Marketing Channels Analysis
10.4.1 Marketing Channels
10.4.2 Micro Display Distributors and Sales Agents in Global
11 Conclusion
12 Appendix
12.1 Note
12.2 Examples of Clients
12.3 DisclaimerList of Tables
Table 1. Key Players of Micro Display in Global Market
Table 2. Top Micro Display Players in Global Market, Ranking by Revenue (2024)
Table 3. Global Micro Display Revenue by Companies, (US$, Mn), 2020-2025
Table 4. Global Micro Display Revenue Share by Companies, 2020-2025
Table 5. Global Micro Display Sales by Companies, (K Pcs), 2020-2025
Table 6. Global Micro Display Sales Share by Companies, 2020-2025
Table 7. Key Manufacturers Micro Display Price (2020-2025) & (US$/Pcs)
Table 8. Global Manufacturers Micro Display Product Type
Table 9. List of Global Tier 1 Micro Display Companies, Revenue (US$, Mn) in 2024 and Market Share
Table 10. List of Global Tier 2 and Tier 3 Micro Display Companies, Revenue (US$, Mn) in 2024 and Market Share
Table 11. Segment by Type – Global Micro Display Revenue, (US$, Mn), 2024 & 2031
Table 12. Segment by Type – Global Micro Display Revenue (US$, Mn), 2020-2025
Table 13. Segment by Type – Global Micro Display Revenue (US$, Mn), 2026-2031
Table 14. Segment by Type – Global Micro Display Sales (K Pcs), 2020-2025
Table 15. Segment by Type – Global Micro Display Sales (K Pcs), 2026-2031
Table 16. Segment by Application – Global Micro Display Revenue, (US$, Mn), 2024 & 2031
Table 17. Segment by Application – Global Micro Display Revenue, (US$, Mn), 2020-2025
Table 18. Segment by Application – Global Micro Display Revenue, (US$, Mn), 2026-2031
Table 19. Segment by Application – Global Micro Display Sales, (K Pcs), 2020-2025
Table 20. Segment by Application – Global Micro Display Sales, (K Pcs), 2026-2031
Table 21. By Region – Global Micro Display Revenue, (US$, Mn), 2025-2031
Table 22. By Region – Global Micro Display Revenue, (US$, Mn), 2020-2025
Table 23. By Region – Global Micro Display Revenue, (US$, Mn), 2026-2031
Table 24. By Region – Global Micro Display Sales, (K Pcs), 2020-2025
Table 25. By Region – Global Micro Display Sales, (K Pcs), 2026-2031
Table 26. By Country – North America Micro Display Revenue, (US$, Mn), 2020-2025
Table 27. By Country – North America Micro Display Revenue, (US$, Mn), 2026-2031
Table 28. By Country – North America Micro Display Sales, (K Pcs), 2020-2025
Table 29. By Country – North America Micro Display Sales, (K Pcs), 2026-2031
Table 30. By Country – Europe Micro Display Revenue, (US$, Mn), 2020-2025
Table 31. By Country – Europe Micro Display Revenue, (US$, Mn), 2026-2031
Table 32. By Country – Europe Micro Display Sales, (K Pcs), 2020-2025
Table 33. By Country – Europe Micro Display Sales, (K Pcs), 2026-2031
Table 34. By Region – Asia Micro Display Revenue, (US$, Mn), 2020-2025
Table 35. By Region – Asia Micro Display Revenue, (US$, Mn), 2026-2031
Table 36. By Region – Asia Micro Display Sales, (K Pcs), 2020-2025
Table 37. By Region – Asia Micro Display Sales, (K Pcs), 2026-2031
Table 38. By Country – South America Micro Display Revenue, (US$, Mn), 2020-2025
Table 39. By Country – South America Micro Display Revenue, (US$, Mn), 2026-2031
Table 40. By Country – South America Micro Display Sales, (K Pcs), 2020-2025
Table 41. By Country – South America Micro Display Sales, (K Pcs), 2026-2031
Table 42. By Country – Middle East & Africa Micro Display Revenue, (US$, Mn), 2020-2025
Table 43. By Country – Middle East & Africa Micro Display Revenue, (US$, Mn), 2026-2031
Table 44. By Country – Middle East & Africa Micro Display Sales, (K Pcs), 2020-2025
Table 45. By Country – Middle East & Africa Micro Display Sales, (K Pcs), 2026-2031
Table 46. Sony Company Summary
Table 47. Sony Micro Display Product Offerings
Table 48. Sony Micro Display Sales (K Pcs), Revenue (US$, Mn) and Average Price (US$/Pcs) & (2020-2025)
Table 49. Sony Key News & Latest Developments
Table 50. Seiko Epson Company Summary
Table 51. Seiko Epson Micro Display Product Offerings
Table 52. Seiko Epson Micro Display Sales (K Pcs), Revenue (US$, Mn) and Average Price (US$/Pcs) & (2020-2025)
Table 53. Seiko Epson Key News & Latest Developments
Table 54. OMNIVISION Company Summary
Table 55. OMNIVISION Micro Display Product Offerings
Table 56. OMNIVISION Micro Display Sales (K Pcs), Revenue (US$, Mn) and Average Price (US$/Pcs) & (2020-2025)
Table 57. OMNIVISION Key News & Latest Developments
Table 58. eMagin Corporation Company Summary
Table 59. eMagin Corporation Micro Display Product Offerings
Table 60. eMagin Corporation Micro Display Sales (K Pcs), Revenue (US$, Mn) and Average Price (US$/Pcs) & (2020-2025)
Table 61. eMagin Corporation Key News & Latest Developments
Table 62. OLiGHTEK Opto-Electronic Company Summary
Table 63. OLiGHTEK Opto-Electronic Micro Display Product Offerings
Table 64. OLiGHTEK Opto-Electronic Micro Display Sales (K Pcs), Revenue (US$, Mn) and Average Price (US$/Pcs) & (2020-2025)
Table 65. OLiGHTEK Opto-Electronic Key News & Latest Developments
Table 66. Kopin Corporation Company Summary
Table 67. Kopin Corporation Micro Display Product Offerings
Table 68. Kopin Corporation Micro Display Sales (K Pcs), Revenue (US$, Mn) and Average Price (US$/Pcs) & (2020-2025)
Table 69. Kopin Corporation Key News & Latest Developments
Table 70. Microoled Company Summary
Table 71. Microoled Micro Display Product Offerings
Table 72. Microoled Micro Display Sales (K Pcs), Revenue (US$, Mn) and Average Price (US$/Pcs) & (2020-2025)
Table 73. Microoled Key News & Latest Developments
Table 74. RAONTECH Company Summary
Table 75. RAONTECH Micro Display Product Offerings
Table 76. RAONTECH Micro Display Sales (K Pcs), Revenue (US$, Mn) and Average Price (US$/Pcs) & (2020-2025)
Table 77. RAONTECH Key News & Latest Developments
Table 78. Jasper Display Corp Company Summary
Table 79. Jasper Display Corp Micro Display Product Offerings
Table 80. Jasper Display Corp Micro Display Sales (K Pcs), Revenue (US$, Mn) and Average Price (US$/Pcs) & (2020-2025)
Table 81. Jasper Display Corp Key News & Latest Developments
Table 82. Dresden Microdisplay GmbH Company Summary
Table 83. Dresden Microdisplay GmbH Micro Display Product Offerings
Table 84. Dresden Microdisplay GmbH Micro Display Sales (K Pcs), Revenue (US$, Mn) and Average Price (US$/Pcs) & (2020-2025)
Table 85. Dresden Microdisplay GmbH Key News & Latest Developments
Table 86. Syndiant Company Summary
Table 87. Syndiant Micro Display Product Offerings
Table 88. Syndiant Micro Display Sales (K Pcs), Revenue (US$, Mn) and Average Price (US$/Pcs) & (2020-2025)
Table 89. Syndiant Key News & Latest Developments
Table 90. HOLOEYE Photonics AG Company Summary
Table 91. HOLOEYE Photonics AG Micro Display Product Offerings
Table 92. HOLOEYE Photonics AG Micro Display Sales (K Pcs), Revenue (US$, Mn) and Average Price (US$/Pcs) & (2020-2025)
Table 93. HOLOEYE Photonics AG Key News & Latest Developments
Table 94. Guo Zhao Optoelectronics Company Summary
Table 95. Guo Zhao Optoelectronics Micro Display Product Offerings
Table 96. Guo Zhao Optoelectronics Micro Display Sales (K Pcs), Revenue (US$, Mn) and Average Price (US$/Pcs) & (2020-2025)
Table 97. Guo Zhao Optoelectronics Key News & Latest Developments
Table 98. Semiconductor Integrated Display Technology Company Summary
Table 99. Semiconductor Integrated Display Technology Micro Display Product Offerings
Table 100. Semiconductor Integrated Display Technology Micro Display Sales (K Pcs), Revenue (US$, Mn) and Average Price (US$/Pcs) & (2020-2025)
Table 101. Semiconductor Integrated Display Technology Key News & Latest Developments
Table 102. SeeYA Technology Company Summary
Table 103. SeeYA Technology Micro Display Product Offerings
Table 104. SeeYA Technology Micro Display Sales (K Pcs), Revenue (US$, Mn) and Average Price (US$/Pcs) & (2020-2025)
Table 105. SeeYA Technology Key News & Latest Developments
Table 106. Micro Display Capacity of Key Manufacturers in Global Market, 2023-2025 (K Pcs)
Table 107. Global Micro Display Capacity Market Share of Key Manufacturers, 2023-2025
Table 108. Global Micro Display Production by Region, 2020-2025 (K Pcs)
Table 109. Global Micro Display Production by Region, 2026-2031 (K Pcs)
Table 110. Micro Display Market Opportunities & Trends in Global Market
Table 111. Micro Display Market Drivers in Global Market
Table 112. Micro Display Market Restraints in Global Market
Table 113. Micro Display Raw Materials
Table 114. Micro Display Raw Materials Suppliers in Global Market
Table 115. Typical Micro Display Downstream
Table 116. Micro Display Downstream Clients in Global Market
Table 117. Micro Display Distributors and Sales Agents in Global Market

List of Figures
Figure 1. Micro Display Product Picture
Figure 2. Micro Display Segment by Type in 2024
Figure 3. Micro Display Segment by Application in 2024
Figure 4. Global Micro Display Market Overview: 2024
Figure 5. Key Caveats
Figure 6. Global Micro Display Market Size: 2024 VS 2031 (US$, Mn)
Figure 7. Global Micro Display Revenue: 2020-2031 (US$, Mn)
Figure 8. Micro Display Sales in Global Market: 2020-2031 (K Pcs)
Figure 9. The Top 3 and 5 Players Market Share by Micro Display Revenue in 2024
Figure 10. Segment by Type – Global Micro Display Revenue, (US$, Mn), 2024 & 2031
Figure 11. Segment by Type – Global Micro Display Revenue Market Share, 2020-2031
Figure 12. Segment by Type – Global Micro Display Sales Market Share, 2020-2031
Figure 13. Segment by Type – Global Micro Display Price (US$/Pcs), 2020-2031
Figure 14. Segment by Application – Global Micro Display Revenue, (US$, Mn), 2024 & 2031
Figure 15. Segment by Application – Global Micro Display Revenue Market Share, 2020-2031
Figure 16. Segment by Application – Global Micro Display Sales Market Share, 2020-2031
Figure 17. Segment by Application -Global Micro Display Price (US$/Pcs), 2020-2031
Figure 18. By Region – Global Micro Display Revenue, (US$, Mn), 2025 & 2031
Figure 19. By Region – Global Micro Display Revenue Market Share, 2020 VS 2024 VS 2031
Figure 20. By Region – Global Micro Display Revenue Market Share, 2020-2031
Figure 21. By Region – Global Micro Display Sales Market Share, 2020-2031
Figure 22. By Country – North America Micro Display Revenue Market Share, 2020-2031
Figure 23. By Country – North America Micro Display Sales Market Share, 2020-2031
Figure 24. United States Micro Display Revenue, (US$, Mn), 2020-2031
Figure 25. Canada Micro Display Revenue, (US$, Mn), 2020-2031
Figure 26. Mexico Micro Display Revenue, (US$, Mn), 2020-2031
Figure 27. By Country – Europe Micro Display Revenue Market Share, 2020-2031
Figure 28. By Country – Europe Micro Display Sales Market Share, 2020-2031
Figure 29. Germany Micro Display Revenue, (US$, Mn), 2020-2031
Figure 30. France Micro Display Revenue, (US$, Mn), 2020-2031
Figure 31. U.K. Micro Display Revenue, (US$, Mn), 2020-2031
Figure 32. Italy Micro Display Revenue, (US$, Mn), 2020-2031
Figure 33. Russia Micro Display Revenue, (US$, Mn), 2020-2031
Figure 34. Nordic Countries Micro Display Revenue, (US$, Mn), 2020-2031
Figure 35. Benelux Micro Display Revenue, (US$, Mn), 2020-2031
Figure 36. By Region – Asia Micro Display Revenue Market Share, 2020-2031
Figure 37. By Region – Asia Micro Display Sales Market Share, 2020-2031
Figure 38. China Micro Display Revenue, (US$, Mn), 2020-2031
Figure 39. Japan Micro Display Revenue, (US$, Mn), 2020-2031
Figure 40. South Korea Micro Display Revenue, (US$, Mn), 2020-2031
Figure 41. Southeast Asia Micro Display Revenue, (US$, Mn), 2020-2031
Figure 42. India Micro Display Revenue, (US$, Mn), 2020-2031
Figure 43. By Country – South America Micro Display Revenue Market Share, 2020-2031
Figure 44. By Country – South America Micro Display Sales, Market Share, 2020-2031
Figure 45. Brazil Micro Display Revenue, (US$, Mn), 2020-2031
Figure 46. Argentina Micro Display Revenue, (US$, Mn), 2020-2031
Figure 47. By Country – Middle East & Africa Micro Display Revenue, Market Share, 2020-2031
Figure 48. By Country – Middle East & Africa Micro Display Sales, Market Share, 2020-2031
Figure 49. Turkey Micro Display Revenue, (US$, Mn), 2020-2031
Figure 50. Israel Micro Display Revenue, (US$, Mn), 2020-2031
Figure 51. Saudi Arabia Micro Display Revenue, (US$, Mn), 2020-2031
Figure 52. UAE Micro Display Revenue, (US$, Mn), 2020-2031
Figure 53. Global Micro Display Production Capacity (K Pcs), 2020-2031
Figure 54. The Percentage of Production Micro Display by Region, 2024 VS 2031
Figure 55. Micro Display Industry Value Chain
Figure 56. Marketing Channels