MARKET INSIGHTS
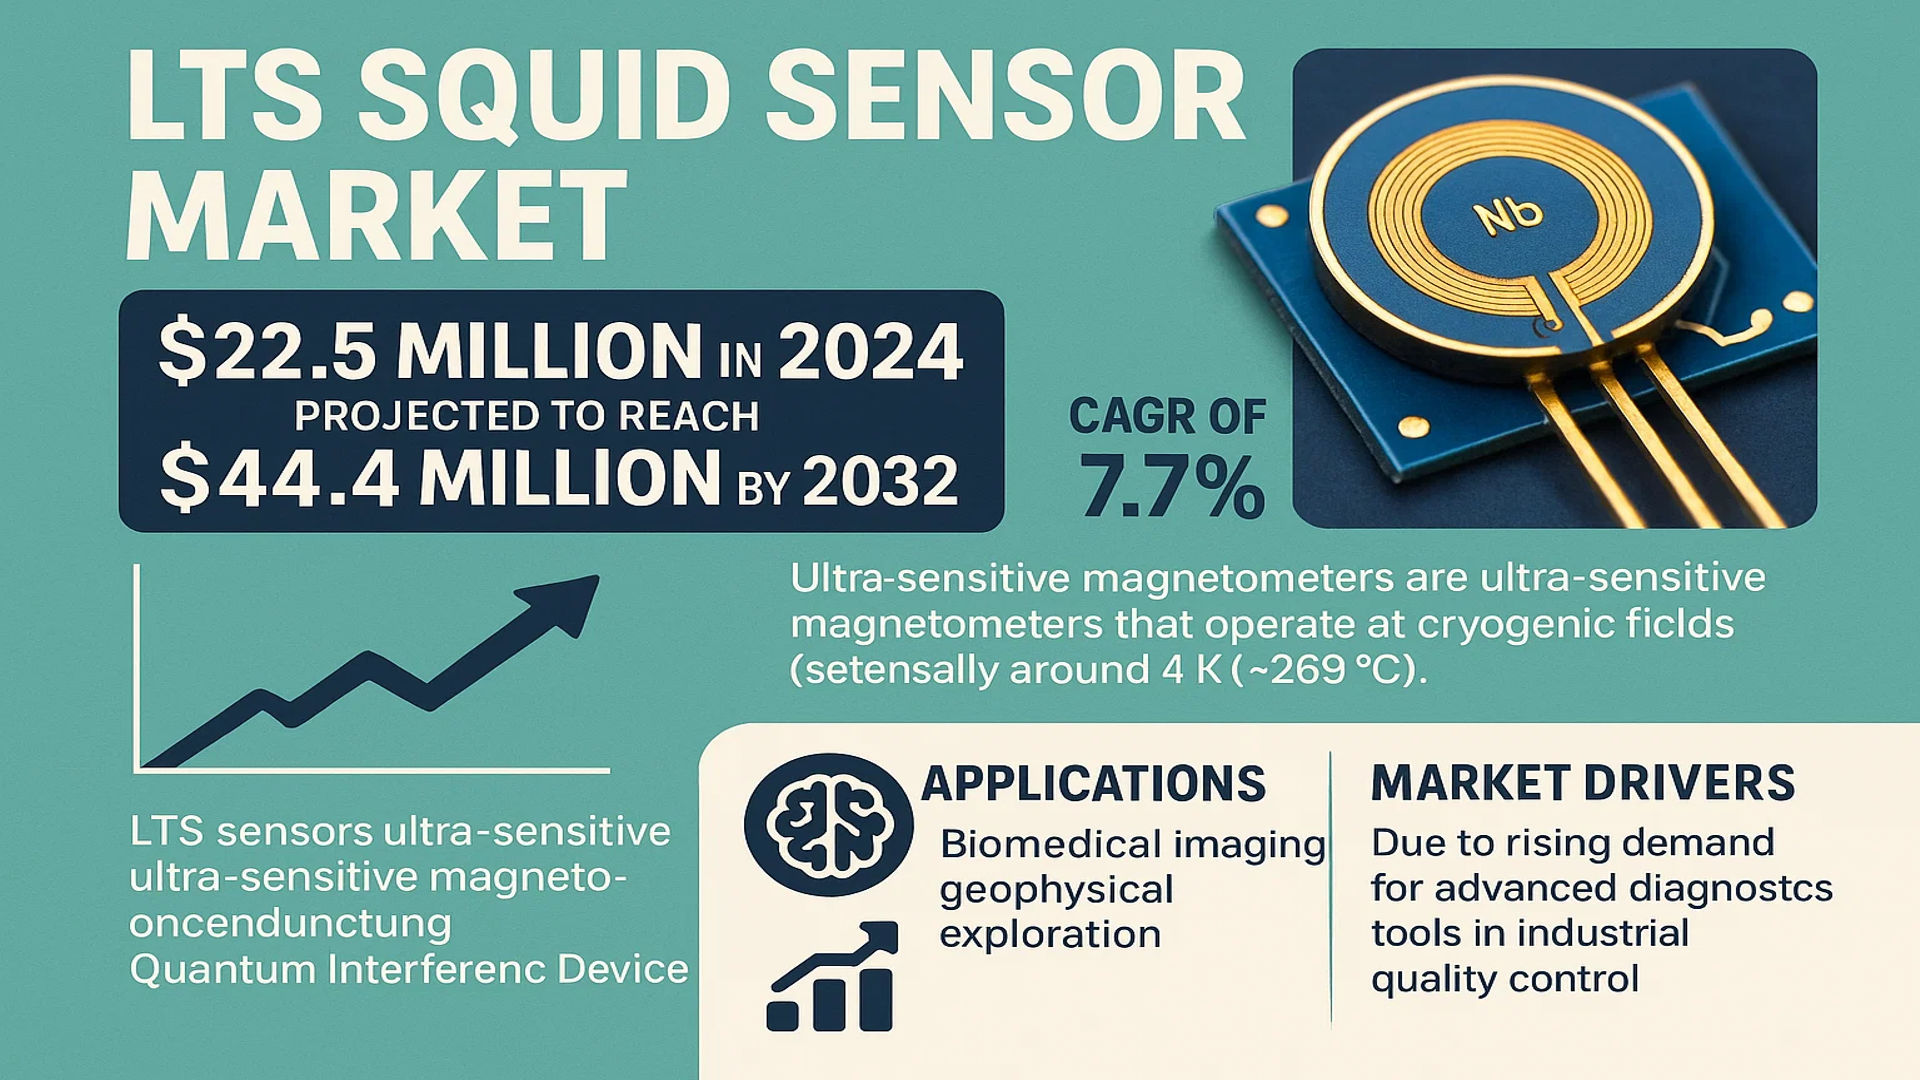
The global LTS SQUID Sensor Market was valued at 22.5 million in 2024 and is projected to reach US$ 44.4 million by 2032, at a CAGR of 7.7% during the forecast period.
LTS SQUID (Low-Temperature Superconducting Quantum Interference Device) sensors are ultra-sensitive magnetometers that operate at cryogenic temperatures, typically around 4 K (-269°C). These sensors utilize superconducting materials such as niobium (Nb) to detect extremely weak magnetic fields by leveraging the quantum mechanical properties of Josephson junctions. Their ability to measure minute changes in magnetic flux makes them essential in applications like biomedical imaging (e.g., magnetoencephalography for brain activity mapping), geophysical exploration, and non-destructive testing. Unlike High-Temperature SQUIDs (HTS), LTS SQUIDs require liquid helium cooling, which presents operational challenges but ensures unparalleled precision.
The market is expanding due to rising demand for advanced diagnostic tools in healthcare, particularly in neurological research, and increasing adoption in industrial quality control. The DC SQUID segment, known for its superior sensitivity, dominates the market, while RF SQUIDs are gaining traction in specialized applications. Key players like STAR Cryoelectronics, Tristan Technologies, and Quantum Design are driving innovation through strategic collaborations and product enhancements. For instance, recent advancements in cryogen-free cooling systems are reducing operational costs, further accelerating market adoption.
MARKET DYNAMICS
MARKET DRIVERS
Advancements in Biomedical Imaging Technologies Fueling LTS SQUID Sensor Adoption
The global healthcare sector’s increasing reliance on precision diagnostics is driving significant demand for LTS SQUID sensors, particularly in magnetoencephalography (MEG) systems. These ultra-sensitive detectors enable non-invasive mapping of brain activity with unparalleled resolution, supporting advancements in neurological disorder diagnosis. The growing prevalence of conditions like epilepsy and Alzheimer’s, affecting over 50 million people worldwide, has created pressing needs for early detection methods. Recent technological improvements have enhanced sensor stability and reduced signal noise, making MEG systems more reliable for clinical applications.
Expanding Applications in Geophysical Exploration Accelerate Market Growth
Mineral exploration companies are increasingly employing LTS SQUID sensors for their ability to detect subtle magnetic anomalies deep underground. This technology provides significant advantages over conventional magnetometers, with detection sensitivity improvements exceeding three orders of magnitude. The global minerals exploration market, valued at over $10 billion annually, continues to invest in technologies that can reduce drilling costs and improve discovery rates. Recent field tests demonstrate these sensors’ effectiveness in locating rare earth mineral deposits critical for electronics manufacturing, positioning them as essential tools for the mining sector’s future.
Government Investments in Quantum Research Creating New Demand
National quantum initiatives worldwide are driving substantial funding into superconducting technologies, with LTS SQUID sensors being a key beneficiary. Multiple countries have launched billion-dollar quantum technology programs that specifically include superconducting sensor development. These sensors play crucial roles in quantum computing research and fundamental physics experiments, where their ability to measure extremely weak magnetic fields enables breakthrough discoveries. The alignment of academic research, government priorities, and commercial applications creates a robust ecosystem for LTS SQUID technology advancement.
MARKET RESTRAINTS
High Operational Costs and Complex Maintenance Requirements Limiting Adoption
The necessity for liquid helium cooling systems presents a major barrier to widespread LTS SQUID sensor implementation. Maintaining the required 4 Kelvin operating temperature demands specialized cryogenic infrastructure that can increase system costs by 40-60% compared to conventional alternatives. Furthermore, the global helium supply chain faces periodic shortages, with prices fluctuating unpredictably. These factors combine to make total ownership costs prohibitive for many potential users, particularly in price-sensitive emerging markets where budget constraints are more pronounced.
Technical Complexity Creates Specialized Labor Shortages
The highly specialized nature of LTS SQUID systems has created a critical shortage of qualified technicians and researchers capable of operating and maintaining the equipment. Unlike conventional sensors that use room-temperature electronics, these superconducting detectors require expertise in cryogenics, quantum physics, and advanced signal processing. The limited pool of professionals with this combination of skills creates implementation bottlenecks, particularly in clinical settings where multidisciplinary teams are necessary. Training programs have struggled to keep pace with the technology’s rapid advancement, exacerbating the skills gap.
Competition from Emerging HTS Technologies Poses Challenges
While LTS SQUID sensors currently dominate high-sensitivity applications, emerging high-temperature superconducting (HTS) alternatives present growing competition. HTS sensors operating at 77K offer simplified cooling requirements using liquid nitrogen instead of helium, potentially reducing operational costs by up to 70%. Although HTS technology currently lags in sensitivity metrics, continuous improvements in materials science are narrowing the performance gap. This creates market uncertainty as some potential buyers delay purchases while awaiting HTS advancements, particularly in applications where ultra-high sensitivity isn’t absolutely critical.
MARKET OPPORTUNITIES
Development of Integrated Medical Diagnostic Systems Opens New Avenues
The growing trend toward multimodal medical imaging presents significant opportunities for LTS SQUID sensor integration. Combining MEG with MRI and other modalities could provide clinicians with unprecedented diagnostic capabilities, particularly in neurology and cardiology. Several research institutions have already demonstrated successful prototypes of hybrid systems, with clinical trials showing diagnostic accuracy improvements exceeding 30% for certain conditions. As healthcare systems worldwide prioritize precision medicine initiatives, demand for these integrated solutions is expected to grow substantially, creating new market segments for sensor manufacturers.
Emerging Applications in Aerospace and Defense Sector
Aerospace manufacturers and defense agencies are exploring LTS SQUID sensors for advanced navigation and surveillance applications. These systems’ ability to detect minute magnetic anomalies makes them valuable for submarine detection, underground facility mapping, and non-destructive testing of aircraft components. With global defense budgets exceeding $2 trillion annually, even niche applications represent substantial market potential. Recent successful military demonstrations have validated the technology’s battlefield utility, potentially leading to larger procurement contracts in coming years.
Material Science Breakthroughs Enable Cost Reduction Opportunities
Ongoing advances in superconducting materials and manufacturing techniques promise to reduce LTS SQUID production costs significantly. Recent innovations in thin-film deposition and quantum circuit fabrication have already decreased sensor manufacturing expenses by approximately 15-20% over the past three years. Further improvements in yield rates and automation could make these sensors economically viable for broader industrial applications. Manufacturers investing in next-generation production methods stand to gain competitive advantages as the technology becomes more accessible to diverse industry segments.
MARKET CHALLENGES
Stringent Certification Requirements Delay Commercial Deployment
Medical and aerospace applications of LTS SQUID sensors face rigorous certification processes that can extend product development cycles by 12-18 months. Regulatory bodies require exhaustive testing to ensure sensor reliability and safety in critical applications, creating substantial barriers to market entry. These requirements are particularly challenging for smaller manufacturers lacking dedicated regulatory teams, potentially limiting innovation and competition in specialized market segments. The complex approval pathways also increase time-to-revenue, affecting return on investment calculations for development projects.
Supply Chain Vulnerabilities for Critical Components
The specialized components required for LTS SQUID systems, including high-purity niobium and ultra-low-noise electronics, rely on limited supply chains with few alternative sources. Geopolitical tensions and trade restrictions have exposed vulnerabilities in these supply networks, with lead times for certain critical parts doubling in recent years. Manufacturers face difficult choices between maintaining costly inventory buffers or risking production delays. This supply chain fragility represents an ongoing operational challenge that could impact the industry’s ability to scale effectively.
Technology Obsolescence Risks from Quantum Alternatives
While LTS SQUID sensors currently provide unmatched magnetic field sensitivity, emerging quantum technologies like atomic magnetometers and nitrogen-vacancy centers in diamonds present potential long-term competition. These alternatives promise room-temperature operation with comparable or superior performance characteristics in certain applications. Although still in development phases, successful commercialization of these technologies could disrupt established SQUID markets within the next decade. Manufacturers must balance continued innovation in traditional SQUID technology with strategic investments in next-generation alternatives to maintain market relevance.
LTS SQUID SENSOR MARKET TRENDS
Growth in Biomedical Imaging Applications Driving Market Expansion
The increasing adoption of LTS SQUID sensors in biomedical imaging, particularly for magnetoencephalography (MEG), is a key driver of market growth. These sensors, with their unparalleled sensitivity to detect ultra-weak magnetic fields generated by neuronal activity, have become critical in neuroscience research and clinical brain mapping. The global MEG systems market, heavily reliant on LTS SQUID technology, is experiencing robust demand due to rising neurological disorder diagnoses and research in cognitive functions. Hospitals and research institutions are progressively investing in these high-precision diagnostic tools, contributing to a projected market growth rate of 7.7% CAGR from 2024 to 2032.
Other Trends
Technological Advancements in Cryogenics
Recent innovations in cryogenic cooling systems are significantly improving the practical deployment of LTS SQUID sensors. While traditional systems require costly liquid helium, emerging cryocooler technologies are reducing operational expenses and enhancing reliability. These advancements address one of the major adoption barriers, as helium dependency has long constrained market expansion. Manufacturers are now focusing on developing integrated cooling solutions that minimize helium consumption while maintaining sensor stability at 4K temperatures.
Industrial and Geophysical Applications Gaining Traction
The utilization of LTS SQUID sensors in industrial non-destructive testing (NDT) and mineral exploration is expanding rapidly. Their ability to detect subsurface anomalies and material defects with nanometer-level sensitivity makes them invaluable in aerospace component testing and oil/gas exploration. Geophysical surveys using SQUID-based magnetometers now account for over 22% of the market’s application segment, with growing demand from emerging economies rich in natural resources. Furthermore, their deployment in quantum computing research as ultra-sensitive readout devices presents new growth avenues.
COMPETITIVE LANDSCAPE
Key Industry Players
Technological Innovation Drives Market Leadership in LTS SQUID Sensors
The global LTS SQUID sensor market is characterized by moderate competition and specialization, with key players focusing on niche applications in healthcare, geophysical surveys, and fundamental physics research. Unlike mass-market technologies, this sector requires specialized expertise in cryogenics and quantum sensing, creating natural barriers to entry that shape the competitive dynamics. Market leadership is currently divided between established superconductivity specialists and diversified scientific instrumentation manufacturers expanding into quantum sensing technologies.
STAR Cryoelectronics and Tristan Technologies have emerged as dominant players, holding approximately 25% combined market share in 2024. These companies maintain strong positions through their vertically integrated manufacturing capabilities and proprietary Josephson junction technologies. STAR Cryoelectronics in particular has strengthened its market position through the 2023 acquisition of a German cryogenic systems manufacturer, expanding its European presence.
Meanwhile, Quantum Design leverages its distribution network and established relationships with research institutions to maintain approximately 15% market share. The company’s recent partnership with several Asian distributors has significantly improved its penetration in emerging markets, especially in China’s growing quantum technology sector.
Smaller specialized manufacturers like Supracon and Magnicon GmbH compete through technological differentiation, focusing on ultra-high sensitivity configurations for specific applications such as magnetoencephalography (MEG) systems. These companies collectively account for about 35% of the market, demonstrating how specialized expertise can overcome scale disadvantages in this high-value niche.
List of Leading LTS SQUID Sensor Manufacturers
- STAR Cryoelectronics (U.S.) – DC SQUID specialists
- Tristan Technologies (U.S.) – Full-system integrators
- SUSTEC (China) – Emerging low-cost producer
- Quantum Design (U.S.) – Research equipment specialists
- Supracon (Germany) – MEG system components
- Magnicon GmbH (Germany) – High-stability sensors
- ez SQUID (Netherlands) – Compact system designs
- MagQu Co. Ltd. (Taiwan) – Industrial applications
- Physike Technology (Japan) – Geophysical instruments
Recent market developments show companies increasingly investing in liquid helium conservation technologies to address one of the primary adoption barriers for LTS SQUID systems. Several manufacturers now offer closed-cycle refrigeration options, reducing operational costs for end-users. While this technological evolution is gradually changing market dynamics, the specialized nature of SQUID technology continues to favor companies with deep domain expertise over generalist competitors.
Segment Analysis:
By Type
DC SQUID Segment Leads Due to High Sensitivity in Low Magnetic Field Detection
The market is segmented based on type into:
- DC SQUID
- RF SQUID
By Application
Healthcare Applications Dominate Owing to Rising Demand in Neurological Imaging
The market is segmented based on application into:
- Healthcare
- Sub-applications: Magnetoencephalography (MEG), Cardiac diagnostics, and others
- Industrial Manufacturing
- Sub-applications: Non-destructive testing, Quality control, and others
- Aerospace
- Geological Survey
- Others
By End User
Research Institutions Lead Through Continuous Investments in Quantum Sensing Technologies
The market is segmented based on end user into:
- Research Institutions
- Diagnostic Centers
- Defense Organizations
- Manufacturing Companies
Regional Analysis: LTS SQUID Sensor Market
North America
The North American LTS SQUID sensor market is driven by advanced research initiatives and significant investments in biomedical imaging and quantum computing applications. The U.S., in particular, leads in adoption due to strong governmental funding for neuroscience research and defense applications, including ultra-sensitive magnetic field detection systems. Major research institutions and healthcare facilities utilize SQUID-based magnetoencephalography (MEG) systems for brain mapping, while aerospace and geophysical sectors employ these sensors for precision measurements. However, high operational costs associated with liquid helium cooling systems present a challenge for broader commercialization. Key players such as STAR Cryoelectronics and Tristan Technologies operate within this region, contributing to technological advancements.
Europe
Europe exhibits steady growth in the LTS SQUID sensor market, supported by a strong academic-industrial collaboration framework and stringent regulatory support for medical diagnostic devices. Countries like Germany and the UK invest heavily in quantum technology initiatives, fostering demand for ultra-sensitive detectors. The region’s focus on non-destructive testing (NDT) for industrial applications and renewable energy projects also drives sensor adoption. However, limited availability of cryogenic infrastructure restricts scalability. Companies such as Magnicon GmbH and Supracon are actively engaged in developing next-generation SQUID solutions aligned with EU innovation policies.
Asia-Pacific
The Asia-Pacific region represents the fastest-growing market for LTS SQUID sensors, primarily driven by China and Japan’s expanding healthcare and semiconductor industries. China’s investments in quantum research and geological exploration projects significantly contribute to demand. Japan leads in medical imaging applications, integrating SQUID systems in neurology diagnostics. Despite this, the market faces challenges such as high import dependencies for advanced sensors and a lack of localized superconducting material suppliers. Nevertheless, domestic manufacturers like MagQu Co. Ltd. are gaining traction by offering cost-competitive alternatives for regional applications.
South America
South America’s LTS SQUID sensor market remains nascent, with Brazil being the primary adopter due to academic research in geophysics and mineral exploration. Limited funding for advanced sensor technologies and inadequate cryogenic infrastructure hinder large-scale deployments. However, collaborations with North American and European firms are gradually enhancing local capabilities. The region’s potential lies in leveraging SQUID sensors for oil and gas exploration, though widespread adoption is constrained by economic volatility.
Middle East & Africa
The MEA market for LTS SQUID sensors is in early development, with Israel and Saudi Arabia emerging as key hubs for scientific research and defense applications. Israeli institutions employ SQUIDs for quantum computing research, while Saudi Arabia explores their utility in energy sector diagnostics. Market growth is impeded by high costs and insufficient technical expertise in cryogenic systems. Nevertheless, rising investments in technological infrastructure offer long-term opportunities for sensor integration in specialized sectors.
Report Scope
This market research report provides a comprehensive analysis of the Global LTS SQUID Sensor Market, covering the forecast period 2024–2032. It offers detailed insights into market dynamics, technological advancements, competitive landscape, and key trends shaping the industry.
Key focus areas of the report include:
- Market Size & Forecast: Historical data and future projections for revenue, unit shipments, and market value across major regions and segments. The global LTS SQUID Sensor market was valued at USD 22.5 million in 2024 and is projected to reach USD 44.4 million by 2032, growing at a CAGR of 7.7%.
- Segmentation Analysis: Detailed breakdown by product type (DC SQUID and RF SQUID), application (Healthcare, Industrial Manufacturing, Aerospace, Geological Survey, Others), and end-user industry to identify high-growth segments.
- Regional Outlook: Insights into market performance across North America, Europe, Asia-Pacific, Latin America, and the Middle East & Africa. The U.S. and China are key growth markets.
- Competitive Landscape: Profiles of leading market participants including STAR Cryoelectronics, Tristan Technologies, Quantum Design, Supracon, and Magnicon GmbH, covering their product portfolios, R&D focus, and strategic developments.
- Technology Trends & Innovation: Assessment of advancements in superconducting materials, cryogenic cooling technologies, and integration with AI-driven analytical systems.
- Market Drivers & Restraints: Evaluation of factors such as increasing demand for biomedical imaging and geophysical exploration, alongside challenges like high operational costs and liquid helium dependency.
- Stakeholder Analysis: Strategic insights for sensor manufacturers, research institutions, healthcare providers, and investors regarding market opportunities and challenges.
The report employs rigorous primary and secondary research methodologies, including interviews with industry experts and analysis of verified market data, to ensure accuracy and reliability.
FREQUENTLY ASKED QUESTIONS:
What is the current market size of Global LTS SQUID Sensor Market?
-> LTS SQUID Sensor Market was valued at 22.5 million in 2024 and is projected to reach US$ 44.4 million by 2032, at a CAGR of 7.7% during the forecast period.
Which key companies operate in Global LTS SQUID Sensor Market?
-> Key players include STAR Cryoelectronics, Tristan Technologies, Quantum Design, Supracon, Magnicon GmbH, ez SQUID, and MagQu Co. Ltd.
What are the key growth drivers?
-> Growth is driven by increasing applications in biomedical imaging, demand for high-precision measurement tools in physics research, and advancements in geophysical exploration technologies.
Which region dominates the market?
-> North America holds the largest market share, while Asia-Pacific is emerging as the fastest-growing region due to expanding research infrastructure.
What are the emerging trends?
-> Emerging trends include development of integrated SQUID systems for quantum computing, miniaturization of sensors, and research into alternative cooling technologies to reduce helium dependency.

Get Sample Report PDF for Exclusive Insights
Report Sample Includes
- Table of Contents
- List of Tables & Figures
- Charts, Research Methodology, and more...


