Lithium Tantalate Wafer Market, Trends, Business Strategies 2025-2032

Lithium Tantalate Wafer Market was valued at 578 million in 2024 and is projected to reach US$ 1445 million by 2032, at a CAGR of 14.3% during the forecast period

PDF Icon Download Sample Report PDF
  • Quick Dispatch

    All Orders

  • Secure Payment

    100% Secure Payment

Price range: $1,500.00 through $4,250.00

Clear

MARKET INSIGHTS

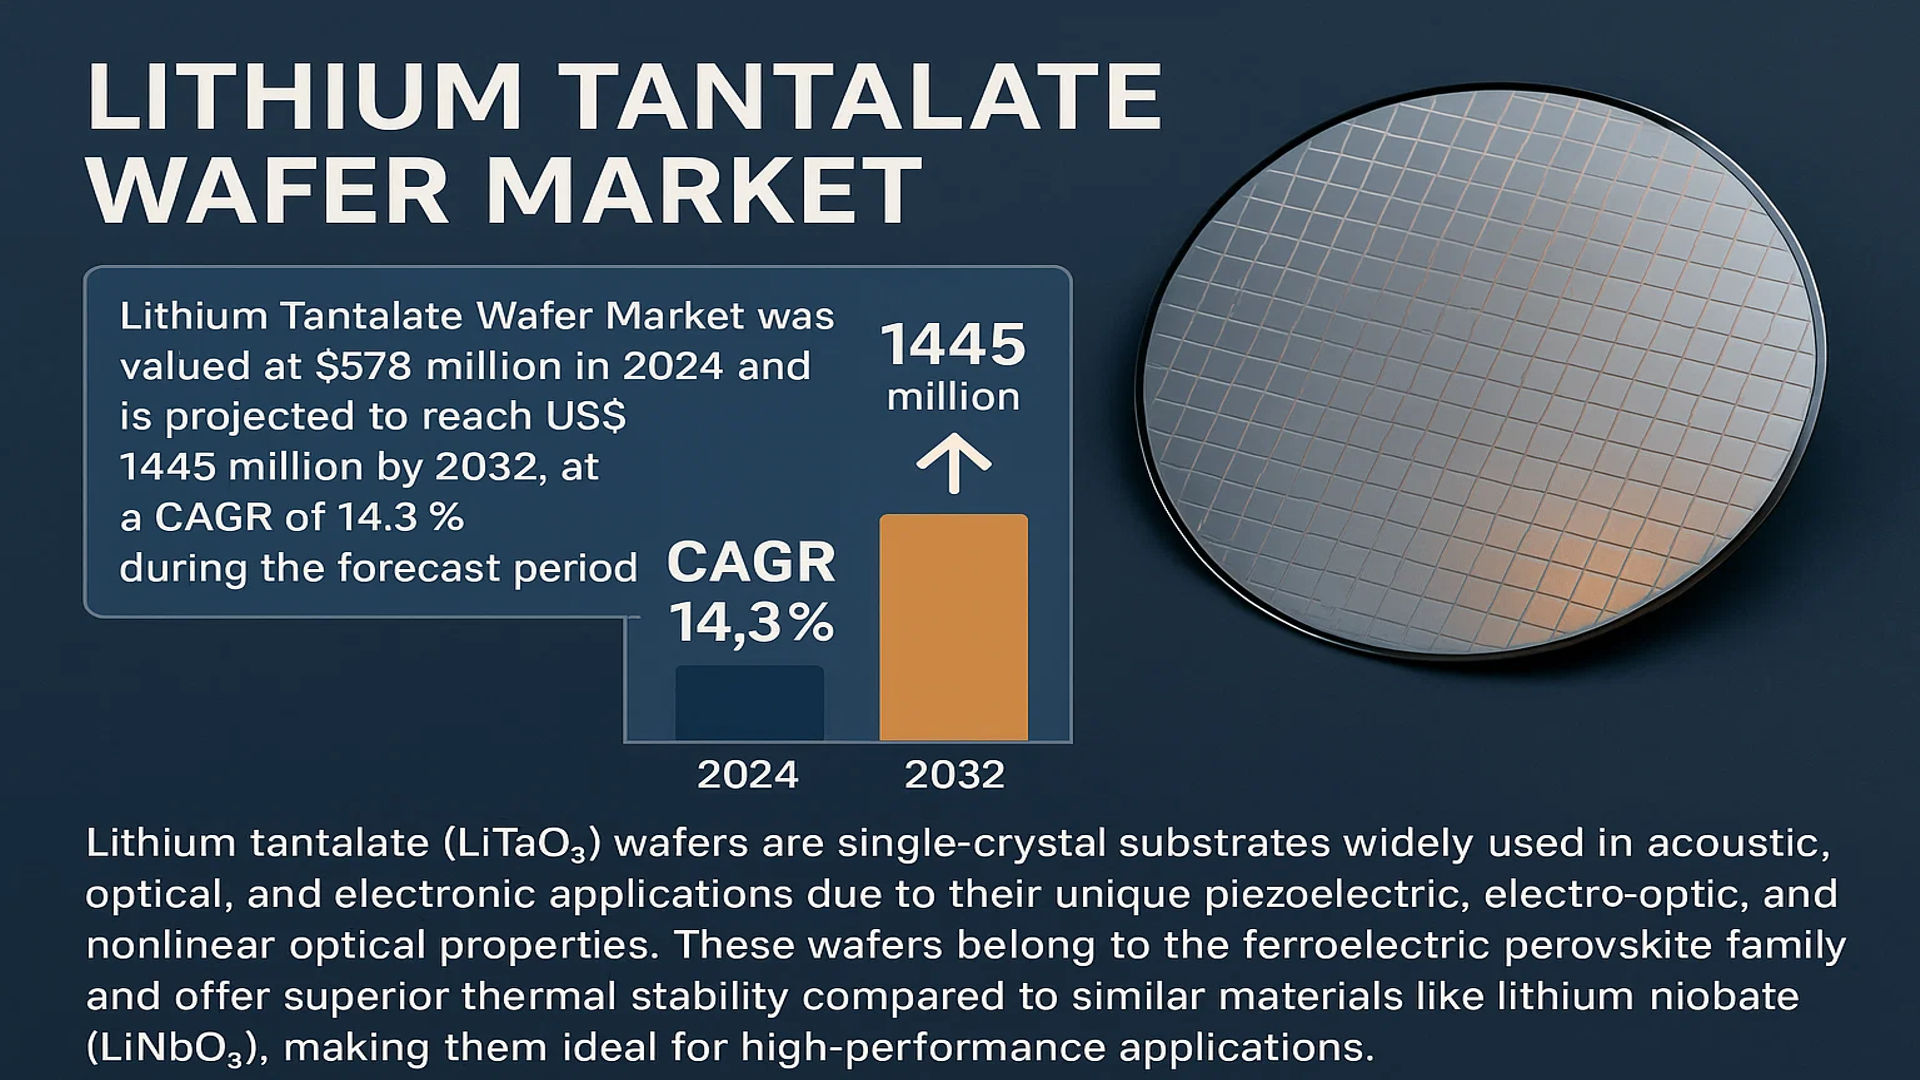
The global Lithium Tantalate Wafer Market was valued at 578 million in 2024 and is projected to reach US$ 1445 million by 2032, at a CAGR of 14.3% during the forecast period.

Lithium tantalate (LiTaO3) wafers are single-crystal substrates widely used in acoustic, optical, and electronic applications due to their unique piezoelectric, electro-optic, and nonlinear optical properties. These wafers belong to the ferroelectric perovskite family and offer superior thermal stability compared to similar materials like lithium niobate (LiNbO3), making them ideal for high-performance applications.

The market growth is driven by increasing demand for 5G communication devices, optical modulators, and surface acoustic wave (SAW) filters. Asia-Pacific currently dominates the market, with China accounting for approximately 45% of global production capacity. Key players like Sumitomo Metal Mining and Shin-Etsu Chemical are investing in capacity expansion to meet the growing demand from telecommunications and defense sectors.

Lithium Tantalate Wafer Market

MARKET DYNAMICS

MARKET DRIVERS

Expansion of 5G Technology and Optical Communication to Fuel Market Growth

The global rollout of 5G networks is creating substantial demand for lithium tantalate wafers due to their exceptional electro-optic properties. These wafers are critical components in surface acoustic wave (SAW) filters used in mobile devices and base stations, where they enable high-frequency signal processing with minimal loss. With over 350 commercial 5G networks deployed worldwide as of latest data and smartphone manufacturers increasingly integrating 5G capabilities, the requirement for high-quality lithium tantalate substrates has surged by approximately 28% annually in the telecom sector alone. This growth trajectory is expected to continue as countries intensify their 5G infrastructure investments.

Advancements in Photonic Integrated Circuits Creating New Applications

The photonics industry is undergoing a transformation with lithium tantalate emerging as a preferred material for integrated optical devices. Its high electro-optic coefficient—nearly three times that of lithium niobate—makes it ideal for modulators in data centers and high-speed optical communications. Recent breakthroughs have demonstrated lithium tantalate’s capability to handle data rates exceeding 100 Gbps per channel, addressing the bandwidth demands of cloud computing and AI infrastructure. The optical devices segment currently accounts for over 40% of lithium tantalate wafer consumption, with projections indicating this share will grow substantially as hyperscale data centers continue their global expansion.

Military and Aerospace Applications Driving Specialized Demand

Defense sectors worldwide are increasingly adopting lithium tantalate-based devices for their superior performance in harsh environments. The material’s thermal stability up to 1,200°C and radiation resistance make it invaluable for avionics, missile guidance systems, and satellite communications. With global defense spending surpassing $2 trillion annually and space programs accelerating, specialized 6-inch lithium tantalate wafers for these applications command premium prices—often 35-50% higher than standard industrial grades. This niche segment is becoming increasingly important for wafer manufacturers seeking higher margin opportunities.

MARKET RESTRAINTS

High Production Costs and Raw Material Constraints Limit Market Penetration

The crystalline perfection required for lithium tantalate wafers results in exceptionally complex manufacturing processes, with typical yields below 60% for 6-inch diameter substrates. The specialized Czochralski crystal growth method requires precise control of temperature gradients and rotation speeds over growth periods exceeding two weeks. These technical challenges, combined with the limited global supply of high-purity tantalum—only five countries produce over 90% of the world’s tantalum ore—create significant cost pressures. Average wafer prices remain 20-30% higher than comparable lithium niobate products, restricting adoption in price-sensitive applications.

Competition from Alternative Materials Threatens Market Position

While lithium tantalate offers superior performance in many applications, emerging materials are challenging its dominance in key sectors. Silicon-based photonic devices, though less efficient, benefit from established semiconductor manufacturing infrastructure and significantly lower costs—often 70-80% less than lithium tantalate solutions. In the RF filter market, aluminum nitride and gallium nitride technologies are gaining traction for certain frequency ranges. The material’s market position depends increasingly on maintaining performance advantages that justify its cost premium, particularly as alternative technologies continue to mature.

MARKET CHALLENGES

Crystal Defects and Quality Control Issues Impact Yield

Maintaining consistent wafer quality remains an ongoing challenge in lithium tantalate production. Even minor variations in crystal growth conditions can introduce defects such as dislocations, inclusions, or compositional inhomogeneities that degrade device performance. These defects are particularly problematic for advanced applications requiring strict specifications, where rejection rates can exceed 40% during quality inspection. The industry’s reliance on manual polishing and inspection processes further compounds these yield challenges, with only a handful of facilities worldwide capable of producing wafers meeting the most stringent military specifications.

Technological Specialization Creates Workforce Shortages

The highly specialized nature of lithium tantalate crystal growth and processing has resulted in acute shortages of skilled personnel. With fewer than a dozen academic programs worldwide offering dedicated crystal growth training, manufacturers face difficulties in recruiting and retaining experts capable of optimizing production processes. This skills gap is particularly pronounced in Western markets where experienced crystal growers average over 25 years in the field with limited succession planning. The talent shortage is estimated to constrain production capacity growth by 15-20% annually for major manufacturers.

MARKET OPPORTUNITIES

Emerging Quantum Technologies Creating New Demand Verticals

Quantum computing and communication systems are emerging as promising new applications for lithium tantalate wafers. The material’s strong nonlinear optical properties make it ideal for quantum light sources and frequency conversion in photonic quantum systems. With governments and technology companies investing over $30 billion collectively in quantum research, specialized lithium tantalate components for quantum applications are commanding prices up to ten times higher than conventional wafers. This high-value niche represents one of the most significant growth opportunities for manufacturers able to meet the extreme purity and uniformity requirements of quantum devices.

Automotive LiDAR Adoption Driving Volume Growth

The rapid development of autonomous vehicle technologies is creating substantial new demand for lithium tantalate in optical beam steering systems. Automotive-grade LiDAR systems increasingly utilize the material’s electro-optic properties for solid-state scanning solutions that outperform mechanical alternatives in reliability and form factor. With projections suggesting over 25 million vehicles will incorporate LiDAR by 2030, automotive applications could account for nearly 15% of the lithium tantalate wafer market within the next five years. This represents a significant volume opportunity, though it requires wafer producers to adapt to the automotive industry’s stringent qualification processes and cost targets.

LITHIUM TANTALATE WAFER MARKET TRENDS

Rising Demand for 5G and Photonics Applications Drives Market Growth

The global lithium tantalate (LiTaO?) wafer market is experiencing significant growth, largely propelled by the increasing adoption of 5G technology and photonics-based applications. Due to their superior piezoelectric and electro-optic properties, lithium tantalate wafers are widely used in surface acoustic wave (SAW) filters for mobile communications and optical modulators for high-speed data transmission. The expanding 5G network infrastructure, which is projected to reach $47.78 billion by 2027, has accelerated demand for SAW filters that rely on lithium tantalate substrates. Additionally, the growing demand for LiTaO? in optical modulators supports telecommunications and data center advancements, reinforcing its position as a critical enabling material.

Other Trends

Expansion in Infrared and Sensing Applications

Lithium tantalate wafers are increasingly being deployed in infrared detectors, pyroelectric sensors, and optical waveguides, particularly in defense and industrial applications. The material’s high thermal stability and nonlinear optical characteristics make it an ideal substrate for thermal imaging systems used in aerospace and security. The global infrared detector market is expected to surpass $10 billion by 2030, with LiTaO? wafers playing a key role in improving sensor performance. Additionally, advancements in ferroelectric memory devices leveraging lithium tantalate are opening new avenues in non-volatile storage solutions.

Shift Toward Larger Wafer Diameters Enhances Manufacturing Efficiency

Manufacturers in the lithium tantalate wafer market are increasingly transitioning from 3-inch and 4-inch wafers to 6-inch diameters to reduce production costs and improve yield efficiency. While 3-inch wafers currently dominate the market, 6-inch wafers are expected to witness the highest growth due to economies of scale in semiconductor fabrication. The higher uniformity of larger wafers also improves device performance, particularly in high-frequency SAW filters and optical applications. Strategic investments by key players such as Shin-Etsu Chemical and Sumitomo Metal Mining in scaling up production capacities are further solidifying this transition.

COMPETITIVE LANDSCAPE

Key Industry Players

Market Leaders Leverage Technical Expertise to Secure Competitive Edge

The global Lithium Tantalate Wafer market exhibits a fragmented competitive structure, dominated by specialized material science companies and diversified chemical manufacturers. Sumitomo Metal Mining Co., Ltd. emerges as a frontrunner, controlling significant market share through its vertically integrated supply chain and extensive R&D investments in crystal growth technologies. The company’s leadership stems from decades of experience in rare metal processing and its ability to deliver high-purity wafers for demanding optical applications.

Japanese firms Shin-Etsu Chemical and YAMAJU CERAMICS CO.,LTD. maintain strong positions through technological differentiation, particularly in precision polishing and orientation control capabilities that enable superior surface quality. Their dominance in the Asian markets, which accounted for over 60% of global demand in 2024, positions these players for continued growth as regional electronics manufacturing expands.

While established players focus on process optimization, emerging Chinese manufacturers like Hangzhou Freqcontrol Electronic Technology are disrupting the market through cost-efficient production methods. These agile competitors have captured 15-20% of the mid-range wafer segment by tailoring products for mass-produced acoustic wave filters in consumer electronics.

The competitive intensity is further heightened by strategic movements across the value chain. TDG Holding Co., LTD. recently expanded its production capacity by 40% to meet rising demand from 5G infrastructure projects, while KOIKE CO.,LTD. diversified into engineered substrates with customized electro-optic properties for quantum computing applications.

List of Key Lithium Tantalate Wafer Manufacturers

  • Sumitomo Metal Mining Co., Ltd. (Japan)
  • YAMAJU CERAMICS CO.,LTD. (Japan)
  • Shin-Etsu Chemical (Japan)
  • KOIKE CO.,LTD. (Japan)
  • TDG Holding Co., LTD. (China)
  • Hangzhou Freqcontrol Electronic Technology (China)
  • Timemaker (South Korea)
  • Shanghai Institute of Optics and Fine Mechanics (China)
  • Shanghai BonTek Optoelectronics (China)
  • CNMNC (China)

Segment Analysis:

By Type

6 Inches Segment Dominates Due to High Demand in Optical and Acoustic Applications

The market is segmented based on type into:

  • 3 inches
  • 4 inches
  • 6 inches
  • Other

By Application

Optical Devices Segment Leads Owing to Growing Utilization in Telecommunications and Photonics

The market is segmented based on application into:

  • Acoustic devices
    • Subtypes: Surface acoustic wave (SAW) filters, Bulk acoustic wave (BAW) resonators, and others
  • Optical devices
    • Subtypes: Electro-optic modulators, Optical waveguides, Nonlinear optical devices, and others

By End User

Telecommunications Sector Accounts for Significant Demand Due to 5G and Optical Network Expansion

The market is segmented based on end user into:

  • Telecommunications
  • Defense and aerospace
  • Medical devices
  • Research institutions
  • Others

Regional Analysis: Lithium Tantalate Wafer Market

Asia-Pacific
The Asia-Pacific region dominates the global Lithium Tantalate Wafer market, accounting for over 45% of the total demand in 2024. This leadership position stems from China’s robust semiconductor and optoelectronics manufacturing sector, where lithium tantalate wafers are extensively used in surface acoustic wave (SAW) filters for 5G devices. Japan follows closely with leading manufacturers like Shin-Etsu Chemical and Sumitomo Metal Mining Co., Ltd. driving both production and innovation. South Korea’s expanding telecommunications infrastructure and India’s growing electronics industry further contribute to regional demand. While cost-competitive production remains a key advantage, there’s increasing investment in R&D to improve wafer quality and application diversity.

North America
North America represents the second-largest market for Lithium Tantalate Wafers, with strong demand from both the defense sector and telecommunications industries. The United States maintains technological superiority in specialized applications such as quantum computing and advanced optical modulators, where lithium tantalate’s unique properties are irreplaceable. Recent government initiatives like the CHIPS Act are expected to bolster domestic semiconductor manufacturing, indirectly supporting the wafer market. However, limited local production capacity means the region relies heavily on imports, primarily from Japanese suppliers, creating opportunities for supply chain optimization.

Europe
Europe’s market is characterized by specialized, high-value applications in precision optics and scientific instrumentation. Germany leads regional consumption, with its strong photonics industry requiring lithium tantalate wafers for nonlinear optical devices. The EU’s focus on technological sovereignty has prompted increased investment in advanced material research, including alternative piezoelectric materials that could impact future demand patterns. Strict environmental regulations governing tantalum sourcing present both challenges and opportunities for suppliers committed to sustainable practices. Collaboration between research institutions and industry players remains a distinctive feature of the European market landscape.

South America
The South American market shows emerging potential with Brazil as the primary consumer, though current volumes remain modest. Growth is primarily driven by telecommunications infrastructure upgrades and some specialized industrial applications. Economic volatility affects capital-intensive projects that might otherwise drive wafer adoption, while limited local expertise in advanced materials processing constrains market expansion. However, the region’s increasing focus on renewable energy systems could open new application areas for lithium tantalate in sensors and monitoring devices over the long term.

Middle East & Africa
This region represents the smallest but fastest-growing market segment for Lithium Tantalate Wafers, with Israel and the UAE leading adoption. Israel’s thriving defense electronics sector and the UAE’s smart city initiatives create targeted demand for acoustic wave devices. While infrastructure limitations hinder widespread market penetration, strategic investments in 5G networks and optical communication systems are expected to drive steady growth. The lack of local manufacturing means all wafers are imported, primarily from Asian suppliers, resulting in longer lead times and higher costs that somewhat limit market expansion.

Report Scope

This market research report provides a comprehensive analysis of the global and regional Lithium Tantalate Wafer markets, covering the forecast period 2024–2032. It offers detailed insights into market dynamics, technological advancements, competitive landscape, and key trends shaping the industry.

Key focus areas of the report include:

  • Market Size & Forecast: Historical data and future projections for revenue, unit shipments, and market value across major regions and segments. The global Lithium Tantalate Wafer market was valued at USD 578 million in 2024 and is projected to reach USD 1445 million by 2032, at a CAGR of 14.3%.
  • Segmentation Analysis: Detailed breakdown by product type (3 inches, 4 inches, 6 inches, Other), technology, application (Acoustic Devices, Optical Devices), and end-user industry to identify high-growth segments and investment opportunities.
  • Regional Outlook: Insights into market performance across North America, Europe, Asia-Pacific, Latin America, and the Middle East & Africa, including country-level analysis where relevant. The U.S. market size is estimated at USD million in 2024, while China is expected to reach USD million.
  • Competitive Landscape: Profiles of leading market participants, including Sumitomo Metal Mining Co., Ltd., YAMAJU CERAMICS CO.,LTD., Shin-Etsu Chemical, KOIKE CO.,LTD., TDG Holding Co., LTD., and others, covering their product offerings, R&D focus, manufacturing capacity, pricing strategies, and recent developments.
  • Technology Trends & Innovation: Assessment of emerging technologies, fabrication techniques, and evolving industry standards in piezoelectric and electro-optic applications.
  • Market Drivers & Restraints: Evaluation of factors driving market growth along with challenges, supply chain constraints, regulatory issues, and market-entry barriers.
  • Stakeholder Analysis: Insights for component suppliers, OEMs, system integrators, investors, and policymakers regarding the evolving ecosystem and strategic opportunities.

Primary and secondary research methods are employed, including interviews with industry experts, data from verified sources, and real-time market intelligence to ensure the accuracy and reliability of the insights presented.

FREQUENTLY ASKED QUESTIONS:

What is the current market size of Global Lithium Tantalate Wafer Market?

-> Lithium Tantalate Wafer Market was valued at 578 million in 2024 and is projected to reach US$ 1445 million by 2032, at a CAGR of 14.3% during the forecast period.

Which key companies operate in Global Lithium Tantalate Wafer Market?

-> Key players include Sumitomo Metal Mining Co., Ltd., YAMAJU CERAMICS CO.,LTD., Shin-Etsu Chemical, KOIKE CO.,LTD., TDG Holding Co., LTD., Hangzhou Freqcontrol Electronic Technology, and Shanghai Institute of Optics and Fine Mechanics, among others.

What are the key growth drivers?

-> Key growth drivers include rising demand for acoustic and optical devices, advancements in piezoelectric technology, and increasing adoption in telecommunications and semiconductor industries.

Which region dominates the market?

-> Asia-Pacific leads the market due to strong semiconductor manufacturing capabilities, while North America shows significant growth in advanced optical applications.

What are the emerging trends?

-> Emerging trends include development of larger wafer sizes (6 inches+), integration in 5G infrastructure, and innovations in thin-film lithium tantalate technology.

Lithium Tantalate Wafer Market, Trends, Business Strategies 2025-2032

Get Sample Report PDF for Exclusive Insights

Report Sample Includes

  • Table of Contents
  • List of Tables & Figures
  • Charts, Research Methodology, and more...
PDF Icon Download Sample Report PDF

Download Sample Report

Table of Content

1 Introduction to Research & Analysis Reports
1.1 Lithium Tantalate Wafer Market Definition
1.2 Market Segments
1.2.1 Segment by Type
1.2.2 Segment by Application
1.3 Global Lithium Tantalate Wafer Market Overview
1.4 Features & Benefits of This Report
1.5 Methodology & Sources of Information
1.5.1 Research Methodology
1.5.2 Research Process
1.5.3 Base Year
1.5.4 Report Assumptions & Caveats
2 Global Lithium Tantalate Wafer Overall Market Size
2.1 Global Lithium Tantalate Wafer Market Size: 2024 VS 2032
2.2 Global Lithium Tantalate Wafer Market Size, Prospects & Forecasts: 2020-2032
2.3 Global Lithium Tantalate Wafer Sales: 2020-2032
3 Company Landscape
3.1 Top Lithium Tantalate Wafer Players in Global Market
3.2 Top Global Lithium Tantalate Wafer Companies Ranked by Revenue
3.3 Global Lithium Tantalate Wafer Revenue by Companies
3.4 Global Lithium Tantalate Wafer Sales by Companies
3.5 Global Lithium Tantalate Wafer Price by Manufacturer (2020-2025)
3.6 Top 3 and Top 5 Lithium Tantalate Wafer Companies in Global Market, by Revenue in 2024
3.7 Global Manufacturers Lithium Tantalate Wafer Product Type
3.8 Tier 1, Tier 2, and Tier 3 Lithium Tantalate Wafer Players in Global Market
3.8.1 List of Global Tier 1 Lithium Tantalate Wafer Companies
3.8.2 List of Global Tier 2 and Tier 3 Lithium Tantalate Wafer Companies
4 Sights by Product
4.1 Overview
4.1.1 Segment by Type – Global Lithium Tantalate Wafer Market Size Markets, 2024 & 2032
4.1.2 3 inches
4.1.3 4 inches
4.1.4 6 inches
4.1.5 Other
4.2 Segment by Type – Global Lithium Tantalate Wafer Revenue & Forecasts
4.2.1 Segment by Type – Global Lithium Tantalate Wafer Revenue, 2020-2025
4.2.2 Segment by Type – Global Lithium Tantalate Wafer Revenue, 2026-2032
4.2.3 Segment by Type – Global Lithium Tantalate Wafer Revenue Market Share, 2020-2032
4.3 Segment by Type – Global Lithium Tantalate Wafer Sales & Forecasts
4.3.1 Segment by Type – Global Lithium Tantalate Wafer Sales, 2020-2025
4.3.2 Segment by Type – Global Lithium Tantalate Wafer Sales, 2026-2032
4.3.3 Segment by Type – Global Lithium Tantalate Wafer Sales Market Share, 2020-2032
4.4 Segment by Type – Global Lithium Tantalate Wafer Price (Manufacturers Selling Prices), 2020-2032
5 Sights by Application
5.1 Overview
5.1.1 Segment by Application – Global Lithium Tantalate Wafer Market Size, 2024 & 2032
5.1.2 Acoustic Devices
5.1.3 Optical Devices
5.2 Segment by Application – Global Lithium Tantalate Wafer Revenue & Forecasts
5.2.1 Segment by Application – Global Lithium Tantalate Wafer Revenue, 2020-2025
5.2.2 Segment by Application – Global Lithium Tantalate Wafer Revenue, 2026-2032
5.2.3 Segment by Application – Global Lithium Tantalate Wafer Revenue Market Share, 2020-2032
5.3 Segment by Application – Global Lithium Tantalate Wafer Sales & Forecasts
5.3.1 Segment by Application – Global Lithium Tantalate Wafer Sales, 2020-2025
5.3.2 Segment by Application – Global Lithium Tantalate Wafer Sales, 2026-2032
5.3.3 Segment by Application – Global Lithium Tantalate Wafer Sales Market Share, 2020-2032
5.4 Segment by Application – Global Lithium Tantalate Wafer Price (Manufacturers Selling Prices), 2020-2032
6 Sights by Region
6.1 By Region – Global Lithium Tantalate Wafer Market Size, 2024 & 2032
6.2 By Region – Global Lithium Tantalate Wafer Revenue & Forecasts
6.2.1 By Region – Global Lithium Tantalate Wafer Revenue, 2020-2025
6.2.2 By Region – Global Lithium Tantalate Wafer Revenue, 2026-2032
6.2.3 By Region – Global Lithium Tantalate Wafer Revenue Market Share, 2020-2032
6.3 By Region – Global Lithium Tantalate Wafer Sales & Forecasts
6.3.1 By Region – Global Lithium Tantalate Wafer Sales, 2020-2025
6.3.2 By Region – Global Lithium Tantalate Wafer Sales, 2026-2032
6.3.3 By Region – Global Lithium Tantalate Wafer Sales Market Share, 2020-2032
6.4 North America
6.4.1 By Country – North America Lithium Tantalate Wafer Revenue, 2020-2032
6.4.2 By Country – North America Lithium Tantalate Wafer Sales, 2020-2032
6.4.3 United States Lithium Tantalate Wafer Market Size, 2020-2032
6.4.4 Canada Lithium Tantalate Wafer Market Size, 2020-2032
6.4.5 Mexico Lithium Tantalate Wafer Market Size, 2020-2032
6.5 Europe
6.5.1 By Country – Europe Lithium Tantalate Wafer Revenue, 2020-2032
6.5.2 By Country – Europe Lithium Tantalate Wafer Sales, 2020-2032
6.5.3 Germany Lithium Tantalate Wafer Market Size, 2020-2032
6.5.4 France Lithium Tantalate Wafer Market Size, 2020-2032
6.5.5 U.K. Lithium Tantalate Wafer Market Size, 2020-2032
6.5.6 Italy Lithium Tantalate Wafer Market Size, 2020-2032
6.5.7 Russia Lithium Tantalate Wafer Market Size, 2020-2032
6.5.8 Nordic Countries Lithium Tantalate Wafer Market Size, 2020-2032
6.5.9 Benelux Lithium Tantalate Wafer Market Size, 2020-2032
6.6 Asia
6.6.1 By Region – Asia Lithium Tantalate Wafer Revenue, 2020-2032
6.6.2 By Region – Asia Lithium Tantalate Wafer Sales, 2020-2032
6.6.3 China Lithium Tantalate Wafer Market Size, 2020-2032
6.6.4 Japan Lithium Tantalate Wafer Market Size, 2020-2032
6.6.5 South Korea Lithium Tantalate Wafer Market Size, 2020-2032
6.6.6 Southeast Asia Lithium Tantalate Wafer Market Size, 2020-2032
6.6.7 India Lithium Tantalate Wafer Market Size, 2020-2032
6.7 South America
6.7.1 By Country – South America Lithium Tantalate Wafer Revenue, 2020-2032
6.7.2 By Country – South America Lithium Tantalate Wafer Sales, 2020-2032
6.7.3 Brazil Lithium Tantalate Wafer Market Size, 2020-2032
6.7.4 Argentina Lithium Tantalate Wafer Market Size, 2020-2032
6.8 Middle East & Africa
6.8.1 By Country – Middle East & Africa Lithium Tantalate Wafer Revenue, 2020-2032
6.8.2 By Country – Middle East & Africa Lithium Tantalate Wafer Sales, 2020-2032
6.8.3 Turkey Lithium Tantalate Wafer Market Size, 2020-2032
6.8.4 Israel Lithium Tantalate Wafer Market Size, 2020-2032
6.8.5 Saudi Arabia Lithium Tantalate Wafer Market Size, 2020-2032
6.8.6 UAE Lithium Tantalate Wafer Market Size, 2020-2032
7 Manufacturers & Brands Profiles
7.1 Sumitomo Metal Mining Co., Ltd.
7.1.1 Sumitomo Metal Mining Co., Ltd. Company Summary
7.1.2 Sumitomo Metal Mining Co., Ltd. Business Overview
7.1.3 Sumitomo Metal Mining Co., Ltd. Lithium Tantalate Wafer Major Product Offerings
7.1.4 Sumitomo Metal Mining Co., Ltd. Lithium Tantalate Wafer Sales and Revenue in Global (2020-2025)
7.1.5 Sumitomo Metal Mining Co., Ltd. Key News & Latest Developments
7.2 YAMAJU CERAMICS CO.,LTD.
7.2.1 YAMAJU CERAMICS CO.,LTD. Company Summary
7.2.2 YAMAJU CERAMICS CO.,LTD. Business Overview
7.2.3 YAMAJU CERAMICS CO.,LTD. Lithium Tantalate Wafer Major Product Offerings
7.2.4 YAMAJU CERAMICS CO.,LTD. Lithium Tantalate Wafer Sales and Revenue in Global (2020-2025)
7.2.5 YAMAJU CERAMICS CO.,LTD. Key News & Latest Developments
7.3 Shin-Etsu Chemical
7.3.1 Shin-Etsu Chemical Company Summary
7.3.2 Shin-Etsu Chemical Business Overview
7.3.3 Shin-Etsu Chemical Lithium Tantalate Wafer Major Product Offerings
7.3.4 Shin-Etsu Chemical Lithium Tantalate Wafer Sales and Revenue in Global (2020-2025)
7.3.5 Shin-Etsu Chemical Key News & Latest Developments
7.4 KOIKE CO.,LTD.
7.4.1 KOIKE CO.,LTD. Company Summary
7.4.2 KOIKE CO.,LTD. Business Overview
7.4.3 KOIKE CO.,LTD. Lithium Tantalate Wafer Major Product Offerings
7.4.4 KOIKE CO.,LTD. Lithium Tantalate Wafer Sales and Revenue in Global (2020-2025)
7.4.5 KOIKE CO.,LTD. Key News & Latest Developments
7.5 TDG Holding Co., LTD.
7.5.1 TDG Holding Co., LTD. Company Summary
7.5.2 TDG Holding Co., LTD. Business Overview
7.5.3 TDG Holding Co., LTD. Lithium Tantalate Wafer Major Product Offerings
7.5.4 TDG Holding Co., LTD. Lithium Tantalate Wafer Sales and Revenue in Global (2020-2025)
7.5.5 TDG Holding Co., LTD. Key News & Latest Developments
7.6 Hangzhou Freqcontrol Electronic Technology
7.6.1 Hangzhou Freqcontrol Electronic Technology Company Summary
7.6.2 Hangzhou Freqcontrol Electronic Technology Business Overview
7.6.3 Hangzhou Freqcontrol Electronic Technology Lithium Tantalate Wafer Major Product Offerings
7.6.4 Hangzhou Freqcontrol Electronic Technology Lithium Tantalate Wafer Sales and Revenue in Global (2020-2025)
7.6.5 Hangzhou Freqcontrol Electronic Technology Key News & Latest Developments
7.7 Timemaker
7.7.1 Timemaker Company Summary
7.7.2 Timemaker Business Overview
7.7.3 Timemaker Lithium Tantalate Wafer Major Product Offerings
7.7.4 Timemaker Lithium Tantalate Wafer Sales and Revenue in Global (2020-2025)
7.7.5 Timemaker Key News & Latest Developments
7.8 Shanghai Institute of Optics and Fine Mechanics Laser and InFrared Materials Laboratory
7.8.1 Shanghai Institute of Optics and Fine Mechanics Laser and InFrared Materials Laboratory Company Summary
7.8.2 Shanghai Institute of Optics and Fine Mechanics Laser and InFrared Materials Laboratory Business Overview
7.8.3 Shanghai Institute of Optics and Fine Mechanics Laser and InFrared Materials Laboratory Lithium Tantalate Wafer Major Product Offerings
7.8.4 Shanghai Institute of Optics and Fine Mechanics Laser and InFrared Materials Laboratory Lithium Tantalate Wafer Sales and Revenue in Global (2020-2025)
7.8.5 Shanghai Institute of Optics and Fine Mechanics Laser and InFrared Materials Laboratory Key News & Latest Developments
7.9 Shanghai BonTek Optoelectronics Technology Development
7.9.1 Shanghai BonTek Optoelectronics Technology Development Company Summary
7.9.2 Shanghai BonTek Optoelectronics Technology Development Business Overview
7.9.3 Shanghai BonTek Optoelectronics Technology Development Lithium Tantalate Wafer Major Product Offerings
7.9.4 Shanghai BonTek Optoelectronics Technology Development Lithium Tantalate Wafer Sales and Revenue in Global (2020-2025)
7.9.5 Shanghai BonTek Optoelectronics Technology Development Key News & Latest Developments
7.10 CNMNC
7.10.1 CNMNC Company Summary
7.10.2 CNMNC Business Overview
7.10.3 CNMNC Lithium Tantalate Wafer Major Product Offerings
7.10.4 CNMNC Lithium Tantalate Wafer Sales and Revenue in Global (2020-2025)
7.10.5 CNMNC Key News & Latest Developments
8 Global Lithium Tantalate Wafer Production Capacity, Analysis
8.1 Global Lithium Tantalate Wafer Production Capacity, 2020-2032
8.2 Lithium Tantalate Wafer Production Capacity of Key Manufacturers in Global Market
8.3 Global Lithium Tantalate Wafer Production by Region
9 Key Market Trends, Opportunity, Drivers and Restraints
9.1 Market Opportunities & Trends
9.2 Market Drivers
9.3 Market Restraints
10 Lithium Tantalate Wafer Supply Chain Analysis
10.1 Lithium Tantalate Wafer Industry Value Chain
10.2 Lithium Tantalate Wafer Upstream Market
10.3 Lithium Tantalate Wafer Downstream and Clients
10.4 Marketing Channels Analysis
10.4.1 Marketing Channels
10.4.2 Lithium Tantalate Wafer Distributors and Sales Agents in Global
11 Conclusion
12 Appendix
12.1 Note
12.2 Examples of Clients
12.3 DisclaimerList of Tables
Table 1. Key Players of Lithium Tantalate Wafer in Global Market
Table 2. Top Lithium Tantalate Wafer Players in Global Market, Ranking by Revenue (2024)
Table 3. Global Lithium Tantalate Wafer Revenue by Companies, (US$, Mn), 2020-2025
Table 4. Global Lithium Tantalate Wafer Revenue Share by Companies, 2020-2025
Table 5. Global Lithium Tantalate Wafer Sales by Companies, (K Pcs), 2020-2025
Table 6. Global Lithium Tantalate Wafer Sales Share by Companies, 2020-2025
Table 7. Key Manufacturers Lithium Tantalate Wafer Price (2020-2025) & (US$/Pcs)
Table 8. Global Manufacturers Lithium Tantalate Wafer Product Type
Table 9. List of Global Tier 1 Lithium Tantalate Wafer Companies, Revenue (US$, Mn) in 2024 and Market Share
Table 10. List of Global Tier 2 and Tier 3 Lithium Tantalate Wafer Companies, Revenue (US$, Mn) in 2024 and Market Share
Table 11. Segment by Type – Global Lithium Tantalate Wafer Revenue, (US$, Mn), 2024 & 2032
Table 12. Segment by Type – Global Lithium Tantalate Wafer Revenue (US$, Mn), 2020-2025
Table 13. Segment by Type – Global Lithium Tantalate Wafer Revenue (US$, Mn), 2026-2032
Table 14. Segment by Type – Global Lithium Tantalate Wafer Sales (K Pcs), 2020-2025
Table 15. Segment by Type – Global Lithium Tantalate Wafer Sales (K Pcs), 2026-2032
Table 16. Segment by Application – Global Lithium Tantalate Wafer Revenue, (US$, Mn), 2024 & 2032
Table 17. Segment by Application – Global Lithium Tantalate Wafer Revenue, (US$, Mn), 2020-2025
Table 18. Segment by Application – Global Lithium Tantalate Wafer Revenue, (US$, Mn), 2026-2032
Table 19. Segment by Application – Global Lithium Tantalate Wafer Sales, (K Pcs), 2020-2025
Table 20. Segment by Application – Global Lithium Tantalate Wafer Sales, (K Pcs), 2026-2032
Table 21. By Region – Global Lithium Tantalate Wafer Revenue, (US$, Mn), 2025-2032
Table 22. By Region – Global Lithium Tantalate Wafer Revenue, (US$, Mn), 2020-2025
Table 23. By Region – Global Lithium Tantalate Wafer Revenue, (US$, Mn), 2026-2032
Table 24. By Region – Global Lithium Tantalate Wafer Sales, (K Pcs), 2020-2025
Table 25. By Region – Global Lithium Tantalate Wafer Sales, (K Pcs), 2026-2032
Table 26. By Country – North America Lithium Tantalate Wafer Revenue, (US$, Mn), 2020-2025
Table 27. By Country – North America Lithium Tantalate Wafer Revenue, (US$, Mn), 2026-2032
Table 28. By Country – North America Lithium Tantalate Wafer Sales, (K Pcs), 2020-2025
Table 29. By Country – North America Lithium Tantalate Wafer Sales, (K Pcs), 2026-2032
Table 30. By Country – Europe Lithium Tantalate Wafer Revenue, (US$, Mn), 2020-2025
Table 31. By Country – Europe Lithium Tantalate Wafer Revenue, (US$, Mn), 2026-2032
Table 32. By Country – Europe Lithium Tantalate Wafer Sales, (K Pcs), 2020-2025
Table 33. By Country – Europe Lithium Tantalate Wafer Sales, (K Pcs), 2026-2032
Table 34. By Region – Asia Lithium Tantalate Wafer Revenue, (US$, Mn), 2020-2025
Table 35. By Region – Asia Lithium Tantalate Wafer Revenue, (US$, Mn), 2026-2032
Table 36. By Region – Asia Lithium Tantalate Wafer Sales, (K Pcs), 2020-2025
Table 37. By Region – Asia Lithium Tantalate Wafer Sales, (K Pcs), 2026-2032
Table 38. By Country – South America Lithium Tantalate Wafer Revenue, (US$, Mn), 2020-2025
Table 39. By Country – South America Lithium Tantalate Wafer Revenue, (US$, Mn), 2026-2032
Table 40. By Country – South America Lithium Tantalate Wafer Sales, (K Pcs), 2020-2025
Table 41. By Country – South America Lithium Tantalate Wafer Sales, (K Pcs), 2026-2032
Table 42. By Country – Middle East & Africa Lithium Tantalate Wafer Revenue, (US$, Mn), 2020-2025
Table 43. By Country – Middle East & Africa Lithium Tantalate Wafer Revenue, (US$, Mn), 2026-2032
Table 44. By Country – Middle East & Africa Lithium Tantalate Wafer Sales, (K Pcs), 2020-2025
Table 45. By Country – Middle East & Africa Lithium Tantalate Wafer Sales, (K Pcs), 2026-2032
Table 46. Sumitomo Metal Mining Co., Ltd. Company Summary
Table 47. Sumitomo Metal Mining Co., Ltd. Lithium Tantalate Wafer Product Offerings
Table 48. Sumitomo Metal Mining Co., Ltd. Lithium Tantalate Wafer Sales (K Pcs), Revenue (US$, Mn) and Average Price (US$/Pcs) & (2020-2025)
Table 49. Sumitomo Metal Mining Co., Ltd. Key News & Latest Developments
Table 50. YAMAJU CERAMICS CO.,LTD. Company Summary
Table 51. YAMAJU CERAMICS CO.,LTD. Lithium Tantalate Wafer Product Offerings
Table 52. YAMAJU CERAMICS CO.,LTD. Lithium Tantalate Wafer Sales (K Pcs), Revenue (US$, Mn) and Average Price (US$/Pcs) & (2020-2025)
Table 53. YAMAJU CERAMICS CO.,LTD. Key News & Latest Developments
Table 54. Shin-Etsu Chemical Company Summary
Table 55. Shin-Etsu Chemical Lithium Tantalate Wafer Product Offerings
Table 56. Shin-Etsu Chemical Lithium Tantalate Wafer Sales (K Pcs), Revenue (US$, Mn) and Average Price (US$/Pcs) & (2020-2025)
Table 57. Shin-Etsu Chemical Key News & Latest Developments
Table 58. KOIKE CO.,LTD. Company Summary
Table 59. KOIKE CO.,LTD. Lithium Tantalate Wafer Product Offerings
Table 60. KOIKE CO.,LTD. Lithium Tantalate Wafer Sales (K Pcs), Revenue (US$, Mn) and Average Price (US$/Pcs) & (2020-2025)
Table 61. KOIKE CO.,LTD. Key News & Latest Developments
Table 62. TDG Holding Co., LTD. Company Summary
Table 63. TDG Holding Co., LTD. Lithium Tantalate Wafer Product Offerings
Table 64. TDG Holding Co., LTD. Lithium Tantalate Wafer Sales (K Pcs), Revenue (US$, Mn) and Average Price (US$/Pcs) & (2020-2025)
Table 65. TDG Holding Co., LTD. Key News & Latest Developments
Table 66. Hangzhou Freqcontrol Electronic Technology Company Summary
Table 67. Hangzhou Freqcontrol Electronic Technology Lithium Tantalate Wafer Product Offerings
Table 68. Hangzhou Freqcontrol Electronic Technology Lithium Tantalate Wafer Sales (K Pcs), Revenue (US$, Mn) and Average Price (US$/Pcs) & (2020-2025)
Table 69. Hangzhou Freqcontrol Electronic Technology Key News & Latest Developments
Table 70. Timemaker Company Summary
Table 71. Timemaker Lithium Tantalate Wafer Product Offerings
Table 72. Timemaker Lithium Tantalate Wafer Sales (K Pcs), Revenue (US$, Mn) and Average Price (US$/Pcs) & (2020-2025)
Table 73. Timemaker Key News & Latest Developments
Table 74. Shanghai Institute of Optics and Fine Mechanics Laser and InFrared Materials Laboratory Company Summary
Table 75. Shanghai Institute of Optics and Fine Mechanics Laser and InFrared Materials Laboratory Lithium Tantalate Wafer Product Offerings
Table 76. Shanghai Institute of Optics and Fine Mechanics Laser and InFrared Materials Laboratory Lithium Tantalate Wafer Sales (K Pcs), Revenue (US$, Mn) and Average Price (US$/Pcs) & (2020-2025)
Table 77. Shanghai Institute of Optics and Fine Mechanics Laser and InFrared Materials Laboratory Key News & Latest Developments
Table 78. Shanghai BonTek Optoelectronics Technology Development Company Summary
Table 79. Shanghai BonTek Optoelectronics Technology Development Lithium Tantalate Wafer Product Offerings
Table 80. Shanghai BonTek Optoelectronics Technology Development Lithium Tantalate Wafer Sales (K Pcs), Revenue (US$, Mn) and Average Price (US$/Pcs) & (2020-2025)
Table 81. Shanghai BonTek Optoelectronics Technology Development Key News & Latest Developments
Table 82. CNMNC Company Summary
Table 83. CNMNC Lithium Tantalate Wafer Product Offerings
Table 84. CNMNC Lithium Tantalate Wafer Sales (K Pcs), Revenue (US$, Mn) and Average Price (US$/Pcs) & (2020-2025)
Table 85. CNMNC Key News & Latest Developments
Table 86. Lithium Tantalate Wafer Capacity of Key Manufacturers in Global Market, 2023-2025 (K Pcs)
Table 87. Global Lithium Tantalate Wafer Capacity Market Share of Key Manufacturers, 2023-2025
Table 88. Global Lithium Tantalate Wafer Production by Region, 2020-2025 (K Pcs)
Table 89. Global Lithium Tantalate Wafer Production by Region, 2026-2032 (K Pcs)
Table 90. Lithium Tantalate Wafer Market Opportunities & Trends in Global Market
Table 91. Lithium Tantalate Wafer Market Drivers in Global Market
Table 92. Lithium Tantalate Wafer Market Restraints in Global Market
Table 93. Lithium Tantalate Wafer Raw Materials
Table 94. Lithium Tantalate Wafer Raw Materials Suppliers in Global Market
Table 95. Typical Lithium Tantalate Wafer Downstream
Table 96. Lithium Tantalate Wafer Downstream Clients in Global Market
Table 97. Lithium Tantalate Wafer Distributors and Sales Agents in Global Market

List of Figures
Figure 1. Lithium Tantalate Wafer Product Picture
Figure 2. Lithium Tantalate Wafer Segment by Type in 2024
Figure 3. Lithium Tantalate Wafer Segment by Application in 2024
Figure 4. Global Lithium Tantalate Wafer Market Overview: 2024
Figure 5. Key Caveats
Figure 6. Global Lithium Tantalate Wafer Market Size: 2024 VS 2032 (US$, Mn)
Figure 7. Global Lithium Tantalate Wafer Revenue: 2020-2032 (US$, Mn)
Figure 8. Lithium Tantalate Wafer Sales in Global Market: 2020-2032 (K Pcs)
Figure 9. The Top 3 and 5 Players Market Share by Lithium Tantalate Wafer Revenue in 2024
Figure 10. Segment by Type – Global Lithium Tantalate Wafer Revenue, (US$, Mn), 2024 & 2032
Figure 11. Segment by Type – Global Lithium Tantalate Wafer Revenue Market Share, 2020-2032
Figure 12. Segment by Type – Global Lithium Tantalate Wafer Sales Market Share, 2020-2032
Figure 13. Segment by Type – Global Lithium Tantalate Wafer Price (US$/Pcs), 2020-2032
Figure 14. Segment by Application – Global Lithium Tantalate Wafer Revenue, (US$, Mn), 2024 & 2032
Figure 15. Segment by Application – Global Lithium Tantalate Wafer Revenue Market Share, 2020-2032
Figure 16. Segment by Application – Global Lithium Tantalate Wafer Sales Market Share, 2020-2032
Figure 17. Segment by Application -Global Lithium Tantalate Wafer Price (US$/Pcs), 2020-2032
Figure 18. By Region – Global Lithium Tantalate Wafer Revenue, (US$, Mn), 2025 & 2032
Figure 19. By Region – Global Lithium Tantalate Wafer Revenue Market Share, 2020 VS 2024 VS 2032
Figure 20. By Region – Global Lithium Tantalate Wafer Revenue Market Share, 2020-2032
Figure 21. By Region – Global Lithium Tantalate Wafer Sales Market Share, 2020-2032
Figure 22. By Country – North America Lithium Tantalate Wafer Revenue Market Share, 2020-2032
Figure 23. By Country – North America Lithium Tantalate Wafer Sales Market Share, 2020-2032
Figure 24. United States Lithium Tantalate Wafer Revenue, (US$, Mn), 2020-2032
Figure 25. Canada Lithium Tantalate Wafer Revenue, (US$, Mn), 2020-2032
Figure 26. Mexico Lithium Tantalate Wafer Revenue, (US$, Mn), 2020-2032
Figure 27. By Country – Europe Lithium Tantalate Wafer Revenue Market Share, 2020-2032
Figure 28. By Country – Europe Lithium Tantalate Wafer Sales Market Share, 2020-2032
Figure 29. Germany Lithium Tantalate Wafer Revenue, (US$, Mn), 2020-2032
Figure 30. France Lithium Tantalate Wafer Revenue, (US$, Mn), 2020-2032
Figure 31. U.K. Lithium Tantalate Wafer Revenue, (US$, Mn), 2020-2032
Figure 32. Italy Lithium Tantalate Wafer Revenue, (US$, Mn), 2020-2032
Figure 33. Russia Lithium Tantalate Wafer Revenue, (US$, Mn), 2020-2032
Figure 34. Nordic Countries Lithium Tantalate Wafer Revenue, (US$, Mn), 2020-2032
Figure 35. Benelux Lithium Tantalate Wafer Revenue, (US$, Mn), 2020-2032
Figure 36. By Region – Asia Lithium Tantalate Wafer Revenue Market Share, 2020-2032
Figure 37. By Region – Asia Lithium Tantalate Wafer Sales Market Share, 2020-2032
Figure 38. China Lithium Tantalate Wafer Revenue, (US$, Mn), 2020-2032
Figure 39. Japan Lithium Tantalate Wafer Revenue, (US$, Mn), 2020-2032
Figure 40. South Korea Lithium Tantalate Wafer Revenue, (US$, Mn), 2020-2032
Figure 41. Southeast Asia Lithium Tantalate Wafer Revenue, (US$, Mn), 2020-2032
Figure 42. India Lithium Tantalate Wafer Revenue, (US$, Mn), 2020-2032
Figure 43. By Country – South America Lithium Tantalate Wafer Revenue Market Share, 2020-2032
Figure 44. By Country – South America Lithium Tantalate Wafer Sales, Market Share, 2020-2032
Figure 45. Brazil Lithium Tantalate Wafer Revenue, (US$, Mn), 2020-2032
Figure 46. Argentina Lithium Tantalate Wafer Revenue, (US$, Mn), 2020-2032
Figure 47. By Country – Middle East & Africa Lithium Tantalate Wafer Revenue, Market Share, 2020-2032
Figure 48. By Country – Middle East & Africa Lithium Tantalate Wafer Sales, Market Share, 2020-2032
Figure 49. Turkey Lithium Tantalate Wafer Revenue, (US$, Mn), 2020-2032
Figure 50. Israel Lithium Tantalate Wafer Revenue, (US$, Mn), 2020-2032
Figure 51. Saudi Arabia Lithium Tantalate Wafer Revenue, (US$, Mn), 2020-2032
Figure 52. UAE Lithium Tantalate Wafer Revenue, (US$, Mn), 2020-2032
Figure 53. Global Lithium Tantalate Wafer Production Capacity (K Pcs), 2020-2032
Figure 54. The Percentage of Production Lithium Tantalate Wafer by Region, 2024 VS 2032
Figure 55. Lithium Tantalate Wafer Industry Value Chain
Figure 56. Marketing Channels