IoT Sensors Market, Global Business Strategies 2026-2033

IoT Sensors Market was valued at USD 12,210 million in 2025 and is projected to reach USD 41,290 million by 2033, exhibiting a CAGR of 19.5% during the forecast period.

PDF Icon Download Sample Report PDF
  • Quick Dispatch

    All Orders

  • Secure Payment

    100% Secure Payment

Price range: $1,500.00 through $4,250.00

Clear

Market Insights

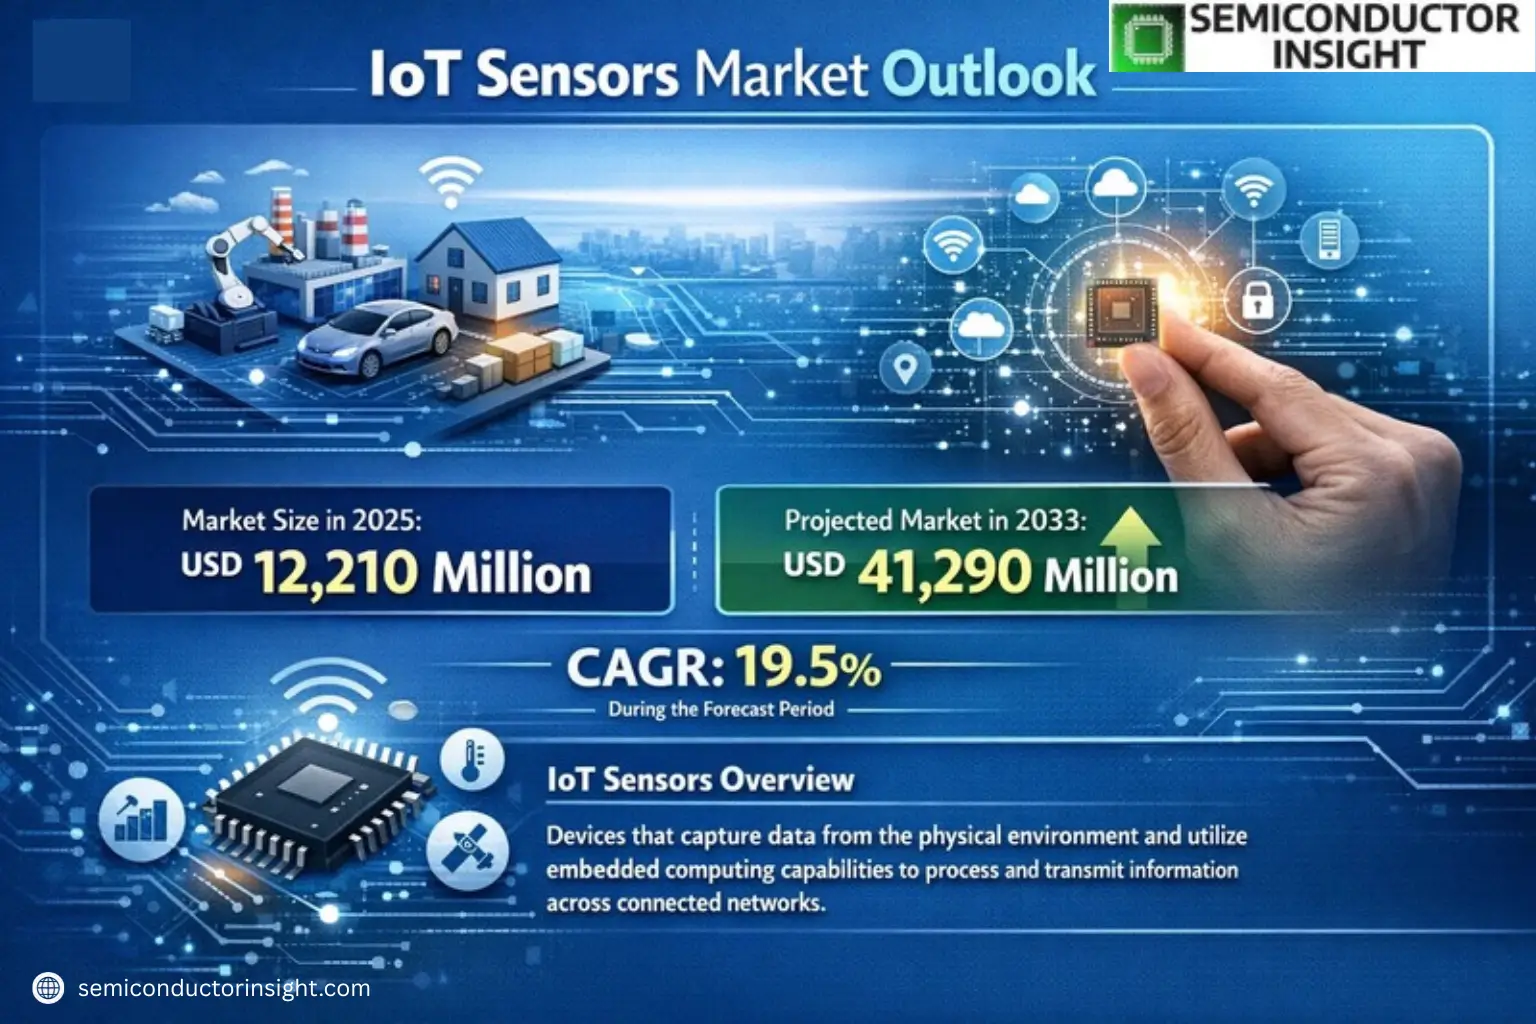
Global IoT Sensors Market was valued at USD 12,210 million in 2025 and is projected to reach USD 41,290 million by 2033, exhibiting a CAGR of 19.5% during the forecast period.

IoT Sensors are devices that capture data from the physical environment and utilize embedded computing capabilities to process and transmit this information across connected networks. These sensors enable autonomous functionality by collecting, analyzing, and sharing real-time data with other IoT-enabled systems. Key sensor types include pressure sensors, environmental sensors, optical sensors, chemical sensors, and motion sensors.

The market growth is driven by increasing adoption across smart city initiatives, industrial automation, and connected healthcare applications. Pressure sensors dominate the market with a 31% share in 2020 due to widespread use in automotive and industrial monitoring systems. Geographically, the Americas lead in consumption with 46% market share in 2020, followed by Europe at 35.11%, while Asia-Pacific emerges as the fastest-growing region fueled by China’s rapid IoT infrastructure development.

Xyz market size & forecast

MARKET DRIVERS

Rising Demand for Smart Devices and Automation

IoT Sensors Market is experiencing significant growth due to the increasing adoption of smart devices across industries. The surge in automation and real-time data monitoring is pushing enterprises to integrate IoT Sensors for predictive maintenance and operational efficiency. Over 45% of industrial facilities now rely on IoT sensor networks for asset tracking.

Government Initiatives and Smart City Projects

Global investments in smart city infrastructure have accelerated IoT sensor deployment, particularly in traffic management and environmental monitoring. Countries are allocating over USD 100 billion annually toward IoT-enabled urban development, driving market expansion.

Advancements in AI and edge computing are further optimizing sensor capabilities, enabling more precise data collection with reduced latency.

MARKET CHALLENGES

High Implementation Costs and Complexity

Deploying IoT sensor networks requires substantial capital expenditure for hardware, software, and integration, which may deter small and medium enterprises. Nearly 60% of companies cite budget constraints as a primary barrier to adoption.

Other Challenges

Data Security Concerns
Cybersecurity risks remain a critical challenge, with IoT Sensors often vulnerable to breaches. Approximately 42% of organizations report security incidents involving compromised sensor networks in the past two years.

MARKET RESTRAINTS

Interoperability Issues Across Platforms

The lack of standardized protocols creates integration hurdles between IoT Sensors and existing infrastructure. This fragmentation reduces system efficiency and increases maintenance costs for end-users.

MARKET OPPORTUNITIES

Expansion in Industrial IoT (IIoT) Applications

Manufacturing sectors are leveraging IoT Sensors for condition-based monitoring, with the IIoT market expected to reach USD 250 billion by 2026. Energy-efficient sensor designs and 5G compatibility present additional growth avenues.

Advancements in Miniaturized Sensor Technology

Nanotechnology innovations are enabling smaller, more durable IoT Sensors with improved battery life, opening applications in wearable tech and precision agriculture.
IoT Sensors Market Trends

Accelerated Growth in IoT Sensor Adoption

Global IoT Sensors Market was valued at USD 12.21 billion in 2025 and is projected to reach USD 41.29 billion by 2033, growing at a CAGR of 19.5%. This rapid expansion is driven by increasing smart infrastructure deployments and industrial automation demand across key sectors. Pressure sensors currently lead market adoption with 31% share, followed by environmental and optical sensors.

Other Trends

Regional Market Developments

The Americas dominate IoT sensor consumption with 46% market share, primarily in connected health and automotive applications. Europe holds 35% share with strong smart city deployments, while APAC emerges as the fastest-growing region led by China’s industrial IoT expansion and smart agriculture projects.

Sector-Specific Application Growth

Smart city applications accounted for 24.04% of IoT sensor demand in 2020, with significant projects in Europe. Connected health solutions show strongest growth in North America, while smart agriculture adoption accelerates across APAC. Industrial IoT applications demonstrate consistent expansion globally, particularly in predictive maintenance systems.

Technology and Competitive Landscape

Leading manufacturers including Bosch, Honeywell, and NXP are expanding sensor portfolios with enhanced connectivity and edge computing capabilities. Market consolidation is increasing through strategic acquisitions, with top five manufacturers controlling significant market share. Emerging innovations focus on energy-efficient designs and multi-sensor fusion technologies.

Future Market Prospects

IoT Sensors Market is transitioning toward AI-integrated solutions with improved data processing capabilities at the edge. 5G network deployments are creating new opportunities for real-time monitoring applications, while sustainability requirements drive demand for low-power sensor designs across all verticals.

COMPETITIVE LANDSCAPE

Key Industry Players

Strategic Positioning in the USD 41.29 Billion IoT Sensors Market

Global IoT Sensors Market is dominated by established electronics and semiconductor giants, with Bosch and Honeywell leading through diversified sensor portfolios and strong R&D capabilities. These players hold significant market share in smart city and industrial IoT applications, leveraging their expertise in pressure, environmental, and motion sensors. The competitive landscape remains fragmented with regional players gaining traction, particularly in APAC markets where demand for smart agriculture and connected buildings is accelerating.

Niche specialists like Sensirion (environmental sensors) and InvenSense (motion sensors) compete through technological differentiation in specific sensor categories. Chinese manufacturers like Huagong Tech and Zhonghang Electronic Measuring Instruments are rapidly expanding their global footprint with cost-competitive offerings, particularly in the optical and chemical sensor segments. The market sees increasing vertical integration as semiconductor companies (STMicroelectronics, NXP) develop complete IoT solutions combining sensors with connectivity chips.

List of Key IoT Sensors Companies Profiled

Segment Analysis:

Segment Category Sub-Segments Key Insights
By Type
  • Pressure Sensor
  • Environmental Sensor
  • Optical Sensor
  • Chemical Sensor
  • Motion Sensor
Pressure Sensors dominate the IoT sensor landscape due to their critical role in industrial automation and smart infrastructure applications. Key factors driving their adoption include:

  • Wide applicability across multiple industries from manufacturing to automotive systems
  • Advanced capabilities for precision monitoring in connected environments
  • Continuous technological enhancements improving reliability and miniaturization
By Application
  • Smart City
  • Connected Industry
  • Connected Building
  • Connected Car
  • Smart Energy
Smart City Applications represent the most significant opportunity for IoT sensor deployment due to:

  • Increasing government investments in urban infrastructure modernization projects globally
  • Growing demand for traffic management, environmental monitoring and public safety solutions
  • Emerging innovations in sensor networks for comprehensive city data collection
  • Strategic partnerships between municipalities and technology providers
By End User
  • Government & Municipalities
  • Industrial Enterprises
  • Automotive Sector
  • Healthcare Providers
Government & Municipalities are the primary adopters of IoT sensor technology because:

  • Public sector initiatives drive large-scale smart city deployments
  • Need for cost-effective urban infrastructure monitoring solutions
  • Growing emphasis on data-driven governance and citizen services
  • Regulatory mandates for environmental monitoring and public safety
By Connectivity
  • Wired Sensors
  • Wireless Sensors
  • Hybrid Solutions
Wireless Sensors are experiencing rapid adoption due to several key advantages:

  • Elimination of complex wiring infrastructure reduces deployment costs
  • Flexibility in sensor placement enables better coverage and data collection
  • Advancements in low-power wireless protocols extending battery life
  • Growing ecosystem of IoT gateways supporting multiple wireless standards
By Technology
  • MEMS Technology
  • CMOS Technology
  • Emerging Sensor Technologies
MEMS Technology dominates the IoT sensor market due to several competitive factors:

  • Superior performance-to-size ratio ideal for space-constrained IoT devices
  • Established manufacturing processes enabling cost-effective mass production
  • Proven reliability across diverse environmental conditions
  • Continuous innovation in hybrid MEMS solutions expanding application potential

Regional Analysis: Global IoT Sensors Market

North America

The North American IoT Sensors Market demonstrates technological leadership with advanced adoption across industries. Major tech hubs in Silicon Valley and Boston drive innovation in miniaturized and energy-efficient sensor designs. The region benefits from strong R&D investments, with corporations and startups collaborating on next-generation smart sensor solutions. Industrial IoT applications in manufacturing and logistics show particularly high penetration, supported by robust 5G infrastructure. The U.S. leads in regulatory frameworks for IoT data security, giving North American manufacturers a competitive edge in developing trusted sensor ecosystems. Cross-industry partnerships between automotive players and sensor vendors are accelerating connected vehicle deployments, while healthcare institutions increasingly adopt wearable and remote monitoring sensor technologies.

Industrial Automation Leadership
North America maintains dominance in industrial IoT Sensors with automated factories adopting vibration, pressure and proximity sensors for predictive maintenance and process optimization. Major manufacturers are retrofitting legacy equipment with wireless sensor networks.
Smart City Deployments
Cities across the U.S. and Canada are implementing large-scale environmental sensor networks for air quality monitoring and traffic management. Municipalities partner with sensor manufacturers to develop customized urban IoT solutions with robust data analytics.
Healthcare Innovation
The region leads in medical-grade IoT Sensors for remote patient monitoring and diagnostic devices. Strict FDA regulations drive sensor quality standards while venture funding fuels development of novel biosensors and wearable health trackers.
Energy Sector Advancements
Smart grid deployments across North America utilize advanced current and voltage sensors for real-time monitoring. Oil and gas operators implement ruggedized IoT Sensors for pipeline integrity management and asset tracking in remote locations.

Europe
The European IoT Sensors Market emphasizes sustainability and precision engineering across industrial applications. Germany and the Nordic countries lead in manufacturing sensor solutions with stringent EU compliance standards for data privacy and energy efficiency. Automotive sensors account for significant market share with major OEMs integrating more connected car technologies. The region shows strong growth in environmental monitoring sensors for climate initiatives and smart building applications. Collaborative research projects between universities and corporations drive innovations in MEMS-based sensor technologies while maintaining strict GDPR-compliant data practices.

Asia-Pacific
Asia-Pacific represents the fastest-growing IoT Sensors Market, led by China’s massive smart city initiatives and Japan’s precision sensor manufacturing. Chinese tech giants are vertically integrating sensor production for domestic IoT deployments in transportation and utilities. India demonstrates accelerating adoption in agricultural and industrial IoT applications. South Korea and Taiwan lead in advanced sensor fabrication technologies, supplying global electronics manufacturers. The region benefits from substantial government support for IoT infrastructure development and local manufacturing ecosystems for cost-effective sensor solutions.

South America
South America’s IoT Sensors Market shows focused growth in agricultural and mining applications, with Brazil and Argentina deploying soil condition and equipment monitoring sensors. Urban areas are implementing smart utility meters and transportation sensors, though infrastructure development remains uneven. Local manufacturers collaborate with global players to adapt sensor technologies for regional environmental conditions. Government initiatives promote industrial IoT adoption while addressing challenges in connectivity infrastructure across rural areas.

Middle East & Africa
The Middle East leads in smart city sensor deployments, particularly in Gulf countries implementing large-scale urban IoT projects. Oil and gas sector drives demand for harsh-environment sensors with increasing automation. Africa shows growing adoption in agricultural IoT and mobile-based sensor applications, leveraging leapfrog technologies. Regional players focus on developing rugged, low-power sensor solutions suited to local climate conditions, with increasing partnerships between telecom providers and sensor manufacturers.

Report Scope

This market research report provides a comprehensive analysis of the IoT Sensors Market, covering the forecast period 2025–2033. It offers detailed insights into market dynamics, technological advancements, competitive landscape, and key trends shaping the industry.

Key focus areas of the report include:

  • Market Overview: The report begins with an overview outlining its current market scenario, key growth indicators, and industry transformation drivers. It discusses macroeconomic factors, demand–supply balance, regulatory landscape, and the strategic role of IoT Sensors in powering advancements across industries such as smart cities, connected industries, connected buildings, and smart agriculture.
  • Market Size & Forecast: Historical data and future projections for revenue, unit shipments, and market value across major regions and segments.
  • Segmentation Analysis: Detailed breakdown by product type, technology, application, and end-user industry to identify high-growth segments and investment opportunities.
  • Regional Insights: Insights into market performance across North America, Europe, Asia-Pacific, Latin America, and the Middle East & Africa, including country-level analysis where relevant.
  • Competitive Landscape: Profiles of leading market participants, including their product offerings, R&D focus, manufacturing capacity, pricing strategies, and recent developments such as mergers, acquisitions, and partnerships.
  • Technology Trends & Innovation: Assessment of emerging technologies, integration of AI/IoT, sensor design trends, and evolving industry standards.
  • Market Drivers & Restraints: Evaluation of factors driving market growth along with challenges, supply chain constraints, regulatory issues, and market-entry barriers.
  • Stakeholder Insights: Insights for component suppliers, OEMs, system integrators, investors, and policymakers regarding the evolving ecosystem and strategic opportunities.

Primary and secondary research methods are employed, including interviews with industry experts, data from verified sources, and real-time market intelligence to ensure the accuracy and reliability of the insights presented.

FREQUENTLY ASKED QUESTIONS:

What is the current market size of IoT Sensors Market?

-> IoT Sensors Market was valued at USD 12,210 million in 2025 and is projected to reach USD 41,290 million by 2033, exhibiting a CAGR of 19.5% during the forecast period.

Which key companies operate in IoT Sensors Market?

-> Key players include Bosch, Honeywell, NXP, Infineon, Analog Devices, Panasonic, InvenSense, TI, Silicon Laboratories, ABB, STMicroelectronics, TE Connectivity, Huagong Tech, Sensirion, Zhonghang Electronic Measuring Instruments, Vishay, Hanwei Electronics, Semtech, and Omron, among others.

What are the key growth drivers?

-> Key growth drivers include increasing adoption of IoT platforms, demand for autonomous devices, and advancements in connected technologies across industries.

Which region dominates the market?

-> Americas is the largest consumption region, with a revenue market share of nearly 46% in 2020, followed by Europe (35.11%). APAC is the fastest-growing region, especially China.

What are the emerging applications?

-> Emerging applications include smart cities (24.04% market demand in 2020), connected health, connected cars, and smart agriculture.

IoT Sensors Market, Global Business Strategies 2026-2033

Get Sample Report PDF for Exclusive Insights

Report Sample Includes

  • Table of Contents
  • List of Tables & Figures
  • Charts, Research Methodology, and more...
PDF Icon Download Sample Report PDF
SKU: 173b02e07b05
Category:
Tag:
License Type

Corporate License, Excel License, PDF and Excel Databook License

Download Sample Report

Table of Content

1 Introduction to Research & Analysis Reports
1.1 IoT Sensors Market Definition
1.2 Market Segments
1.2.1 Segment by Type
1.2.2 Segment by Application
1.3 Global IoT Sensors Market Overview
1.4 Features & Benefits of This Report
1.5 Methodology & Sources of Information
1.5.1 Research Methodology
1.5.2 Research Process
1.5.3 Base Year
1.5.4 Report Assumptions & Caveats
2 Global IoT Sensors Overall Market Size
2.1 Global IoT Sensors Market Size: 2024 VS 2032
2.2 Global IoT Sensors Market Size, Prospects & Forecasts: 2020-2032
2.3 Global IoT Sensors Sales: 2020-2032
3 Company Landscape
3.1 Top IoT Sensors Players in Global Market
3.2 Top Global IoT Sensors Companies Ranked by Revenue
3.3 Global IoT Sensors Revenue by Companies
3.4 Global IoT Sensors Sales by Companies
3.5 Global IoT Sensors Price by Manufacturer (2020-2025)
3.6 Top 3 and Top 5 IoT Sensors Companies in Global Market, by Revenue in 2024
3.7 Global Manufacturers IoT Sensors Product Type
3.8 Tier 1, Tier 2, and Tier 3 IoT Sensors Players in Global Market
3.8.1 List of Global Tier 1 IoT Sensors Companies
3.8.2 List of Global Tier 2 and Tier 3 IoT Sensors Companies
4 Sights by Product
4.1 Overview
4.1.1 Segment by Type – Global IoT Sensors Market Size Markets, 2024 & 2032
4.1.2 Pressure Sensor
4.1.3 Environmental Sensor
4.1.4 Optical Sensor
4.1.5 Chemical Sensor
4.1.6 Motion Sensor
4.1.7 Others
4.2 Segment by Type – Global IoT Sensors Revenue & Forecasts
4.2.1 Segment by Type – Global IoT Sensors Revenue, 2020-2025
4.2.2 Segment by Type – Global IoT Sensors Revenue, 2026-2032
4.2.3 Segment by Type – Global IoT Sensors Revenue Market Share, 2020-2032
4.3 Segment by Type – Global IoT Sensors Sales & Forecasts
4.3.1 Segment by Type – Global IoT Sensors Sales, 2020-2025
4.3.2 Segment by Type – Global IoT Sensors Sales, 2026-2032
4.3.3 Segment by Type – Global IoT Sensors Sales Market Share, 2020-2032
4.4 Segment by Type – Global IoT Sensors Price (Manufacturers Selling Prices), 2020-2032
5 Sights by Application
5.1 Overview
5.1.1 Segment by Application – Global IoT Sensors Market Size, 2024 & 2032
5.1.2 Smart City
5.1.3 Connected Industry
5.1.4 Connected Building
5.1.5 Connected Car
5.1.6 Smart Energy
5.1.7 Connected Health
5.1.8 Smart Agriculture
5.1.9 Others
5.2 Segment by Application – Global IoT Sensors Revenue & Forecasts
5.2.1 Segment by Application – Global IoT Sensors Revenue, 2020-2025
5.2.2 Segment by Application – Global IoT Sensors Revenue, 2026-2032
5.2.3 Segment by Application – Global IoT Sensors Revenue Market Share, 2020-2032
5.3 Segment by Application – Global IoT Sensors Sales & Forecasts
5.3.1 Segment by Application – Global IoT Sensors Sales, 2020-2025
5.3.2 Segment by Application – Global IoT Sensors Sales, 2026-2032
5.3.3 Segment by Application – Global IoT Sensors Sales Market Share, 2020-2032
5.4 Segment by Application – Global IoT Sensors Price (Manufacturers Selling Prices), 2020-2032
6 Sights by Region
6.1 By Region – Global IoT Sensors Market Size, 2024 & 2032
6.2 By Region – Global IoT Sensors Revenue & Forecasts
6.2.1 By Region – Global IoT Sensors Revenue, 2020-2025
6.2.2 By Region – Global IoT Sensors Revenue, 2026-2032
6.2.3 By Region – Global IoT Sensors Revenue Market Share, 2020-2032
6.3 By Region – Global IoT Sensors Sales & Forecasts
6.3.1 By Region – Global IoT Sensors Sales, 2020-2025
6.3.2 By Region – Global IoT Sensors Sales, 2026-2032
6.3.3 By Region – Global IoT Sensors Sales Market Share, 2020-2032
6.4 North America
6.4.1 By Country – North America IoT Sensors Revenue, 2020-2032
6.4.2 By Country – North America IoT Sensors Sales, 2020-2032
6.4.3 United States IoT Sensors Market Size, 2020-2032
6.4.4 Canada IoT Sensors Market Size, 2020-2032
6.4.5 Mexico IoT Sensors Market Size, 2020-2032
6.5 Europe
6.5.1 By Country – Europe IoT Sensors Revenue, 2020-2032
6.5.2 By Country – Europe IoT Sensors Sales, 2020-2032
6.5.3 Germany IoT Sensors Market Size, 2020-2032
6.5.4 France IoT Sensors Market Size, 2020-2032
6.5.5 U.K. IoT Sensors Market Size, 2020-2032
6.5.6 Italy IoT Sensors Market Size, 2020-2032
6.5.7 Russia IoT Sensors Market Size, 2020-2032
6.5.8 Nordic Countries IoT Sensors Market Size, 2020-2032
6.5.9 Benelux IoT Sensors Market Size, 2020-2032
6.6 Asia
6.6.1 By Region – Asia IoT Sensors Revenue, 2020-2032
6.6.2 By Region – Asia IoT Sensors Sales, 2020-2032
6.6.3 China IoT Sensors Market Size, 2020-2032
6.6.4 Japan IoT Sensors Market Size, 2020-2032
6.6.5 South Korea IoT Sensors Market Size, 2020-2032
6.6.6 Southeast Asia IoT Sensors Market Size, 2020-2032
6.6.7 India IoT Sensors Market Size, 2020-2032
6.7 South America
6.7.1 By Country – South America IoT Sensors Revenue, 2020-2032
6.7.2 By Country – South America IoT Sensors Sales, 2020-2032
6.7.3 Brazil IoT Sensors Market Size, 2020-2032
6.7.4 Argentina IoT Sensors Market Size, 2020-2032
6.8 Middle East & Africa
6.8.1 By Country – Middle East & Africa IoT Sensors Revenue, 2020-2032
6.8.2 By Country – Middle East & Africa IoT Sensors Sales, 2020-2032
6.8.3 Turkey IoT Sensors Market Size, 2020-2032
6.8.4 Israel IoT Sensors Market Size, 2020-2032
6.8.5 Saudi Arabia IoT Sensors Market Size, 2020-2032
6.8.6 UAE IoT Sensors Market Size, 2020-2032
7 Manufacturers & Brands Profiles
7.1 Bosch
7.1.1 Bosch Company Summary
7.1.2 Bosch Business Overview
7.1.3 Bosch IoT Sensors Major Product Offerings
7.1.4 Bosch IoT Sensors Sales and Revenue in Global (2020-2025)
7.1.5 Bosch Key News & Latest Developments
7.2 Honeywell
7.2.1 Honeywell Company Summary
7.2.2 Honeywell Business Overview
7.2.3 Honeywell IoT Sensors Major Product Offerings
7.2.4 Honeywell IoT Sensors Sales and Revenue in Global (2020-2025)
7.2.5 Honeywell Key News & Latest Developments
7.3 NXP
7.3.1 NXP Company Summary
7.3.2 NXP Business Overview
7.3.3 NXP IoT Sensors Major Product Offerings
7.3.4 NXP IoT Sensors Sales and Revenue in Global (2020-2025)
7.3.5 NXP Key News & Latest Developments
7.4 Infineon
7.4.1 Infineon Company Summary
7.4.2 Infineon Business Overview
7.4.3 Infineon IoT Sensors Major Product Offerings
7.4.4 Infineon IoT Sensors Sales and Revenue in Global (2020-2025)
7.4.5 Infineon Key News & Latest Developments
7.5 Analog Devices
7.5.1 Analog Devices Company Summary
7.5.2 Analog Devices Business Overview
7.5.3 Analog Devices IoT Sensors Major Product Offerings
7.5.4 Analog Devices IoT Sensors Sales and Revenue in Global (2020-2025)
7.5.5 Analog Devices Key News & Latest Developments
7.6 Panasonic
7.6.1 Panasonic Company Summary
7.6.2 Panasonic Business Overview
7.6.3 Panasonic IoT Sensors Major Product Offerings
7.6.4 Panasonic IoT Sensors Sales and Revenue in Global (2020-2025)
7.6.5 Panasonic Key News & Latest Developments
7.7 InvenSense
7.7.1 InvenSense Company Summary
7.7.2 InvenSense Business Overview
7.7.3 InvenSense IoT Sensors Major Product Offerings
7.7.4 InvenSense IoT Sensors Sales and Revenue in Global (2020-2025)
7.7.5 InvenSense Key News & Latest Developments
7.8 TI
7.8.1 TI Company Summary
7.8.2 TI Business Overview
7.8.3 TI IoT Sensors Major Product Offerings
7.8.4 TI IoT Sensors Sales and Revenue in Global (2020-2025)
7.8.5 TI Key News & Latest Developments
7.9 Silicon Laboratories
7.9.1 Silicon Laboratories Company Summary
7.9.2 Silicon Laboratories Business Overview
7.9.3 Silicon Laboratories IoT Sensors Major Product Offerings
7.9.4 Silicon Laboratories IoT Sensors Sales and Revenue in Global (2020-2025)
7.9.5 Silicon Laboratories Key News & Latest Developments
7.10 ABB
7.10.1 ABB Company Summary
7.10.2 ABB Business Overview
7.10.3 ABB IoT Sensors Major Product Offerings
7.10.4 ABB IoT Sensors Sales and Revenue in Global (2020-2025)
7.10.5 ABB Key News & Latest Developments
7.11 STMicroelectronics
7.11.1 STMicroelectronics Company Summary
7.11.2 STMicroelectronics Business Overview
7.11.3 STMicroelectronics IoT Sensors Major Product Offerings
7.11.4 STMicroelectronics IoT Sensors Sales and Revenue in Global (2020-2025)
7.11.5 STMicroelectronics Key News & Latest Developments
7.12 TE Connectivity
7.12.1 TE Connectivity Company Summary
7.12.2 TE Connectivity Business Overview
7.12.3 TE Connectivity IoT Sensors Major Product Offerings
7.12.4 TE Connectivity IoT Sensors Sales and Revenue in Global (2020-2025)
7.12.5 TE Connectivity Key News & Latest Developments
7.13 Huagong Tech
7.13.1 Huagong Tech Company Summary
7.13.2 Huagong Tech Business Overview
7.13.3 Huagong Tech IoT Sensors Major Product Offerings
7.13.4 Huagong Tech IoT Sensors Sales and Revenue in Global (2020-2025)
7.13.5 Huagong Tech Key News & Latest Developments
7.14 Sensirion
7.14.1 Sensirion Company Summary
7.14.2 Sensirion Business Overview
7.14.3 Sensirion IoT Sensors Major Product Offerings
7.14.4 Sensirion IoT Sensors Sales and Revenue in Global (2020-2025)
7.14.5 Sensirion Key News & Latest Developments
7.15 Zhonghang Electronic Measuring Instruments
7.15.1 Zhonghang Electronic Measuring Instruments Company Summary
7.15.2 Zhonghang Electronic Measuring Instruments Business Overview
7.15.3 Zhonghang Electronic Measuring Instruments IoT Sensors Major Product Offerings
7.15.4 Zhonghang Electronic Measuring Instruments IoT Sensors Sales and Revenue in Global (2020-2025)
7.15.5 Zhonghang Electronic Measuring Instruments Key News & Latest Developments
7.16 Vishay
7.16.1 Vishay Company Summary
7.16.2 Vishay Business Overview
7.16.3 Vishay IoT Sensors Major Product Offerings
7.16.4 Vishay IoT Sensors Sales and Revenue in Global (2020-2025)
7.16.5 Vishay Key News & Latest Developments
7.17 Hanwei Electronics
7.17.1 Hanwei Electronics Company Summary
7.17.2 Hanwei Electronics Business Overview
7.17.3 Hanwei Electronics IoT Sensors Major Product Offerings
7.17.4 Hanwei Electronics IoT Sensors Sales and Revenue in Global (2020-2025)
7.17.5 Hanwei Electronics Key News & Latest Developments
7.18 Semtech
7.18.1 Semtech Company Summary
7.18.2 Semtech Business Overview
7.18.3 Semtech IoT Sensors Major Product Offerings
7.18.4 Semtech IoT Sensors Sales and Revenue in Global (2020-2025)
7.18.5 Semtech Key News & Latest Developments
7.19 Omron
7.19.1 Omron Company Summary
7.19.2 Omron Business Overview
7.19.3 Omron IoT Sensors Major Product Offerings
7.19.4 Omron IoT Sensors Sales and Revenue in Global (2020-2025)
7.19.5 Omron Key News & Latest Developments
8 Global IoT Sensors Production Capacity, Analysis
8.1 Global IoT Sensors Production Capacity, 2020-2032
8.2 IoT Sensors Production Capacity of Key Manufacturers in Global Market
8.3 Global IoT Sensors Production by Region
9 Key Market Trends, Opportunity, Drivers and Restraints
9.1 Market Opportunities & Trends
9.2 Market Drivers
9.3 Market Restraints
10 IoT Sensors Supply Chain Analysis
10.1 IoT Sensors Industry Value Chain
10.2 IoT Sensors Upstream Market
10.3 IoT Sensors Downstream and Clients
10.4 Marketing Channels Analysis
10.4.1 Marketing Channels
10.4.2 IoT Sensors Distributors and Sales Agents in Global
11 Conclusion
12 Appendix
12.1 Note
12.2 Examples of Clients
12.3 DisclaimerList of Tables
Table 1. Key Players of IoT Sensors in Global Market
Table 2. Top IoT Sensors Players in Global Market, Ranking by Revenue (2024)
Table 3. Global IoT Sensors Revenue by Companies, (US$, Mn), 2020-2025
Table 4. Global IoT Sensors Revenue Share by Companies, 2020-2025
Table 5. Global IoT Sensors Sales by Companies, (K Units), 2020-2025
Table 6. Global IoT Sensors Sales Share by Companies, 2020-2025
Table 7. Key Manufacturers IoT Sensors Price (2020-2025) & (USD/Unit)
Table 8. Global Manufacturers IoT Sensors Product Type
Table 9. List of Global Tier 1 IoT Sensors Companies, Revenue (US$, Mn) in 2024 and Market Share
Table 10. List of Global Tier 2 and Tier 3 IoT Sensors Companies, Revenue (US$, Mn) in 2024 and Market Share
Table 11. Segment by Type – Global IoT Sensors Revenue, (US$, Mn), 2024 & 2032
Table 12. Segment by Type – Global IoT Sensors Revenue (US$, Mn), 2020-2025
Table 13. Segment by Type – Global IoT Sensors Revenue (US$, Mn), 2026-2032
Table 14. Segment by Type – Global IoT Sensors Sales (K Units), 2020-2025
Table 15. Segment by Type – Global IoT Sensors Sales (K Units), 2026-2032
Table 16. Segment by Application – Global IoT Sensors Revenue, (US$, Mn), 2024 & 2032
Table 17. Segment by Application – Global IoT Sensors Revenue, (US$, Mn), 2020-2025
Table 18. Segment by Application – Global IoT Sensors Revenue, (US$, Mn), 2026-2032
Table 19. Segment by Application – Global IoT Sensors Sales, (K Units), 2020-2025
Table 20. Segment by Application – Global IoT Sensors Sales, (K Units), 2026-2032
Table 21. By Region – Global IoT Sensors Revenue, (US$, Mn), 2025-2032
Table 22. By Region – Global IoT Sensors Revenue, (US$, Mn), 2020-2025
Table 23. By Region – Global IoT Sensors Revenue, (US$, Mn), 2026-2032
Table 24. By Region – Global IoT Sensors Sales, (K Units), 2020-2025
Table 25. By Region – Global IoT Sensors Sales, (K Units), 2026-2032
Table 26. By Country – North America IoT Sensors Revenue, (US$, Mn), 2020-2025
Table 27. By Country – North America IoT Sensors Revenue, (US$, Mn), 2026-2032
Table 28. By Country – North America IoT Sensors Sales, (K Units), 2020-2025
Table 29. By Country – North America IoT Sensors Sales, (K Units), 2026-2032
Table 30. By Country – Europe IoT Sensors Revenue, (US$, Mn), 2020-2025
Table 31. By Country – Europe IoT Sensors Revenue, (US$, Mn), 2026-2032
Table 32. By Country – Europe IoT Sensors Sales, (K Units), 2020-2025
Table 33. By Country – Europe IoT Sensors Sales, (K Units), 2026-2032
Table 34. By Region – Asia IoT Sensors Revenue, (US$, Mn), 2020-2025
Table 35. By Region – Asia IoT Sensors Revenue, (US$, Mn), 2026-2032
Table 36. By Region – Asia IoT Sensors Sales, (K Units), 2020-2025
Table 37. By Region – Asia IoT Sensors Sales, (K Units), 2026-2032
Table 38. By Country – South America IoT Sensors Revenue, (US$, Mn), 2020-2025
Table 39. By Country – South America IoT Sensors Revenue, (US$, Mn), 2026-2032
Table 40. By Country – South America IoT Sensors Sales, (K Units), 2020-2025
Table 41. By Country – South America IoT Sensors Sales, (K Units), 2026-2032
Table 42. By Country – Middle East & Africa IoT Sensors Revenue, (US$, Mn), 2020-2025
Table 43. By Country – Middle East & Africa IoT Sensors Revenue, (US$, Mn), 2026-2032
Table 44. By Country – Middle East & Africa IoT Sensors Sales, (K Units), 2020-2025
Table 45. By Country – Middle East & Africa IoT Sensors Sales, (K Units), 2026-2032
Table 46. Bosch Company Summary
Table 47. Bosch IoT Sensors Product Offerings
Table 48. Bosch IoT Sensors Sales (K Units), Revenue (US$, Mn) and Average Price (USD/Unit) & (2020-2025)
Table 49. Bosch Key News & Latest Developments
Table 50. Honeywell Company Summary
Table 51. Honeywell IoT Sensors Product Offerings
Table 52. Honeywell IoT Sensors Sales (K Units), Revenue (US$, Mn) and Average Price (USD/Unit) & (2020-2025)
Table 53. Honeywell Key News & Latest Developments
Table 54. NXP Company Summary
Table 55. NXP IoT Sensors Product Offerings
Table 56. NXP IoT Sensors Sales (K Units), Revenue (US$, Mn) and Average Price (USD/Unit) & (2020-2025)
Table 57. NXP Key News & Latest Developments
Table 58. Infineon Company Summary
Table 59. Infineon IoT Sensors Product Offerings
Table 60. Infineon IoT Sensors Sales (K Units), Revenue (US$, Mn) and Average Price (USD/Unit) & (2020-2025)
Table 61. Infineon Key News & Latest Developments
Table 62. Analog Devices Company Summary
Table 63. Analog Devices IoT Sensors Product Offerings
Table 64. Analog Devices IoT Sensors Sales (K Units), Revenue (US$, Mn) and Average Price (USD/Unit) & (2020-2025)
Table 65. Analog Devices Key News & Latest Developments
Table 66. Panasonic Company Summary
Table 67. Panasonic IoT Sensors Product Offerings
Table 68. Panasonic IoT Sensors Sales (K Units), Revenue (US$, Mn) and Average Price (USD/Unit) & (2020-2025)
Table 69. Panasonic Key News & Latest Developments
Table 70. InvenSense Company Summary
Table 71. InvenSense IoT Sensors Product Offerings
Table 72. InvenSense IoT Sensors Sales (K Units), Revenue (US$, Mn) and Average Price (USD/Unit) & (2020-2025)
Table 73. InvenSense Key News & Latest Developments
Table 74. TI Company Summary
Table 75. TI IoT Sensors Product Offerings
Table 76. TI IoT Sensors Sales (K Units), Revenue (US$, Mn) and Average Price (USD/Unit) & (2020-2025)
Table 77. TI Key News & Latest Developments
Table 78. Silicon Laboratories Company Summary
Table 79. Silicon Laboratories IoT Sensors Product Offerings
Table 80. Silicon Laboratories IoT Sensors Sales (K Units), Revenue (US$, Mn) and Average Price (USD/Unit) & (2020-2025)
Table 81. Silicon Laboratories Key News & Latest Developments
Table 82. ABB Company Summary
Table 83. ABB IoT Sensors Product Offerings
Table 84. ABB IoT Sensors Sales (K Units), Revenue (US$, Mn) and Average Price (USD/Unit) & (2020-2025)
Table 85. ABB Key News & Latest Developments
Table 86. STMicroelectronics Company Summary
Table 87. STMicroelectronics IoT Sensors Product Offerings
Table 88. STMicroelectronics IoT Sensors Sales (K Units), Revenue (US$, Mn) and Average Price (USD/Unit) & (2020-2025)
Table 89. STMicroelectronics Key News & Latest Developments
Table 90. TE Connectivity Company Summary
Table 91. TE Connectivity IoT Sensors Product Offerings
Table 92. TE Connectivity IoT Sensors Sales (K Units), Revenue (US$, Mn) and Average Price (USD/Unit) & (2020-2025)
Table 93. TE Connectivity Key News & Latest Developments
Table 94. Huagong Tech Company Summary
Table 95. Huagong Tech IoT Sensors Product Offerings
Table 96. Huagong Tech IoT Sensors Sales (K Units), Revenue (US$, Mn) and Average Price (USD/Unit) & (2020-2025)
Table 97. Huagong Tech Key News & Latest Developments
Table 98. Sensirion Company Summary
Table 99. Sensirion IoT Sensors Product Offerings
Table 100. Sensirion IoT Sensors Sales (K Units), Revenue (US$, Mn) and Average Price (USD/Unit) & (2020-2025)
Table 101. Sensirion Key News & Latest Developments
Table 102. Zhonghang Electronic Measuring Instruments Company Summary
Table 103. Zhonghang Electronic Measuring Instruments IoT Sensors Product Offerings
Table 104. Zhonghang Electronic Measuring Instruments IoT Sensors Sales (K Units), Revenue (US$, Mn) and Average Price (USD/Unit) & (2020-2025)
Table 105. Zhonghang Electronic Measuring Instruments Key News & Latest Developments
Table 106. Vishay Company Summary
Table 107. Vishay IoT Sensors Product Offerings
Table 108. Vishay IoT Sensors Sales (K Units), Revenue (US$, Mn) and Average Price (USD/Unit) & (2020-2025)
Table 109. Vishay Key News & Latest Developments
Table 110. Hanwei Electronics Company Summary
Table 111. Hanwei Electronics IoT Sensors Product Offerings
Table 112. Hanwei Electronics IoT Sensors Sales (K Units), Revenue (US$, Mn) and Average Price (USD/Unit) & (2020-2025)
Table 113. Hanwei Electronics Key News & Latest Developments
Table 114. Semtech Company Summary
Table 115. Semtech IoT Sensors Product Offerings
Table 116. Semtech IoT Sensors Sales (K Units), Revenue (US$, Mn) and Average Price (USD/Unit) & (2020-2025)
Table 117. Semtech Key News & Latest Developments
Table 118. Omron Company Summary
Table 119. Omron IoT Sensors Product Offerings
Table 120. Omron IoT Sensors Sales (K Units), Revenue (US$, Mn) and Average Price (USD/Unit) & (2020-2025)
Table 121. Omron Key News & Latest Developments
Table 122. IoT Sensors Capacity of Key Manufacturers in Global Market, 2023-2025 (K Units)
Table 123. Global IoT Sensors Capacity Market Share of Key Manufacturers, 2023-2025
Table 124. Global IoT Sensors Production by Region, 2020-2025 (K Units)
Table 125. Global IoT Sensors Production by Region, 2026-2032 (K Units)
Table 126. IoT Sensors Market Opportunities & Trends in Global Market
Table 127. IoT Sensors Market Drivers in Global Market
Table 128. IoT Sensors Market Restraints in Global Market
Table 129. IoT Sensors Raw Materials
Table 130. IoT Sensors Raw Materials Suppliers in Global Market
Table 131. Typical IoT Sensors Downstream
Table 132. IoT Sensors Downstream Clients in Global Market
Table 133. IoT Sensors Distributors and Sales Agents in Global Market

List of Figures
Figure 1. IoT Sensors Product Picture
Figure 2. IoT Sensors Segment by Type in 2024
Figure 3. IoT Sensors Segment by Application in 2024
Figure 4. Global IoT Sensors Market Overview: 2024
Figure 5. Key Caveats
Figure 6. Global IoT Sensors Market Size: 2024 VS 2032 (US$, Mn)
Figure 7. Global IoT Sensors Revenue: 2020-2032 (US$, Mn)
Figure 8. IoT Sensors Sales in Global Market: 2020-2032 (K Units)
Figure 9. The Top 3 and 5 Players Market Share by IoT Sensors Revenue in 2024
Figure 10. Segment by Type – Global IoT Sensors Revenue, (US$, Mn), 2024 & 2032
Figure 11. Segment by Type – Global IoT Sensors Revenue Market Share, 2020-2032
Figure 12. Segment by Type – Global IoT Sensors Sales Market Share, 2020-2032
Figure 13. Segment by Type – Global IoT Sensors Price (USD/Unit), 2020-2032
Figure 14. Segment by Application – Global IoT Sensors Revenue, (US$, Mn), 2024 & 2032
Figure 15. Segment by Application – Global IoT Sensors Revenue Market Share, 2020-2032
Figure 16. Segment by Application – Global IoT Sensors Sales Market Share, 2020-2032
Figure 17. Segment by Application -Global IoT Sensors Price (USD/Unit), 2020-2032
Figure 18. By Region – Global IoT Sensors Revenue, (US$, Mn), 2025 & 2032
Figure 19. By Region – Global IoT Sensors Revenue Market Share, 2020 VS 2024 VS 2032
Figure 20. By Region – Global IoT Sensors Revenue Market Share, 2020-2032
Figure 21. By Region – Global IoT Sensors Sales Market Share, 2020-2032
Figure 22. By Country – North America IoT Sensors Revenue Market Share, 2020-2032
Figure 23. By Country – North America IoT Sensors Sales Market Share, 2020-2032
Figure 24. United States IoT Sensors Revenue, (US$, Mn), 2020-2032
Figure 25. Canada IoT Sensors Revenue, (US$, Mn), 2020-2032
Figure 26. Mexico IoT Sensors Revenue, (US$, Mn), 2020-2032
Figure 27. By Country – Europe IoT Sensors Revenue Market Share, 2020-2032
Figure 28. By Country – Europe IoT Sensors Sales Market Share, 2020-2032
Figure 29. Germany IoT Sensors Revenue, (US$, Mn), 2020-2032
Figure 30. France IoT Sensors Revenue, (US$, Mn), 2020-2032
Figure 31. U.K. IoT Sensors Revenue, (US$, Mn), 2020-2032
Figure 32. Italy IoT Sensors Revenue, (US$, Mn), 2020-2032
Figure 33. Russia IoT Sensors Revenue, (US$, Mn), 2020-2032
Figure 34. Nordic Countries IoT Sensors Revenue, (US$, Mn), 2020-2032
Figure 35. Benelux IoT Sensors Revenue, (US$, Mn), 2020-2032
Figure 36. By Region – Asia IoT Sensors Revenue Market Share, 2020-2032
Figure 37. By Region – Asia IoT Sensors Sales Market Share, 2020-2032
Figure 38. China IoT Sensors Revenue, (US$, Mn), 2020-2032
Figure 39. Japan IoT Sensors Revenue, (US$, Mn), 2020-2032
Figure 40. South Korea IoT Sensors Revenue, (US$, Mn), 2020-2032
Figure 41. Southeast Asia IoT Sensors Revenue, (US$, Mn), 2020-2032
Figure 42. India IoT Sensors Revenue, (US$, Mn), 2020-2032
Figure 43. By Country – South America IoT Sensors Revenue Market Share, 2020-2032
Figure 44. By Country – South America IoT Sensors Sales, Market Share, 2020-2032
Figure 45. Brazil IoT Sensors Revenue, (US$, Mn), 2020-2032
Figure 46. Argentina IoT Sensors Revenue, (US$, Mn), 2020-2032
Figure 47. By Country – Middle East & Africa IoT Sensors Revenue, Market Share, 2020-2032
Figure 48. By Country – Middle East & Africa IoT Sensors Sales, Market Share, 2020-2032
Figure 49. Turkey IoT Sensors Revenue, (US$, Mn), 2020-2032
Figure 50. Israel IoT Sensors Revenue, (US$, Mn), 2020-2032
Figure 51. Saudi Arabia IoT Sensors Revenue, (US$, Mn), 2020-2032
Figure 52. UAE IoT Sensors Revenue, (US$, Mn), 2020-2032
Figure 53. Global IoT Sensors Production Capacity (K Units), 2020-2032
Figure 54. The Percentage of Production IoT Sensors by Region, 2024 VS 2032
Figure 55. IoT Sensors Industry Value Chain
Figure 56. Marketing Channels