MARKET INSIGHTS
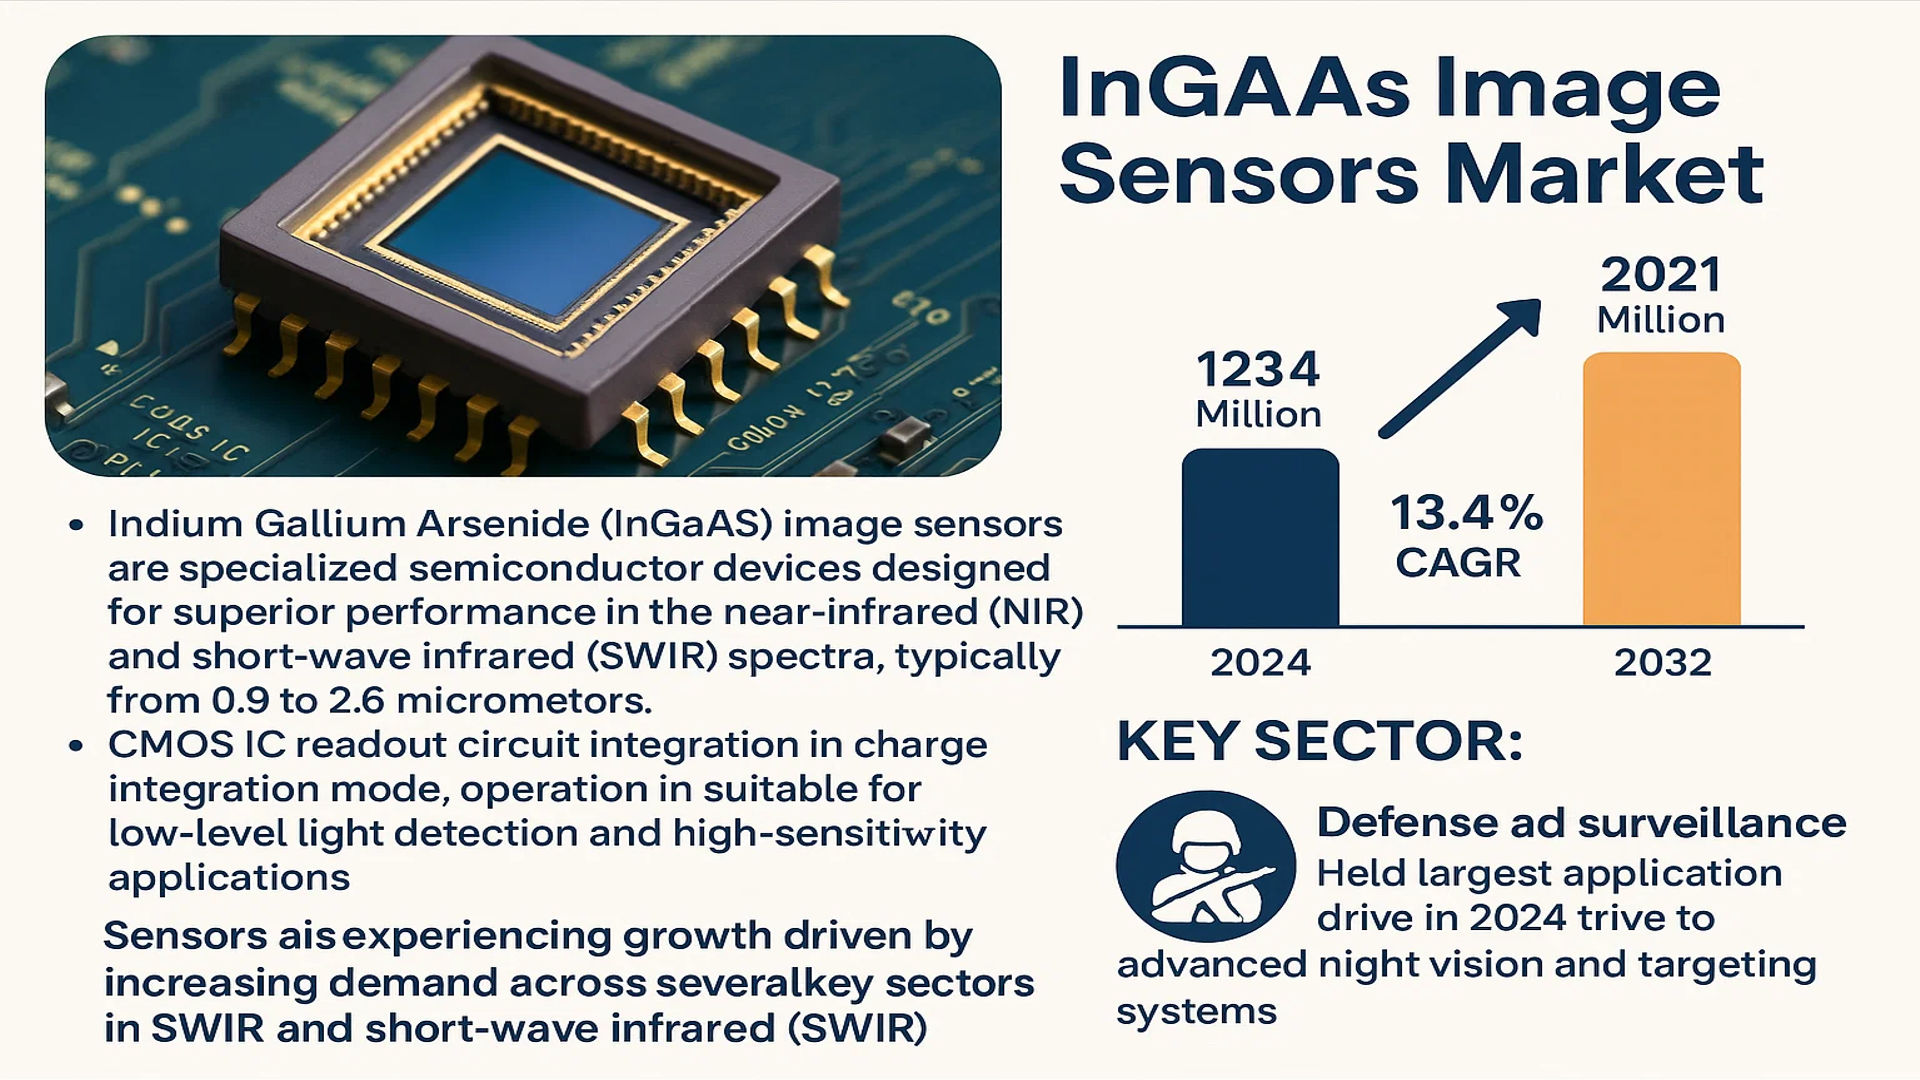
The global InGaAs Image Sensors Market was valued at 1234 million in 2024 and is projected to reach US$ 2921 million by 2032, at a CAGR of 13.4% during the forecast period.
Indium Gallium Arsenide (InGaAs) image sensors are specialized semiconductor devices designed for superior performance in the near-infrared (NIR) and short-wave infrared (SWIR) spectra, typically from 0.9 to 2.6 micrometers. These sensors integrate a CMOS IC readout circuit for simplified signal processing and operate in charge integration mode, which accumulates generated charge to amplify the output signal. This makes them exceptionally well-suited for low-level light detection and high-sensitivity applications.
The market is experiencing robust growth driven by increasing demand across several key sectors. The expansion of defense and surveillance applications, which held the largest application share in 2024, is a primary driver due to the critical need for advanced night vision and targeting systems. Furthermore, growth in industrial measurement and process control, particularly for quality inspection and sorting, is contributing significantly. Technological advancements in optical communication, specifically for dense wavelength division multiplexing (DWDM) systems, and their use in scientific physics and chemistry measurement are also propelling the market forward. The competitive landscape is concentrated, with the top five manufacturers collectively holding approximately 60% of the global market share. Key players such as Hamamatsu Photonics, Teledyne DALSA, and Xenics continue to drive innovation and market expansion with their extensive product portfolios.
MARKET DYNAMICS
MARKET DRIVERS
Expanding Defense and Surveillance Applications to Accelerate Market Growth
The global InGaAs image sensors market is experiencing robust growth driven by increasing adoption in defense and surveillance applications. These sensors provide superior performance in low-light and near-infrared conditions, making them indispensable for night vision systems, border surveillance, and target identification. The defense sector’s ongoing modernization programs worldwide are significantly contributing to this demand. Investments in advanced imaging technologies for military applications have risen substantially, with global defense spending reaching approximately 2443 billion in recent years. Enhanced capabilities in intelligence, surveillance, and reconnaissance (ISR) operations further propel the need for high-sensitivity InGaAs sensors, which offer critical advantages over traditional silicon-based sensors in specific spectral ranges.
Rising Demand in Industrial Automation and Quality Control to Fuel Adoption
Industrial automation and precision measurement applications are major drivers for the InGaAs image sensors market. These sensors are extensively used in machine vision systems for quality control, sorting, and non-destructive testing across various industries including semiconductor manufacturing, food processing, and pharmaceuticals. The ability of InGaAs sensors to detect in the short-wave infrared (SWIR) spectrum enables them to see through certain materials and identify defects invisible to other imaging technologies. The global industrial automation market has been growing at a compound annual growth rate of nearly 9%, creating substantial opportunities for advanced imaging components. Manufacturers are increasingly integrating these sensors into production lines to improve efficiency, reduce waste, and ensure product quality, driving continuous market expansion.
Advancements in Optical Communication Infrastructure to Stimulate Market Development
The rapid expansion of optical communication networks represents a significant growth driver for InGaAs image sensors. With the global deployment of 5G infrastructure and increasing demand for high-speed data transmission, these sensors play a crucial role in monitoring and maintaining dense wavelength division multiplexing (DWDM) systems. They enable precise measurement of signal quality and help in detecting faults across optical networks. The ongoing global investment in telecommunications infrastructure, particularly in fiber optic networks, has created sustained demand for reliable imaging solutions. The telecommunications sector’s continuous evolution toward higher bandwidth requirements ensures persistent need for advanced monitoring equipment incorporating InGaAs technology.
Furthermore, the growing adoption of infrared imaging in scientific research and medical diagnostics provides additional momentum to market growth. Research institutions and healthcare facilities are increasingly utilizing InGaAs sensors for various applications ranging from spectroscopy to medical imaging, contributing to the expanding application landscape and driving technological innovations in the sector.
MARKET RESTRAINTS
High Production Costs and Complex Manufacturing Processes to Limit Market Penetration
The InGaAs image sensors market faces significant constraints due to the high costs associated with production and manufacturing complexities. Indium gallium arsenide materials require specialized fabrication processes and expensive raw materials, resulting in substantially higher production costs compared to conventional silicon-based sensors. The manufacturing involves sophisticated epitaxial growth techniques and precise processing under controlled environments, which increases both capital expenditure and operational costs. These elevated costs ultimately translate to higher product prices, making InGaAs sensors less accessible for price-sensitive applications and limiting their adoption in cost-conscious market segments.
Technical Limitations in Performance Parameters to Hinder Widespread Adoption
Despite their advantages in specific applications, InGaAs image sensors exhibit certain technical limitations that restrain market growth. These sensors typically demonstrate higher dark current and noise levels compared to some alternative technologies, which can affect image quality in certain operating conditions. The performance degradation at elevated temperatures presents challenges for applications requiring stable operation across varying environmental conditions. Additionally, the limited spectral response range, typically up to 2.6 micrometers, restricts their use in applications requiring longer wavelength detection. These technical constraints necessitate careful consideration during system design and may lead potential users to alternative solutions that better meet specific application requirements.
Supply Chain Vulnerabilities and Material Availability Concerns to Impact Market Stability
The InGaAs image sensors market encounters restraints related to supply chain vulnerabilities and availability of critical raw materials. The production of these sensors relies on indium and gallium, which are subject to price volatility and supply chain disruptions. Geographic concentration of raw material production creates dependency on specific regions for essential components, introducing potential risks to manufacturing continuity. Trade policies and international relations can further complicate material sourcing, affecting production schedules and product availability. These factors collectively contribute to market instability and may deter potential investors and manufacturers from fully committing to InGaAs technology development and expansion.
MARKET CHALLENGES
Intense Competition from Alternative Technologies to Challenge Market Position
The InGaAs image sensors market faces substantial challenges from competing technologies that offer alternative solutions for infrared imaging applications. Mercury cadmium telluride (MCT) sensors, while more expensive, provide superior performance in certain spectral ranges and applications. Meanwhile, advancements in silicon-based sensors with extended infrared capabilities continue to encroach on traditional InGaAs application areas. The development of quantum dot-based sensors and other emerging technologies presents additional competitive pressure. These alternatives often benefit from established manufacturing infrastructure and lower production costs, making them attractive options for applications where performance requirements can be met with less specialized technology.
Other Challenges
Standardization and Compatibility Issues
The lack of universal standards for InGaAs sensor interfaces and data formats creates integration challenges for system manufacturers. Compatibility issues between different manufacturers’ products can complicate system design and limit flexibility for end-users. The absence of widely adopted industry standards may slow down market growth by increasing development time and costs for integrating these sensors into broader systems.
Technological Obsolescence Risks
Rapid advancements in competing imaging technologies create constant pressure for innovation and improvement. The risk of technological obsolescence requires continuous investment in research and development to maintain competitive advantage. This dynamic environment challenges manufacturers to anticipate market trends and allocate resources effectively while managing the inherent uncertainties of technological evolution.
MARKET OPPORTUNITIES
Emerging Applications in Autonomous Vehicles and Robotics to Create New Growth Avenues
The development of autonomous vehicles and advanced robotics presents significant opportunities for InGaAs image sensors. These applications require reliable perception systems capable of operating in various lighting conditions, including complete darkness. InGaAs sensors’ ability to detect in the short-wave infrared spectrum enables better object recognition and scene analysis in challenging environments. The autonomous vehicle market is projected to experience substantial growth, creating corresponding demand for sophisticated sensing technologies. Similarly, the expanding adoption of industrial and service robots across multiple sectors provides additional opportunities for integrating advanced imaging solutions that enhance operational capabilities and safety.
Expansion in Medical and Life Sciences Applications to Drive Future Market Development
Medical diagnostics and life sciences research represent promising growth areas for InGaAs image sensors. These sensors are finding increasing application in medical imaging systems, particularly in areas such as ophthalmology, dermatology, and endoscopic procedures. Their capability to provide detailed images through biological tissues offers advantages for minimally invasive diagnostic techniques. The growing emphasis on early disease detection and personalized medicine is driving demand for advanced imaging technologies that can provide more comprehensive diagnostic information. Research institutions and medical device manufacturers are increasingly exploring InGaAs-based solutions for various applications, creating new market opportunities beyond traditional industrial and defense sectors.
Technological Innovations and Miniaturization Trends to Enable New Market Segments
Ongoing technological advancements in InGaAs sensor design and manufacturing are creating opportunities in new market segments. The development of smaller, more power-efficient sensors enables integration into portable and handheld devices, expanding applications in field inspection, environmental monitoring, and consumer products. Improvements in manufacturing processes are gradually reducing production costs, making these sensors more accessible for commercial applications. The integration of InGaAs sensors with advanced processing capabilities and artificial intelligence features presents opportunities for creating smarter imaging systems that can provide more valuable insights across various applications. These technological developments are opening new market segments and driving innovation across multiple industries.
INGAAS IMAGE SENSORS MARKET TRENDS
Advancements in SWIR Imaging Technology to Emerge as a Trend in the Market
The global InGaAs image sensors market is witnessing a significant transformation driven by technological advancements in Short-Wave Infrared (SWIR) imaging capabilities. Recent innovations have focused on enhancing pixel pitch reduction, with commercial sensors now achieving resolutions below 5 microns, enabling higher pixel densities without compromising quantum efficiency. This miniaturization trend is crucial for applications requiring compact form factors, such as drone-based surveillance and portable spectroscopy devices. Furthermore, the development of temperature-stable InGaAs sensors capable of operating efficiently up to 60°C has reduced the need for complex cooling systems, lowering both system costs and power consumption. The integration of advanced CMOS readout circuits has also improved signal-to-noise ratios by over 40% compared to previous generations, making these sensors increasingly viable for low-light scientific and industrial applications. These technological leaps are expanding the addressable market beyond traditional niches into broader commercial sectors.
Other Trends
Expansion in Defense and Surveillance Applications
The defense sector continues to be a primary growth driver for InGaAs image sensors, accounting for approximately 35% of market revenue. Modern warfare and surveillance systems increasingly rely on SWIR imaging for its ability to see through fog, smoke, and dust—conditions where visible light and thermal imaging face limitations. The United States Department of Defense has increased its procurement of SWIR-capable systems by nearly 25% in the past two years, particularly for border surveillance and unmanned aerial vehicles. This trend is further accelerated by the development of multi-spectral imaging systems that combine InGaAs sensors with other technologies for enhanced battlefield awareness. The sensors’ ability to detect laser designators and provide eye-safe imaging makes them indispensable for modern military operations, driving sustained investment in this segment.
Industrial Automation and Quality Control Integration
Industrial applications represent the fastest-growing segment for InGaAs sensors, projected to achieve a CAGR exceeding 16% through 2032. These sensors are becoming integral to automated quality control systems in manufacturing, particularly in food processing, pharmaceuticals, and electronics. Their ability to detect moisture content, chemical composition, and structural defects through spectral analysis has revolutionized production line monitoring. In the semiconductor industry, InGaAs sensors enable precise wafer inspection by detecting subsurface defects invisible to visible light imaging. The food processing sector has adopted these sensors for sorting applications, where they can identify foreign materials and assess produce quality based on internal characteristics. This industrial automation trend is driving demand for both linear and area InGaAs sensors, with manufacturers developing application-specific variants optimized for particular inspection tasks.
Optical Communication Infrastructure Expansion
The ongoing global expansion of fiber optic networks and data centers is creating substantial opportunities for InGaAs image sensors in optical communication applications. With the rollout of 5G networks and increasing demand for high-speed data transmission, these sensors are critical for monitoring signal quality in dense wavelength division multiplexing (DWDM) systems. They enable real-time analysis of multiple optical channels simultaneously, ensuring signal integrity across complex network architectures. The telecommunications sector’s investment in infrastructure modernization, particularly in Asia-Pacific regions where 5G deployment is most aggressive, is driving increased adoption of these sensing solutions. Furthermore, the sensors’ capability to operate in the 900-1700 nm range makes them ideal for testing and characterizing next-generation optical components, supporting the entire ecosystem of optical communication development.
COMPETITIVE LANDSCAPE
Key Industry Players
Technological Innovation and Strategic Expansions Drive Market Position
The global InGaAs image sensors market exhibits a semi-consolidated structure, characterized by the presence of a few dominant players and several specialized medium and small-sized companies. This dynamic is largely driven by the high technical barriers to entry, including sophisticated fabrication processes and significant R&D investments required for developing advanced near-infrared imaging solutions. The market’s competitive intensity is further amplified by the diverse application demands across defense, industrial measurement, and optical communication sectors.
Hamamatsu Photonics (Japan) stands as a preeminent force in this landscape, commanding a significant market share due to its extensive portfolio of high-performance linear and area InGaAs sensors. The company’s dominance is underpinned by its vertically integrated manufacturing capabilities and longstanding expertise in photonics, which allows for consistent product quality and innovation. Their recent developments in SWIR (Short-Wave Infrared) cameras with enhanced sensitivity have solidified their position, particularly in scientific and industrial applications.
Similarly, Teledyne DALSA (Canada/US) and FLIR Systems (US, now part of Teledyne Technologies) are pivotal players, leveraging their stronghold in the defense and surveillance sector. Teledyne’s acquisition of FLIR created a behemoth with a comprehensive suite of imaging technologies, enabling cross-platform integration and offering bundled solutions to key clients in aerospace and government contracts. Their market strength is evidenced by their substantial collective revenue share, which is among the highest in the industry.
Meanwhile, European players like Xenics (Belgium) are carving out significant niches through specialization. Xenics has focused on developing customized InGaAs solutions for machine vision and spectroscopy, allowing them to secure loyal customer bases in specific industrial and research segments. Their growth strategy emphasizes close collaboration with end-users to develop application-specific products, a approach that mitigates competition from larger, more generalized manufacturers.
The competitive strategies observed across the board involve aggressive investment in research to push the boundaries of sensor resolution, frame rate, and quantum efficiency. Furthermore, companies are actively pursuing strategic partnerships and acquisitions to expand their geographical footprint and gain access to emerging markets, particularly in Asia-Pacific, which is experiencing rapid growth in industrial automation and telecommunications infrastructure.
List of Key InGaAs Image Sensor Companies Profiled
- Hamamatsu Photonics K.K. (Japan)
- Teledyne DALSA (Canada) [Part of Teledyne Technologies]
- FLIR Systems, Inc. (U.S.) [Part of Teledyne Technologies]
- Xenics NV (Belgium)
- Sensor Unlimited Inc. (U.S.) [Part of Collins Aerospace]
- New Imaging Technologies (France)
- SYNERGY OPTOSYSTEMS CO., LTD. (Japan)
Segment Analysis:
By Type
InGaAs Linear Image Sensors Segment Dominates the Market Due to High Demand in Industrial and Scientific Scanning Applications
The market is segmented based on type into:
- InGaAs Linear Image Sensors
- InGaAs Area Image Sensors
By Application
Defense and Surveillance Segment Leads Due to Critical Use in Night Vision and Target Identification Systems
The market is segmented based on application into:
- Physics and Chemistry Measurement
- Industrial Measurement
- Defense and Surveillance
- Optical Communication
- Others
By End User
Industrial Sector Represents a Major End User Segment Driven by Quality Control and Process Monitoring Needs
The market is segmented based on end user into:
- Industrial
- Military and Defense
- Scientific Research
- Telecommunications
Regional Analysis: InGaAs Image Sensors Market
North America
North America, led by the United States, is the largest market for InGaAs image sensors, holding approximately 30% of the global share. This dominance is driven by substantial investments in defense and surveillance technologies, where these sensors are critical for night vision, targeting systems, and border security applications. The region’s strong industrial automation sector also utilizes these sensors for precision non-contact measurement and quality control. Furthermore, a robust optical communication infrastructure, supporting high-speed data transmission, fuels demand. The presence of key manufacturers and leading research institutions fosters continuous innovation, keeping the region at the forefront of developing advanced sensor technologies with higher resolutions and improved sensitivity.
Europe
Europe represents a significant and mature market, accounting for roughly 25% of global demand. The market is characterized by stringent regulatory standards and a strong emphasis on high-quality, reliable components for industrial and scientific applications. Countries like Germany, France, and the U.K. have a strong manufacturing base that leverages InGaAs sensors for machine vision and automated inspection systems in automotive and pharmaceutical industries. Additionally, significant research in physics and chemistry at European universities and institutions drives the need for precise spectroscopic tools. The market is highly competitive, with a focus on developing sensors that meet rigorous performance and environmental specifications, pushing manufacturers toward greater innovation.
Asia-Pacific
The Asia-Pacific region is the fastest-growing market for InGaAs image sensors, propelled by massive industrial expansion and technological adoption. China, in particular, is a major consumer and producer, driven by its extensive manufacturing sector and government initiatives in defense modernization and smart infrastructure. Japan and South Korea contribute significantly with their advanced electronics and telecommunications industries, where these sensors are essential for fiber optic communication systems. While cost sensitivity can be a factor, there is a clear and accelerating trend toward adopting higher-end sensing solutions to improve product quality and operational efficiency across various industries, from electronics to automotive manufacturing.
South America
The InGaAs image sensors market in South America is currently in a developing phase. Growth is primarily fueled by gradual industrialization and investments in mining and agricultural technology, where these sensors can be used for material analysis and monitoring. However, the market’s expansion is tempered by economic fluctuations and limited local manufacturing capabilities, which often lead to a reliance on imported components. While awareness of the technology’s benefits is growing, especially in larger economies like Brazil and Argentina, widespread adoption is slower compared to other regions due to budget constraints and a less mature technological infrastructure for advanced applications.
Middle East & Africa
This region presents an emerging opportunity for the InGaAs image sensors market. Growth is primarily linked to investments in security and defense across several nations, as well as developments in the oil and gas sector for pipeline monitoring and exploration activities. However, the market is still in its early stages. Progress is often hindered by complex regulatory environments and a lack of localized technical expertise and support infrastructure. Despite these challenges, the long-term potential is recognized, with increasing urbanization and infrastructure projects expected to gradually drive demand for more sophisticated sensing and monitoring solutions in the future.
Report Scope
This market research report provides a comprehensive analysis of the global and regional InGaAs Image Sensors markets, covering the forecast period 2025–2032. It offers detailed insights into market dynamics, technological advancements, competitive landscape, and key trends shaping the industry.
Key focus areas of the report include:
- Market Size & Forecast: Historical data and future projections for revenue, unit shipments, and market value across major regions and segments.
- Segmentation Analysis: Detailed breakdown by product type, technology, application, and end-user industry to identify high-growth segments and investment opportunities.
- Regional Outlook: Insights into market performance across North America, Europe, Asia-Pacific, Latin America, and the Middle East & Africa, including country-level analysis where relevant.
- Competitive Landscape: Profiles of leading market participants, including their product offerings, R&D focus, manufacturing capacity, pricing strategies, and recent developments such as mergers, acquisitions, and partnerships.
- Technology Trends & Innovation: Assessment of emerging technologies, integration of AI/IoT, semiconductor design trends, fabrication techniques, and evolving industry standards.
- Market Drivers & Restraints: Evaluation of factors driving market growth along with challenges, supply chain constraints, regulatory issues, and market-entry barriers.
- Stakeholder Analysis: Insights for component suppliers, OEMs, system integrators, investors, and policymakers regarding the evolving ecosystem and strategic opportunities.
Primary and secondary research methods are employed, including interviews with industry experts, data from verified sources, and real-time market intelligence to ensure the accuracy and reliability of the insights presented.
FREQUENTLY ASKED QUESTIONS:
What is the current market size of Global InGaAs Image Sensors Market?
-> InGaAs Image Sensors Market was valued at 1234 million in 2024 and is projected to reach US$ 2921 million by 2032, at a CAGR of 13.4% during the forecast period.
Which key companies operate in Global InGaAs Image Sensors Market?
-> Key players include Hamamatsu Photonics, Teledyne DALSA, Xenics, FLIR Systems, and Sensor Unlimited, among others.
What are the key growth drivers?
-> Key growth drivers include increasing demand for night vision systems, expansion of optical communication networks, and advancements in industrial automation.
Which region dominates the market?
-> North America is the largest market with approximately 30% share, followed by Europe with about 25% market share.
What are the emerging trends?
-> Emerging trends include miniaturization of sensors, integration with AI for enhanced image processing, and development of higher resolution InGaAs sensors.

Get Sample Report PDF for Exclusive Insights
Report Sample Includes
- Table of Contents
- List of Tables & Figures
- Charts, Research Methodology, and more...


