InGaAs Area Sensors Market Trends, Business Strategies 2025-2032

Global InGaAs Area Sensors market size was estimated at USD 90 million in 2023 and is projected to reach USD 192.27 million by 2032, exhibiting a CAGR of 8.80% during the forecast period.

PDF Icon Download Sample Report PDF
  • Quick Dispatch

    All Orders

  • Secure Payment

    100% Secure Payment

Compare

$1,500.00$4,250.00

Clear

InGaAs Area Sensors Market Overview

InGaAs area image sensors are two-dimensional image sensors that have a hybrid structure consisting of a CMOS readout circuit (ROIC: readout integrated circuit) and back-illuminated InGaAs photodiodes for near infrared (NIR) and short wavelength infrared (SWIR) regions.

This report provides a deep insight into the global InGaAs Area Sensors market covering all its essential aspects. This ranges from a macro overview of the market to micro details of the market size, competitive landscape, development trend, niche market, key market drivers and challenges, SWOT analysis, value chain analysis, etc.

The analysis helps the reader to shape the competition within the industries and strategies for the competitive environment to enhance the potential profit. Furthermore, it provides a simple framework for evaluating and accessing the position of the business organization. The report structure also focuses on the competitive landscape of the Global InGaAs Area Sensors Market, this report introduces in detail the market share, market performance, product situation, operation situation, etc. of the main players, which helps the readers in the industry to identify the main competitors and deeply understand the competition pattern of the market.
In a word, this report is a must-read for industry players, investors, researchers, consultants, business strategists, and all those who have any kind of stake or are planning to foray into the InGaAs Area Sensors market in any manner.

InGaAs Area Sensors Market Analysis:

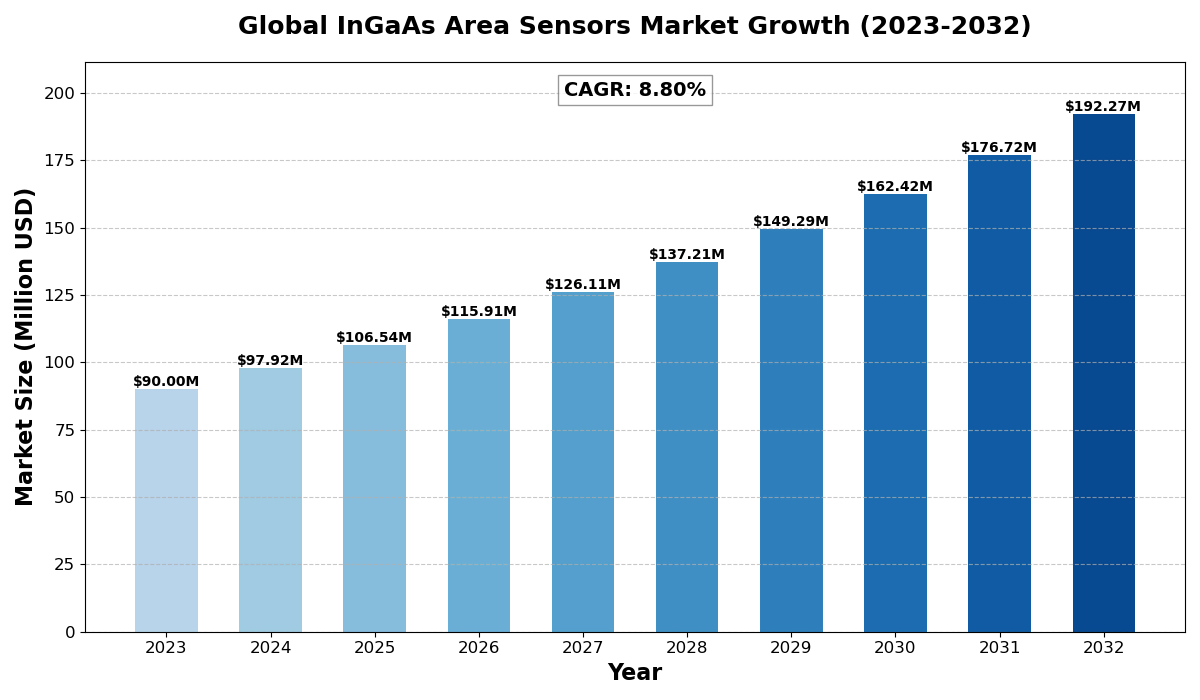
The global InGaAs Area Sensors market size was estimated at USD 90 million in 2023 and is projected to reach USD 192.27 million by 2032, exhibiting a CAGR of 8.80% during the forecast period.

North America InGaAs Area Sensors market size was estimated at USD 27.12 million in 2023, at a CAGR of 7.54% during the forecast period of 2025 through 2032.

InGaAs Area Sensors Key Market Trends  :

  1. Increasing Demand in Military and Defense Applications: InGaAs area sensors are becoming crucial in military and defense applications, particularly for surveillance, reconnaissance, and targeting systems. Their ability to operate in the near-infrared (NIR) and short-wavelength infrared (SWIR) ranges makes them ideal for detecting objects in low-light and harsh environments.

  2. Integration with Surveillance Systems: With growing security concerns globally, there is an increasing adoption of InGaAs area sensors in surveillance systems. Their enhanced sensitivity and resolution in NIR/SWIR regions enable more accurate and clearer imaging in challenging conditions, such as night-time or foggy environments.

  3. Advancements in Sensor Resolution and Image Quality: The market is witnessing technological advancements in sensor resolution, such as 640×512 and 1280×1024 pixel formats, leading to improved image quality. Higher resolution sensors allow for better detail and accuracy, especially in industrial and military applications, where precision is critical.

  4. Wider Adoption in Industrial Applications: InGaAs area sensors are being increasingly used in industrial applications for quality control, machine vision, and process monitoring. Their ability to detect hidden defects or variations in materials makes them valuable in sectors like manufacturing, automotive, and electronics.

  5. Growth in NIR and SWIR Applications: The demand for InGaAs area sensors is growing due to their unique ability to capture both NIR and SWIR light, enabling applications such as gas detection, chemical analysis, and environmental monitoring. As industries move towards more precise and non-invasive technologies, these sensors offer significant advantages.

InGaAs Area Sensors Market Regional Analysis :

semi insight

  • North America:Strong demand driven by EVs, 5G infrastructure, and renewable energy, with the U.S. leading the market.
  • Europe:Growth fueled by automotive electrification, renewable energy, and strong regulatory support, with Germany as a key player.
  • Asia-Pacific:Dominates the market due to large-scale manufacturing in China and Japan, with growing demand from EVs, 5G, and semiconductors.
  • South America:Emerging market, driven by renewable energy and EV adoption, with Brazil leading growth.
  • Middle East & Africa:Gradual growth, mainly due to investments in renewable energy and EV infrastructure, with Saudi Arabia and UAE as key contributors.

InGaAs Area Sensors Market Segmentation :

The research report includes specific segments by region (country), manufacturers, Type, and Application. Market segmentation creates subsets of a market based on product type, end-user or application, Geographic, and other factors. By understanding the market segments, the decision-maker can leverage this targeting in the product, sales, and marketing strategies. Market segments can power your product development cycles by informing how you create product offerings for different segments.

Key Company

  • Hamamatsu
  • SCD
  • Lynred
  • I3system
  • CETC (NO.44 Institute)
  • NORINCO GROUP (Kunming Institute of Physics)
  • Jiwu Optoelectronic
  • Sony
  • GHOPTO
  • ZKDX
  • XenICs
  • Xi’an Leading Optoelectronic Technology

Market Segmentation (by Type)

  • 320×256
  • 640×512
  • 1280×1026
  • Others

Market Segmentation (by Application)

  • Military
  • Surveillance
  • Induatrial
  • Others

Drivers

  • Rising Military and Defense Needs: The ongoing need for advanced surveillance, reconnaissance, and targeting technologies in the military and defense sectors is one of the primary drivers for the growth of InGaAs area sensors. Their ability to capture clear images in challenging conditions, such as low-light and high-temperatures, is making them increasingly indispensable.

  • Growing Security Concerns: The rising demand for surveillance equipment, especially in urban areas, airports, and borders, is driving the need for InGaAs sensors. Their use in high-end security systems ensures better monitoring, particularly under difficult lighting conditions, such as during night-time or in foggy environments.

  • Technological Improvements: Technological advancements that improve the sensitivity, resolution, and image quality of InGaAs area sensors are encouraging their adoption in various applications. These sensors’ ability to work effectively in SWIR and NIR regions enables the development of more accurate and high-performance solutions.


Restraints

  • High Cost of Production: The high production cost of InGaAs area sensors can limit their widespread adoption, particularly in cost-sensitive applications. Their advanced materials and complex manufacturing processes contribute to higher prices, making them less accessible for smaller companies and low-budget projects.

  • Limited Awareness in Non-Specialized Markets: Many industries and regions may not be fully aware of the advantages that InGaAs area sensors can offer over traditional imaging technologies. This lack of awareness and education in non-specialized markets could slow down their adoption in general consumer and industrial sectors.

  • Competition from Other Imaging Technologies: InGaAs area sensors face competition from other infrared and imaging technologies, such as traditional CMOS sensors and thermal sensors. These alternative options can sometimes offer similar performance at a lower price, posing a challenge for the InGaAs sensor market.


Opportunities

  • Expansion into New Industrial Applications: As industries continue to adopt more advanced technologies for quality control and defect detection, InGaAs area sensors offer significant opportunities. Their application in machine vision and process monitoring is set to expand, particularly in industries like automotive, electronics, and pharmaceuticals.

  • Increased Demand for High-Resolution Sensors: The demand for higher-resolution sensors is driving opportunities for InGaAs area sensor manufacturers. With advancements in pixel count (e.g., 1280×1026), these sensors can deliver more detailed and accurate images, making them suitable for more precise applications in military, surveillance, and industrial sectors.

  • Growth in Environmental and Chemical Sensing: InGaAs sensors are increasingly used in environmental and chemical sensing applications due to their ability to detect gases and chemicals in the SWIR region. As environmental regulations become stricter, there is a growing demand for more efficient and accurate gas detection solutions, presenting opportunities for the InGaAs market.


Challenges

  • Expensive Manufacturing Process: The manufacturing of InGaAs area sensors is complex and costly, which can affect their pricing and limit their competitiveness in comparison to other imaging technologies. This remains a significant challenge, particularly for price-sensitive industries.

  • Complex Integration Requirements: Integrating InGaAs area sensors into existing systems, especially in industrial and military applications, can be challenging. The need for specialized equipment and expertise in sensor calibration and integration may pose barriers to widespread adoption.

  • Environmental and Performance Limitations: Although InGaAs area sensors are designed for use in harsh conditions, extreme temperatures or environmental factors may still affect their performance. Ensuring their durability and reliability in all settings remains a challenge for manufacturers.

Key Benefits of This Market Research:

  • Industry drivers, restraints, and opportunities covered in the study
  • Neutral perspective on the market performance
  • Recent industry trends and developments
  • Competitive landscape & strategies of key players
  • Potential & niche segments and regions exhibiting promising growth covered
  • Historical, current, and projected market size, in terms of value
  • In-depth analysis of the InGaAs Area Sensors Market
  • Overview of the regional outlook of the InGaAs Area Sensors Market:

Key Reasons to Buy this Report:

  • Access to date statistics compiled by our researchers. These provide you with historical and forecast data, which is analyzed to tell you why your market is set to change
  • This enables you to anticipate market changes to remain ahead of your competitors
  • You will be able to copy data from the Excel spreadsheet straight into your marketing plans, business presentations, or other strategic documents
  • The concise analysis, clear graph, and table format will enable you to pinpoint the information you require quickly
  • Provision of market value data for each segment and sub-segment
  • Indicates the region and segment that is expected to witness the fastest growth as well as to dominate the market
  • Includes in-depth analysis of the market from various perspectives through Porters five forces analysis
  • Provides insight into the market through Value Chain
  • Market dynamics scenario, along with growth opportunities of the market in the years to come
  • 6-month post-sales analyst support

Customization of the Report
In case of any queries or customization requirements, please connect with our sales team, who will ensure that your requirements are met.

FAQs

Q1: What are the key driving factors and opportunities in the InGaAs area sensors market?

A1:Key driving factors include the rising demand in military, defense, and surveillance applications, technological improvements in sensor performance, and the growing need for high-resolution sensors in industrial applications. Opportunities lie in the expansion into new industrial sectors and environmental sensing technologies.


Q2: Which region is projected to have the largest market share in the InGaAs area sensors market?

A2:North America is expected to have a significant market share, with an estimated market size of USD 27.12 million in 2023. The region is projected to grow at a CAGR of 7.54% during the forecast period due to increasing demand in military and industrial sectors.


Q3: Who are the top players in the global InGaAs area sensors market?

A3:Top players in the InGaAs area sensors market include Hamamatsu, SCD, Lynred, I3system, CETC (NO.44 Institute), NORINCO GROUP (Kunming Institute of Physics), Jiwu Optoelectronic, Sony, GHOPTO, ZKDX, XenICs, and Xi’an Leading Optoelectronic Technology.


Q4: What are the latest technological advancements in the InGaAs area sensor industry?

A4:Recent advancements include improvements in resolution, such as 640×512 and 1280×1024 pixel formats, enhancing image quality. Additionally, better sensitivity and faster response times are driving adoption in high-performance applications such as military surveillance and industrial defect detection.


Q5: What is the current size of the global InGaAs area sensors market?

A5:The global InGaAs area sensors market was valued at USD 90 million in 2023 and is projected to reach USD 192.27 million by 2032, growing at a CAGR of 8.80% during the forecast period.

InGaAs Area Sensors Market Trends, Business Strategies 2025-2032

Get Sample Report PDF for Exclusive Insights

Report Sample Includes

  • Table of Contents
  • List of Tables & Figures
  • Charts, Research Methodology, and more...
PDF Icon Download Sample Report PDF

Download Sample Report

Table of Content

Table of Contents
1 Research Methodology and Statistical Scope
1.1 Market Definition and Statistical Scope of InGaAs Area Sensors
1.2 Key Market Segments
1.2.1 InGaAs Area Sensors Segment by Type
1.2.2 InGaAs Area Sensors Segment by Application
1.3 Methodology & Sources of Information
1.3.1 Research Methodology
1.3.2 Research Process
1.3.3 Market Breakdown and Data Triangulation
1.3.4 Base Year
1.3.5 Report Assumptions & Caveats
2 InGaAs Area Sensors Market Overview
2.1 Global Market Overview
2.1.1 Global InGaAs Area Sensors Market Size (M USD) Estimates and Forecasts (2019-2032)
2.1.2 Global InGaAs Area Sensors Sales Estimates and Forecasts (2019-2032)
2.2 Market Segment Executive Summary
2.3 Global Market Size by Region
3 InGaAs Area Sensors Market Competitive Landscape
3.1 Global InGaAs Area Sensors Sales by Manufacturers (2019-2025)
3.2 Global InGaAs Area Sensors Revenue Market Share by Manufacturers (2019-2025)
3.3 InGaAs Area Sensors Market Share by Company Type (Tier 1, Tier 2, and Tier 3)
3.4 Global InGaAs Area Sensors Average Price by Manufacturers (2019-2025)
3.5 Manufacturers InGaAs Area Sensors Sales Sites, Area Served, Product Type
3.6 InGaAs Area Sensors Market Competitive Situation and Trends
3.6.1 InGaAs Area Sensors Market Concentration Rate
3.6.2 Global 5 and 10 Largest InGaAs Area Sensors Players Market Share by Revenue
3.6.3 Mergers & Acquisitions, Expansion
4 InGaAs Area Sensors Industry Chain Analysis
4.1 InGaAs Area Sensors Industry Chain Analysis
4.2 Market Overview of Key Raw Materials
4.3 Midstream Market Analysis
4.4 Downstream Customer Analysis
5 The Development and Dynamics of InGaAs Area Sensors Market
5.1 Key Development Trends
5.2 Driving Factors
5.3 Market Challenges
5.4 Market Restraints
5.5 Industry News
5.5.1 New Product Developments
5.5.2 Mergers & Acquisitions
5.5.3 Expansions
5.5.4 Collaboration/Supply Contracts
5.6 Industry Policies
6 InGaAs Area Sensors Market Segmentation by Type
6.1 Evaluation Matrix of Segment Market Development Potential (Type)
6.2 Global InGaAs Area Sensors Sales Market Share by Type (2019-2025)
6.3 Global InGaAs Area Sensors Market Size Market Share by Type (2019-2025)
6.4 Global InGaAs Area Sensors Price by Type (2019-2025)
7 InGaAs Area Sensors Market Segmentation by Application
7.1 Evaluation Matrix of Segment Market Development Potential (Application)
7.2 Global InGaAs Area Sensors Market Sales by Application (2019-2025)
7.3 Global InGaAs Area Sensors Market Size (M USD) by Application (2019-2025)
7.4 Global InGaAs Area Sensors Sales Growth Rate by Application (2019-2025)
8 InGaAs Area Sensors Market Consumption by Region
8.1 Global InGaAs Area Sensors Sales by Region
8.1.1 Global InGaAs Area Sensors Sales by Region
8.1.2 Global InGaAs Area Sensors Sales Market Share by Region
8.2 North America
8.2.1 North America InGaAs Area Sensors Sales by Country
8.2.2 U.S.
8.2.3 Canada
8.2.4 Mexico
8.3 Europe
8.3.1 Europe InGaAs Area Sensors Sales by Country
8.3.2 Germany
8.3.3 France
8.3.4 U.K.
8.3.5 Italy
8.3.6 Russia
8.4 Asia Pacific
8.4.1 Asia Pacific InGaAs Area Sensors Sales by Region
8.4.2 China
8.4.3 Japan
8.4.4 South Korea
8.4.5 India
8.4.6 Southeast Asia
8.5 South America
8.5.1 South America InGaAs Area Sensors Sales by Country
8.5.2 Brazil
8.5.3 Argentina
8.5.4 Columbia
8.6 Middle East and Africa
8.6.1 Middle East and Africa InGaAs Area Sensors Sales by Region
8.6.2 Saudi Arabia
8.6.3 UAE
8.6.4 Egypt
8.6.5 Nigeria
8.6.6 South Africa
9 InGaAs Area Sensors Market Production by Region
9.1 Global Production of InGaAs Area Sensors by Region (2019-2025)
9.2 Global InGaAs Area Sensors Revenue Market Share by Region (2019-2025)
9.3 Global InGaAs Area Sensors Production, Revenue, Price and Gross Margin (2019-2025)
9.4 North America InGaAs Area Sensors Production
9.4.1 North America InGaAs Area Sensors Production Growth Rate (2019-2025)
9.4.2 North America InGaAs Area Sensors Production, Revenue, Price and Gross Margin (2019-2025)
9.5 Europe InGaAs Area Sensors Production
9.5.1 Europe InGaAs Area Sensors Production Growth Rate (2019-2025)
9.5.2 Europe InGaAs Area Sensors Production, Revenue, Price and Gross Margin (2019-2025)
9.6 Japan InGaAs Area Sensors Production (2019-2025)
9.6.1 Japan InGaAs Area Sensors Production Growth Rate (2019-2025)
9.6.2 Japan InGaAs Area Sensors Production, Revenue, Price and Gross Margin (2019-2025)
9.7 China InGaAs Area Sensors Production (2019-2025)
9.7.1 China InGaAs Area Sensors Production Growth Rate (2019-2025)
9.7.2 China InGaAs Area Sensors Production, Revenue, Price and Gross Margin (2019-2025)
10 Key Companies Profile
10.1 Hamamatsu
10.1.1 Hamamatsu InGaAs Area Sensors Basic Information
10.1.2 Hamamatsu InGaAs Area Sensors Product Overview
10.1.3 Hamamatsu InGaAs Area Sensors Product Market Performance
10.1.4 Hamamatsu Business Overview
10.1.5 Hamamatsu InGaAs Area Sensors SWOT Analysis
10.1.6 Hamamatsu Recent Developments
10.2 SCD
10.2.1 SCD InGaAs Area Sensors Basic Information
10.2.2 SCD InGaAs Area Sensors Product Overview
10.2.3 SCD InGaAs Area Sensors Product Market Performance
10.2.4 SCD Business Overview
10.2.5 SCD InGaAs Area Sensors SWOT Analysis
10.2.6 SCD Recent Developments
10.3 Lynred
10.3.1 Lynred InGaAs Area Sensors Basic Information
10.3.2 Lynred InGaAs Area Sensors Product Overview
10.3.3 Lynred InGaAs Area Sensors Product Market Performance
10.3.4 Lynred InGaAs Area Sensors SWOT Analysis
10.3.5 Lynred Business Overview
10.3.6 Lynred Recent Developments
10.4 I3system
10.4.1 I3system InGaAs Area Sensors Basic Information
10.4.2 I3system InGaAs Area Sensors Product Overview
10.4.3 I3system InGaAs Area Sensors Product Market Performance
10.4.4 I3system Business Overview
10.4.5 I3system Recent Developments
10.5 CETC (NO.44 Institute)
10.5.1 CETC (NO.44 Institute) InGaAs Area Sensors Basic Information
10.5.2 CETC (NO.44 Institute) InGaAs Area Sensors Product Overview
10.5.3 CETC (NO.44 Institute) InGaAs Area Sensors Product Market Performance
10.5.4 CETC (NO.44 Institute) Business Overview
10.5.5 CETC (NO.44 Institute) Recent Developments
10.6 NORINCO GROUP (Kunming Institute of Physics)
10.6.1 NORINCO GROUP (Kunming Institute of Physics) InGaAs Area Sensors Basic Information
10.6.2 NORINCO GROUP (Kunming Institute of Physics) InGaAs Area Sensors Product Overview
10.6.3 NORINCO GROUP (Kunming Institute of Physics) InGaAs Area Sensors Product Market Performance
10.6.4 NORINCO GROUP (Kunming Institute of Physics) Business Overview
10.6.5 NORINCO GROUP (Kunming Institute of Physics) Recent Developments
10.7 Jiwu Optoelectronic
10.7.1 Jiwu Optoelectronic InGaAs Area Sensors Basic Information
10.7.2 Jiwu Optoelectronic InGaAs Area Sensors Product Overview
10.7.3 Jiwu Optoelectronic InGaAs Area Sensors Product Market Performance
10.7.4 Jiwu Optoelectronic Business Overview
10.7.5 Jiwu Optoelectronic Recent Developments
10.8 Sony
10.8.1 Sony InGaAs Area Sensors Basic Information
10.8.2 Sony InGaAs Area Sensors Product Overview
10.8.3 Sony InGaAs Area Sensors Product Market Performance
10.8.4 Sony Business Overview
10.8.5 Sony Recent Developments
10.9 GHOPTO
10.9.1 GHOPTO InGaAs Area Sensors Basic Information
10.9.2 GHOPTO InGaAs Area Sensors Product Overview
10.9.3 GHOPTO InGaAs Area Sensors Product Market Performance
10.9.4 GHOPTO Business Overview
10.9.5 GHOPTO Recent Developments
10.10 ZKDX
10.10.1 ZKDX InGaAs Area Sensors Basic Information
10.10.2 ZKDX InGaAs Area Sensors Product Overview
10.10.3 ZKDX InGaAs Area Sensors Product Market Performance
10.10.4 ZKDX Business Overview
10.10.5 ZKDX Recent Developments
10.11 XenICs
10.11.1 XenICs InGaAs Area Sensors Basic Information
10.11.2 XenICs InGaAs Area Sensors Product Overview
10.11.3 XenICs InGaAs Area Sensors Product Market Performance
10.11.4 XenICs Business Overview
10.11.5 XenICs Recent Developments
10.12 Xi’an Leading Optoelectronic Technology
10.12.1 Xi’an Leading Optoelectronic Technology InGaAs Area Sensors Basic Information
10.12.2 Xi’an Leading Optoelectronic Technology InGaAs Area Sensors Product Overview
10.12.3 Xi’an Leading Optoelectronic Technology InGaAs Area Sensors Product Market Performance
10.12.4 Xi’an Leading Optoelectronic Technology Business Overview
10.12.5 Xi’an Leading Optoelectronic Technology Recent Developments
11 InGaAs Area Sensors Market Forecast by Region
11.1 Global InGaAs Area Sensors Market Size Forecast
11.2 Global InGaAs Area Sensors Market Forecast by Region
11.2.1 North America Market Size Forecast by Country
11.2.2 Europe InGaAs Area Sensors Market Size Forecast by Country
11.2.3 Asia Pacific InGaAs Area Sensors Market Size Forecast by Region
11.2.4 South America InGaAs Area Sensors Market Size Forecast by Country
11.2.5 Middle East and Africa Forecasted Consumption of InGaAs Area Sensors by Country
12 Forecast Market by Type and by Application (2025-2032)
12.1 Global InGaAs Area Sensors Market Forecast by Type (2025-2032)
12.1.1 Global Forecasted Sales of InGaAs Area Sensors by Type (2025-2032)
12.1.2 Global InGaAs Area Sensors Market Size Forecast by Type (2025-2032)
12.1.3 Global Forecasted Price of InGaAs Area Sensors by Type (2025-2032)
12.2 Global InGaAs Area Sensors Market Forecast by Application (2025-2032)
12.2.1 Global InGaAs Area Sensors Sales (K Units) Forecast by Application
12.2.2 Global InGaAs Area Sensors Market Size (M USD) Forecast by Application (2025-2032)
13 Conclusion and Key FindingsList of Tables
Table 1. Introduction of the Type
Table 2. Introduction of the Application
Table 3. Market Size (M USD) Segment Executive Summary
Table 4. InGaAs Area Sensors Market Size Comparison by Region (M USD)
Table 5. Global InGaAs Area Sensors Sales (K Units) by Manufacturers (2019-2025)
Table 6. Global InGaAs Area Sensors Sales Market Share by Manufacturers (2019-2025)
Table 7. Global InGaAs Area Sensors Revenue (M USD) by Manufacturers (2019-2025)
Table 8. Global InGaAs Area Sensors Revenue Share by Manufacturers (2019-2025)
Table 9. Company Type (Tier 1, Tier 2, and Tier 3) & (based on the Revenue in InGaAs Area Sensors as of 2022)
Table 10. Global Market InGaAs Area Sensors Average Price (USD/Unit) of Key Manufacturers (2019-2025)
Table 11. Manufacturers InGaAs Area Sensors Sales Sites and Area Served
Table 12. Manufacturers InGaAs Area Sensors Product Type
Table 13. Global InGaAs Area Sensors Manufacturers Market Concentration Ratio (CR5 and HHI)
Table 14. Mergers & Acquisitions, Expansion Plans
Table 15. Industry Chain Map of InGaAs Area Sensors
Table 16. Market Overview of Key Raw Materials
Table 17. Midstream Market Analysis
Table 18. Downstream Customer Analysis
Table 19. Key Development Trends
Table 20. Driving Factors
Table 21. InGaAs Area Sensors Market Challenges
Table 22. Global InGaAs Area Sensors Sales by Type (K Units)
Table 23. Global InGaAs Area Sensors Market Size by Type (M USD)
Table 24. Global InGaAs Area Sensors Sales (K Units) by Type (2019-2025)
Table 25. Global InGaAs Area Sensors Sales Market Share by Type (2019-2025)
Table 26. Global InGaAs Area Sensors Market Size (M USD) by Type (2019-2025)
Table 27. Global InGaAs Area Sensors Market Size Share by Type (2019-2025)
Table 28. Global InGaAs Area Sensors Price (USD/Unit) by Type (2019-2025)
Table 29. Global InGaAs Area Sensors Sales (K Units) by Application
Table 30. Global InGaAs Area Sensors Market Size by Application
Table 31. Global InGaAs Area Sensors Sales by Application (2019-2025) & (K Units)
Table 32. Global InGaAs Area Sensors Sales Market Share by Application (2019-2025)
Table 33. Global InGaAs Area Sensors Sales by Application (2019-2025) & (M USD)
Table 34. Global InGaAs Area Sensors Market Share by Application (2019-2025)
Table 35. Global InGaAs Area Sensors Sales Growth Rate by Application (2019-2025)
Table 36. Global InGaAs Area Sensors Sales by Region (2019-2025) & (K Units)
Table 37. Global InGaAs Area Sensors Sales Market Share by Region (2019-2025)
Table 38. North America InGaAs Area Sensors Sales by Country (2019-2025) & (K Units)
Table 39. Europe InGaAs Area Sensors Sales by Country (2019-2025) & (K Units)
Table 40. Asia Pacific InGaAs Area Sensors Sales by Region (2019-2025) & (K Units)
Table 41. South America InGaAs Area Sensors Sales by Country (2019-2025) & (K Units)
Table 42. Middle East and Africa InGaAs Area Sensors Sales by Region (2019-2025) & (K Units)
Table 43. Global InGaAs Area Sensors Production (K Units) by Region (2019-2025)
Table 44. Global InGaAs Area Sensors Revenue (US$ Million) by Region (2019-2025)
Table 45. Global InGaAs Area Sensors Revenue Market Share by Region (2019-2025)
Table 46. Global InGaAs Area Sensors Production (K Units), Revenue (US$ Million), Price (USD/Unit) and Gross Margin (2019-2025)
Table 47. North America InGaAs Area Sensors Production (K Units), Revenue (US$ Million), Price (USD/Unit) and Gross Margin (2019-2025)
Table 48. Europe InGaAs Area Sensors Production (K Units), Revenue (US$ Million), Price (USD/Unit) and Gross Margin (2019-2025)
Table 49. Japan InGaAs Area Sensors Production (K Units), Revenue (US$ Million), Price (USD/Unit) and Gross Margin (2019-2025)
Table 50. China InGaAs Area Sensors Production (K Units), Revenue (US$ Million), Price (USD/Unit) and Gross Margin (2019-2025)
Table 51. Hamamatsu InGaAs Area Sensors Basic Information
Table 52. Hamamatsu InGaAs Area Sensors Product Overview
Table 53. Hamamatsu InGaAs Area Sensors Sales (K Units), Revenue (M USD), Price (USD/Unit) and Gross Margin (2019-2025)
Table 54. Hamamatsu Business Overview
Table 55. Hamamatsu InGaAs Area Sensors SWOT Analysis
Table 56. Hamamatsu Recent Developments
Table 57. SCD InGaAs Area Sensors Basic Information
Table 58. SCD InGaAs Area Sensors Product Overview
Table 59. SCD InGaAs Area Sensors Sales (K Units), Revenue (M USD), Price (USD/Unit) and Gross Margin (2019-2025)
Table 60. SCD Business Overview
Table 61. SCD InGaAs Area Sensors SWOT Analysis
Table 62. SCD Recent Developments
Table 63. Lynred InGaAs Area Sensors Basic Information
Table 64. Lynred InGaAs Area Sensors Product Overview
Table 65. Lynred InGaAs Area Sensors Sales (K Units), Revenue (M USD), Price (USD/Unit) and Gross Margin (2019-2025)
Table 66. Lynred InGaAs Area Sensors SWOT Analysis
Table 67. Lynred Business Overview
Table 68. Lynred Recent Developments
Table 69. I3system InGaAs Area Sensors Basic Information
Table 70. I3system InGaAs Area Sensors Product Overview
Table 71. I3system InGaAs Area Sensors Sales (K Units), Revenue (M USD), Price (USD/Unit) and Gross Margin (2019-2025)
Table 72. I3system Business Overview
Table 73. I3system Recent Developments
Table 74. CETC (NO.44 Institute) InGaAs Area Sensors Basic Information
Table 75. CETC (NO.44 Institute) InGaAs Area Sensors Product Overview
Table 76. CETC (NO.44 Institute) InGaAs Area Sensors Sales (K Units), Revenue (M USD), Price (USD/Unit) and Gross Margin (2019-2025)
Table 77. CETC (NO.44 Institute) Business Overview
Table 78. CETC (NO.44 Institute) Recent Developments
Table 79. NORINCO GROUP (Kunming Institute of Physics) InGaAs Area Sensors Basic Information
Table 80. NORINCO GROUP (Kunming Institute of Physics) InGaAs Area Sensors Product Overview
Table 81. NORINCO GROUP (Kunming Institute of Physics) InGaAs Area Sensors Sales (K Units), Revenue (M USD), Price (USD/Unit) and Gross Margin (2019-2025)
Table 82. NORINCO GROUP (Kunming Institute of Physics) Business Overview
Table 83. NORINCO GROUP (Kunming Institute of Physics) Recent Developments
Table 84. Jiwu Optoelectronic InGaAs Area Sensors Basic Information
Table 85. Jiwu Optoelectronic InGaAs Area Sensors Product Overview
Table 86. Jiwu Optoelectronic InGaAs Area Sensors Sales (K Units), Revenue (M USD), Price (USD/Unit) and Gross Margin (2019-2025)
Table 87. Jiwu Optoelectronic Business Overview
Table 88. Jiwu Optoelectronic Recent Developments
Table 89. Sony InGaAs Area Sensors Basic Information
Table 90. Sony InGaAs Area Sensors Product Overview
Table 91. Sony InGaAs Area Sensors Sales (K Units), Revenue (M USD), Price (USD/Unit) and Gross Margin (2019-2025)
Table 92. Sony Business Overview
Table 93. Sony Recent Developments
Table 94. GHOPTO InGaAs Area Sensors Basic Information
Table 95. GHOPTO InGaAs Area Sensors Product Overview
Table 96. GHOPTO InGaAs Area Sensors Sales (K Units), Revenue (M USD), Price (USD/Unit) and Gross Margin (2019-2025)
Table 97. GHOPTO Business Overview
Table 98. GHOPTO Recent Developments
Table 99. ZKDX InGaAs Area Sensors Basic Information
Table 100. ZKDX InGaAs Area Sensors Product Overview
Table 101. ZKDX InGaAs Area Sensors Sales (K Units), Revenue (M USD), Price (USD/Unit) and Gross Margin (2019-2025)
Table 102. ZKDX Business Overview
Table 103. ZKDX Recent Developments
Table 104. XenICs InGaAs Area Sensors Basic Information
Table 105. XenICs InGaAs Area Sensors Product Overview
Table 106. XenICs InGaAs Area Sensors Sales (K Units), Revenue (M USD), Price (USD/Unit) and Gross Margin (2019-2025)
Table 107. XenICs Business Overview
Table 108. XenICs Recent Developments
Table 109. Xi’an Leading Optoelectronic Technology InGaAs Area Sensors Basic Information
Table 110. Xi’an Leading Optoelectronic Technology InGaAs Area Sensors Product Overview
Table 111. Xi’an Leading Optoelectronic Technology InGaAs Area Sensors Sales (K Units), Revenue (M USD), Price (USD/Unit) and Gross Margin (2019-2025)
Table 112. Xi’an Leading Optoelectronic Technology Business Overview
Table 113. Xi’an Leading Optoelectronic Technology Recent Developments
Table 114. Global InGaAs Area Sensors Sales Forecast by Region (2025-2032) & (K Units)
Table 115. Global InGaAs Area Sensors Market Size Forecast by Region (2025-2032) & (M USD)
Table 116. North America InGaAs Area Sensors Sales Forecast by Country (2025-2032) & (K Units)
Table 117. North America InGaAs Area Sensors Market Size Forecast by Country (2025-2032) & (M USD)
Table 118. Europe InGaAs Area Sensors Sales Forecast by Country (2025-2032) & (K Units)
Table 119. Europe InGaAs Area Sensors Market Size Forecast by Country (2025-2032) & (M USD)
Table 120. Asia Pacific InGaAs Area Sensors Sales Forecast by Region (2025-2032) & (K Units)
Table 121. Asia Pacific InGaAs Area Sensors Market Size Forecast by Region (2025-2032) & (M USD)
Table 122. South America InGaAs Area Sensors Sales Forecast by Country (2025-2032) & (K Units)
Table 123. South America InGaAs Area Sensors Market Size Forecast by Country (2025-2032) & (M USD)
Table 124. Middle East and Africa InGaAs Area Sensors Consumption Forecast by Country (2025-2032) & (Units)
Table 125. Middle East and Africa InGaAs Area Sensors Market Size Forecast by Country (2025-2032) & (M USD)
Table 126. Global InGaAs Area Sensors Sales Forecast by Type (2025-2032) & (K Units)
Table 127. Global InGaAs Area Sensors Market Size Forecast by Type (2025-2032) & (M USD)
Table 128. Global InGaAs Area Sensors Price Forecast by Type (2025-2032) & (USD/Unit)
Table 129. Global InGaAs Area Sensors Sales (K Units) Forecast by Application (2025-2032)
Table 130. Global InGaAs Area Sensors Market Size Forecast by Application (2025-2032) & (M USD)
List of Figures
Figure 1. Product Picture of InGaAs Area Sensors
Figure 2. Data Triangulation
Figure 3. Key Caveats
Figure 4. Global InGaAs Area Sensors Market Size (M USD), 2019-2032
Figure 5. Global InGaAs Area Sensors Market Size (M USD) (2019-2032)
Figure 6. Global InGaAs Area Sensors Sales (K Units) & (2019-2032)
Figure 7. Evaluation Matrix of Segment Market Development Potential (Type)
Figure 8. Evaluation Matrix of Segment Market Development Potential (Application)
Figure 9. Evaluation Matrix of Regional Market Development Potential
Figure 10. InGaAs Area Sensors Market Size by Country (M USD)
Figure 11. InGaAs Area Sensors Sales Share by Manufacturers in 2023
Figure 12. Global InGaAs Area Sensors Revenue Share by Manufacturers in 2023
Figure 13. InGaAs Area Sensors Market Share by Company Type (Tier 1, Tier 2 and Tier 3): 2023
Figure 14. Global Market InGaAs Area Sensors Average Price (USD/Unit) of Key Manufacturers in 2023
Figure 15. The Global 5 and 10 Largest Players: Market Share by InGaAs Area Sensors Revenue in 2023
Figure 16. Evaluation Matrix of Segment Market Development Potential (Type)
Figure 17. Global InGaAs Area Sensors Market Share by Type
Figure 18. Sales Market Share of InGaAs Area Sensors by Type (2019-2025)
Figure 19. Sales Market Share of InGaAs Area Sensors by Type in 2023
Figure 20. Market Size Share of InGaAs Area Sensors by Type (2019-2025)
Figure 21. Market Size Market Share of InGaAs Area Sensors by Type in 2023
Figure 22. Evaluation Matrix of Segment Market Development Potential (Application)
Figure 23. Global InGaAs Area Sensors Market Share by Application
Figure 24. Global InGaAs Area Sensors Sales Market Share by Application (2019-2025)
Figure 25. Global InGaAs Area Sensors Sales Market Share by Application in 2023
Figure 26. Global InGaAs Area Sensors Market Share by Application (2019-2025)
Figure 27. Global InGaAs Area Sensors Market Share by Application in 2023
Figure 28. Global InGaAs Area Sensors Sales Growth Rate by Application (2019-2025)
Figure 29. Global InGaAs Area Sensors Sales Market Share by Region (2019-2025)
Figure 30. North America InGaAs Area Sensors Sales and Growth Rate (2019-2025) & (K Units)
Figure 31. North America InGaAs Area Sensors Sales Market Share by Country in 2023
Figure 32. U.S. InGaAs Area Sensors Sales and Growth Rate (2019-2025) & (K Units)
Figure 33. Canada InGaAs Area Sensors Sales (K Units) and Growth Rate (2019-2025)
Figure 34. Mexico InGaAs Area Sensors Sales (Units) and Growth Rate (2019-2025)
Figure 35. Europe InGaAs Area Sensors Sales and Growth Rate (2019-2025) & (K Units)
Figure 36. Europe InGaAs Area Sensors Sales Market Share by Country in 2023
Figure 37. Germany InGaAs Area Sensors Sales and Growth Rate (2019-2025) & (K Units)
Figure 38. France InGaAs Area Sensors Sales and Growth Rate (2019-2025) & (K Units)
Figure 39. U.K. InGaAs Area Sensors Sales and Growth Rate (2019-2025) & (K Units)
Figure 40. Italy InGaAs Area Sensors Sales and Growth Rate (2019-2025) & (K Units)
Figure 41. Russia InGaAs Area Sensors Sales and Growth Rate (2019-2025) & (K Units)
Figure 42. Asia Pacific InGaAs Area Sensors Sales and Growth Rate (K Units)
Figure 43. Asia Pacific InGaAs Area Sensors Sales Market Share by Region in 2023
Figure 44. China InGaAs Area Sensors Sales and Growth Rate (2019-2025) & (K Units)
Figure 45. Japan InGaAs Area Sensors Sales and Growth Rate (2019-2025) & (K Units)
Figure 46. South Korea InGaAs Area Sensors Sales and Growth Rate (2019-2025) & (K Units)
Figure 47. India InGaAs Area Sensors Sales and Growth Rate (2019-2025) & (K Units)
Figure 48. Southeast Asia InGaAs Area Sensors Sales and Growth Rate (2019-2025) & (K Units)
Figure 49. South America InGaAs Area Sensors Sales and Growth Rate (K Units)
Figure 50. South America InGaAs Area Sensors Sales Market Share by Country in 2023
Figure 51. Brazil InGaAs Area Sensors Sales and Growth Rate (2019-2025) & (K Units)
Figure 52. Argentina InGaAs Area Sensors Sales and Growth Rate (2019-2025) & (K Units)
Figure 53. Columbia InGaAs Area Sensors Sales and Growth Rate (2019-2025) & (K Units)
Figure 54. Middle East and Africa InGaAs Area Sensors Sales and Growth Rate (K Units)
Figure 55. Middle East and Africa InGaAs Area Sensors Sales Market Share by Region in 2023
Figure 56. Saudi Arabia InGaAs Area Sensors Sales and Growth Rate (2019-2025) & (K Units)
Figure 57. UAE InGaAs Area Sensors Sales and Growth Rate (2019-2025) & (K Units)
Figure 58. Egypt InGaAs Area Sensors Sales and Growth Rate (2019-2025) & (K Units)
Figure 59. Nigeria InGaAs Area Sensors Sales and Growth Rate (2019-2025) & (K Units)
Figure 60. South Africa InGaAs Area Sensors Sales and Growth Rate (2019-2025) & (K Units)
Figure 61. Global InGaAs Area Sensors Production Market Share by Region (2019-2025)
Figure 62. North America InGaAs Area Sensors Production (K Units) Growth Rate (2019-2025)
Figure 63. Europe InGaAs Area Sensors Production (K Units) Growth Rate (2019-2025)
Figure 64. Japan InGaAs Area Sensors Production (K Units) Growth Rate (2019-2025)
Figure 65. China InGaAs Area Sensors Production (K Units) Growth Rate (2019-2025)
Figure 66. Global InGaAs Area Sensors Sales Forecast by Volume (2019-2032) & (K Units)
Figure 67. Global InGaAs Area Sensors Market Size Forecast by Value (2019-2032) & (M USD)
Figure 68. Global InGaAs Area Sensors Sales Market Share Forecast by Type (2025-2032)
Figure 69. Global InGaAs Area Sensors Market Share Forecast by Type (2025-2032)
Figure 70. Global InGaAs Area Sensors Sales Forecast by Application (2025-2032)
Figure 71. Global InGaAs Area Sensors Market Share Forecast by Application (2025-2032)