Key Statistics
Key Takeaways
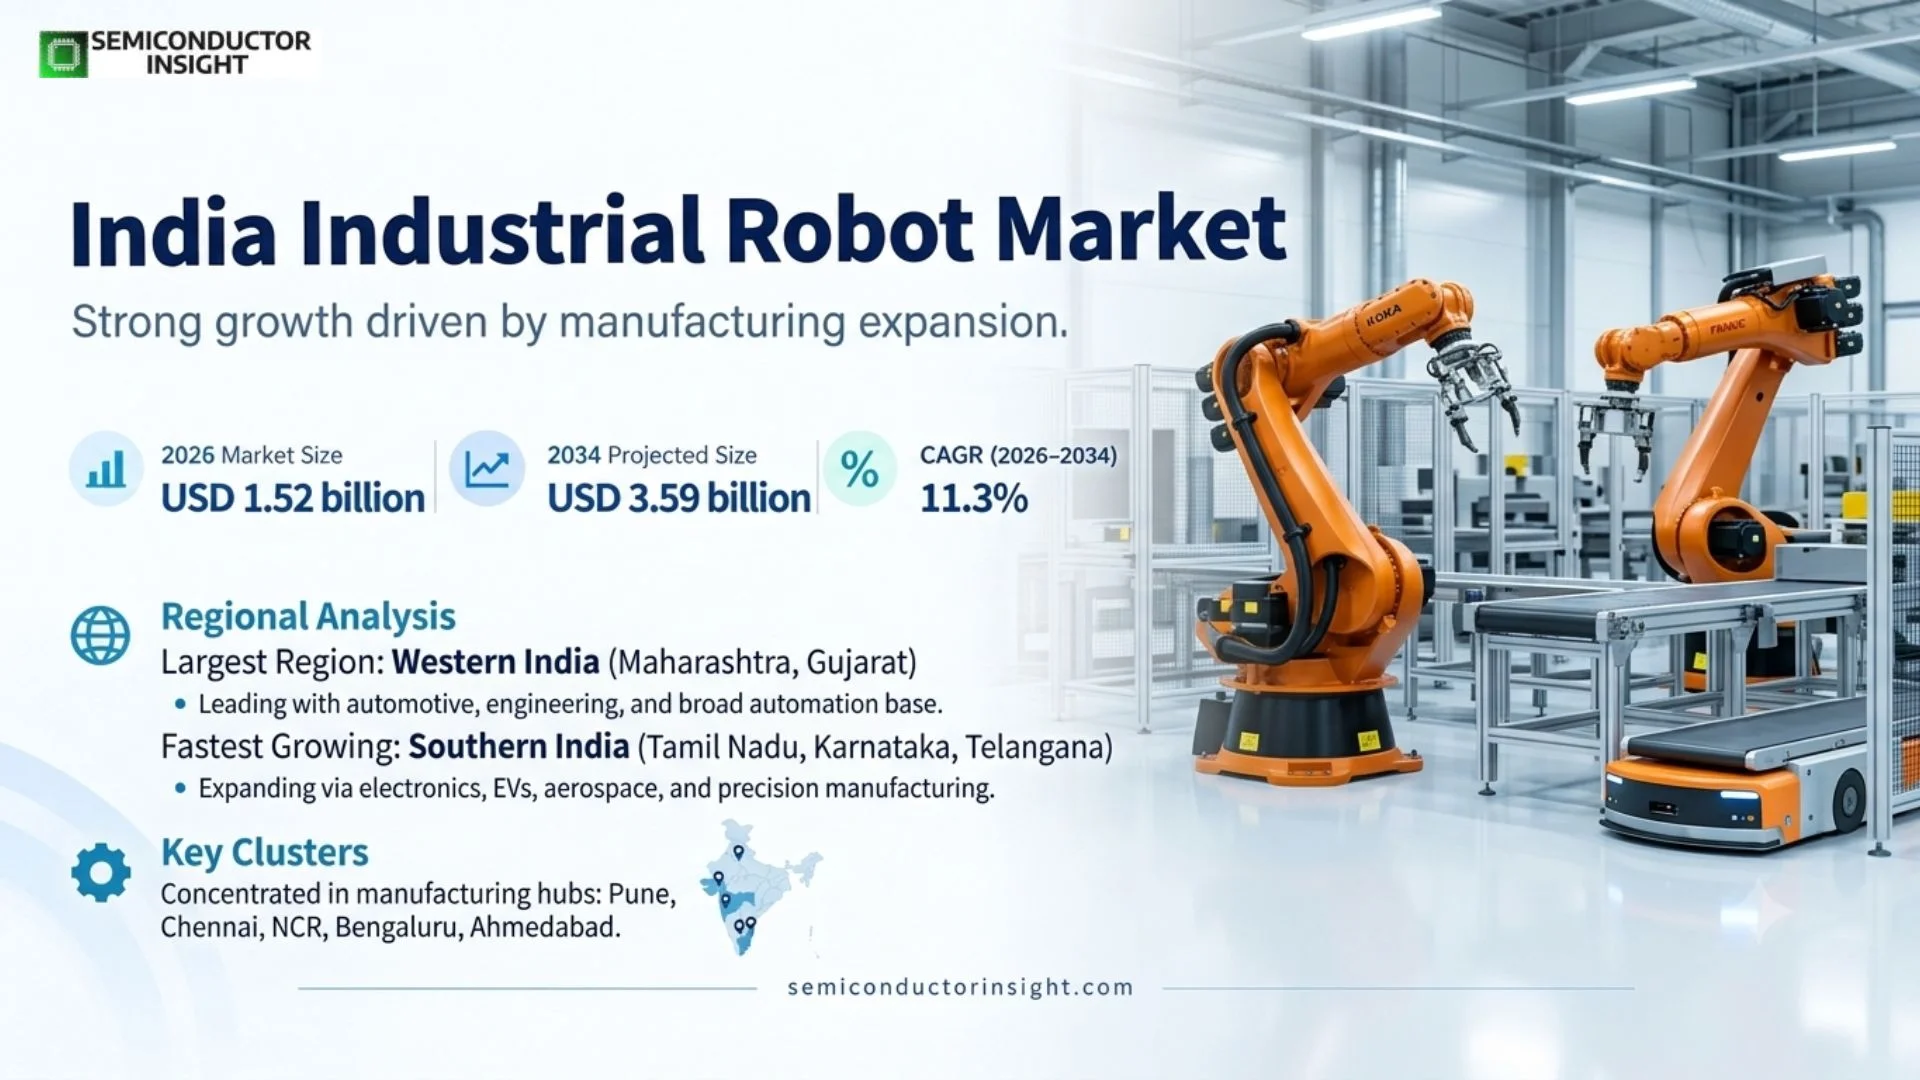
- Market size and growth: India’s industrial robot market is estimated at USD 1.52 billion in 2026 and is projected to reach USD 3.59 billion by 2034, representing an 11.3% CAGR during 2026–2034.
- Articulated robots remain the largest type because automotive welding, handling, machine tending and assembly require multi-axis reach, payload and mature integration ecosystems.
- Automotive is the leading application: IFR reported 4,070 robot installations in India’s automotive industry in 2024, equal to 45% of national industrial-robot installations.
- India reached a record 9,120 industrial-robot installations in 2024, up 7% year over year, and the operational stock reached 52,570 units, showing a large runway for further automation.
- SME adoption is the main white-space opportunity as collaborative robots, standardized cells and financing models reduce the engineering and capital barriers that historically limited automation outside large manufacturers.
India Industrial Robot Market Overview
India industrial Robot Market was valued at USD 1.37 billion in 2025 and is estimated at USD 1.52 billion in 2026. The market is projected to reach USD 3.59 billion by 2034, representing a CAGR of 11.3% during 2026–2034. Western India is the leading manufacturing cluster, supported by automotive and engineering concentration, while southern states are expanding quickly through electronics, automotive and precision manufacturing.
Base year: 2025 · Estimated year: 2026 · Forecast period: 2026–2034 · Values in USD million unless otherwise stated
Industrial robots are programmable, automatically controlled manipulators used for welding, assembly, material handling, machine tending, painting, palletizing and other repetitive manufacturing tasks. India’s market is moving from an automotive-led automation base toward broader adoption across electronics, plastics, metals, pharmaceuticals and food processing. The expansion is supported by rising production complexity, quality requirements, labor-safety priorities and factory investment that increasingly treats automation as a core productivity tool rather than a premium capital add-on.
International Federation of Robotics data show that India installed a record 9,120 industrial robots in 2024, a 7% increase from the previous year, placing the country sixth globally for annual installations. The operational stock reached 52,570 units. Automotive remained the largest user with 4,070 installations, while parts suppliers installed 2,100 units and plastic and chemical industries recorded 600 installations. These figures show that the market is scaling beyond isolated flagship plants into a broader manufacturing base.
India’s manufacturing investment is reinforcing demand through electronics, automotive, battery, machinery and export-oriented capacity expansion. The strongest commercial opportunity is not limited to selling robot arms: system integrators, grippers, machine vision, safety systems, software and application engineering all expand with each installation. This favors suppliers that can deliver standardized cells for mid-sized manufacturers while still supporting sophisticated multi-robot lines for automotive and electronics customers.
Segment Analysis: By Type
By type, the market is segmented into articulated, parallel, SCARA, cylindrical and Cartesian robots. Articulated robots lead because their six-axis flexibility supports welding, handling, machine tending and assembly across automotive and general industry. SCARA and Cartesian systems are important in electronics, packaging and high-speed handling, while parallel robots are favored for fast lightweight pick-and-place. The mix is broadening as electronics and consumer-goods manufacturers invest in higher-throughput automation.
| Type | Technical / commercial role | Market position |
|---|---|---|
| Articulated Robots | Multi-axis welding, handling, machine tending and assembly. | Largest segment; strongest automotive and general-industry installed base. |
| Parallel Robots | High-speed pick-and-place for food, packaging and lightweight components. | Niche but strong where cycle time is the primary metric. |
| SCARA Robots | Fast assembly, insertion and handling in electronics and light manufacturing. | Growing with electronics and precision-assembly investment. |
| Cylindrical Robots | Specialized machine loading and legacy automation. | Smaller installed base with application-specific use. |
| Cartesian Robots | Linear-axis handling, gantry systems and machine tending. | Cost-effective for rectangular work envelopes and heavier loads. |
Segment Analysis: By Application
Applications are led by automotive, followed by electrical and electronics, metals and machinery, chemicals and plastics, and food or pharmaceutical production. Automotive remains the strongest demand engine because body-in-white, welding, painting and material handling are highly robot-intensive. Electronics is strategically important because India is expanding local assembly and component manufacturing, increasing demand for SCARA, Cartesian and small articulated robots with vision-guided handling and traceability.
| Application | Demand characteristics |
|---|---|
| Automotive | Largest application; 4,070 installations in 2024 according to IFR. |
| Electrical & Electronics | Growing through electronics assembly, component manufacturing, testing and precision handling. |
| Chemical, Rubber & Plastic | 600 installations in 2024; molding, handling and packaging support automation. |
| Metal & Machinery | Machine tending, welding and fabrication; IFR reported 420 installations in 2024. |
| Food, Beverages & Pharmaceuticals | Packaging, palletizing, inspection and hygiene-sensitive handling create selective growth. |
| Others | Logistics, warehousing, consumer goods and emerging general-industry applications. |
Segment Analysis: By Payload Class
Payload class is commercially important because it determines robot mechanics, reach, drive systems and end-effector capability. Low-payload robots are expanding in electronics, laboratory and small-parts handling, medium-payload robots cover a broad range of machine-tending and assembly tasks, and high-payload systems remain essential in automotive body handling, casting and heavy fabrication. India’s widening manufacturing base is increasing demand across all three groups rather than concentrating growth only in heavy automotive cells.
| Payload Class | Typical Applications |
|---|---|
| Low Payload | Electronics assembly, inspection, small-part handling and collaborative tasks. |
| Medium Payload | Machine tending, general assembly, packaging and material transfer. |
| High Payload | Automotive body handling, foundry, large welding fixtures and heavy industrial handling. |
Segment Analysis: By Integration Mode
Integration mode separates traditional fenced robot cells from collaborative and flexible systems. Conventional fixed cells still dominate high-speed and high-payload production because they maximize throughput, while collaborative deployments are expanding in SMEs that need lower-floor-space automation and easier redeployment. Vision-guided systems are also emerging where products or fixtures change frequently. The shift widens the addressable market by reducing the engineering effort required to automate lower-volume manufacturing lines.
| Integration Mode | Commercial Role |
|---|---|
| Traditional Fenced Cells | Highest throughput for welding, painting, handling and established mass-production applications. |
| Collaborative Robot Cells | Lower integration barrier for SMEs, assembly, inspection and variable production. |
| Flexible / Vision-guided Cells | Supports mixed products, random-bin picking and shorter production runs. |
Regional Analysis
India is a single-country market, so the regional analysis focuses on major manufacturing clusters. Western India leads through Maharashtra and Gujarat, where automotive, engineering, chemicals and export manufacturing create a broad automation base. Southern India is expanding through Tamil Nadu, Karnataka and Telangana in automotive, electronics, aerospace and machinery. Northern clusters around NCR and Haryana remain important for automotive and electronics, while eastern India has a smaller but growing base in metals and heavy industry.
Industrial-robot demand within India follows factory concentration rather than population. Pune, Chennai, NCR, Bengaluru, Ahmedabad and other industrial corridors support dense networks of OEM plants, Tier 1 suppliers and automation integrators. These clusters shorten commissioning and service times, which matters because robot adoption requires application engineering, safety validation and maintenance capability. Regions with expanding electronics, EV, battery and precision-manufacturing investments are likely to grow faster than areas dominated by low-automation process industries.
| Region | Position | Growth outlook | Demand profile | Supplier-selection factor |
|---|---|---|---|---|
| Western India | Leading cluster | High | Automotive, engineering, chemicals | Integrator density and service |
| Southern India | Fast expansion | High | Automotive, electronics, aerospace | Precision automation and engineering talent |
| Northern India | Major | Moderate-High | Automotive, electronics, appliances | Cost-effective standardized cells |
| Eastern India | Developing | Moderate | Metals, heavy industry | Heavy-duty automation and service |
| Central India | Selective | Moderate | Auto supply and general industry | Project economics and local integration |
Competitive Landscape
Competition in the India Industrial Robot market is shaped by technology performance, customer qualification, application engineering and continuity of supply. Leading companies use product breadth and global support to win large programs, while specialist suppliers can defend attractive niches through deeper technical performance in specific applications. As the market expands, customers increasingly evaluate total system value and lifecycle support rather than relying only on initial component price.
The leading suppliers compete through a combination of proprietary technology, manufacturing scale and customer relationships. In the India Industrial Robot market, design wins can remain in place for several product generations because switching suppliers often requires requalification, software changes or manufacturing adjustments. This creates durable revenue positions for vendors that deliver reliable performance and responsive technical support.
Regional suppliers can still gain share where local availability, cost and fast engineering response matter. Their strongest opportunities are generally in standardized or mature applications, while the highest-performance segments remain concentrated among companies with deeper intellectual property, process control and qualification histories. This creates a market structure with both global platform leaders and specialized regional competitors.
Competitive strategy is increasingly moving toward integrated solutions. Customers prefer suppliers that can combine the core product with software, interface components, testing, support or adjacent technologies because integration reduces project risk and development time. Companies able to solve a broader customer problem therefore have more pricing power than vendors competing only on a single specification.
| Competitive tier | Representative companies | Competitive basis |
|---|---|---|
| Global technology leaders | ABB India Ltd, FANUC India Private Limited, Yaskawa India, KUKA Robotics India | Scale, broad product portfolios, strong R&D and global customer support. |
| Established specialists | Mitsubishi Electric India Pvt. Ltd, Kawasaki Robotics India, Seiko Epson Corporation, Stäubli India | Application-specific engineering and strong qualification in selected segments. |
| Regional / emerging suppliers | Universal Robots (India) Pvt. Ltd, Comau India Pvt Ltd | Local service, competitive pricing and focused customer relationships. |
Key Participants
The profiled competitive set includes ABB India Ltd, FANUC India Private Limited, Yaskawa India, KUKA Robotics India, Mitsubishi Electric India Pvt. Ltd, Kawasaki Robotics India, Seiko Epson Corporation, Stäubli India, Universal Robots (India) Pvt. Ltd, Comau India Pvt Ltd. Supplier position depends on engineering performance, customer qualification, manufacturing continuity and the ability to support design changes over long product cycles. Larger vendors benefit from broad portfolios and application teams, while specialists can retain strong positions in narrow, technically demanding subsegments where historical qualification and process know-how create meaningful switching costs.
Production Capacity Analysis
Production capacity for India Industrial Robot is constrained by the combination of specialized equipment, qualified materials, process know-how and customer-specific validation. Nominal factory output can overstate commercial supply because a new line or material source must often demonstrate consistent performance before it can serve high-value customers. This makes qualified capacity more important than raw nameplate capacity.
Regional manufacturing and service capacity influence lead time and resilience. Customers increasingly prefer suppliers that can support major production clusters from more than one site, reducing exposure to logistics disruption and single-factory events. At the same time, duplicating specialized processes can be difficult because equipment recipes, trained engineers and quality systems must be transferred without changing product performance.
The strongest capacity investments are aligned with structural demand drivers rather than short-term cycles. Suppliers expanding around AI, advanced semiconductor manufacturing, automotive electronics or industrial automation seek to secure positions before customer volumes scale. Effective capacity therefore includes engineering resources, test capability and local technical support in addition to physical manufacturing equipment.
| Capacity factor | Market implication |
|---|---|
| Specialized manufacturing | Determines qualified output and technical performance. |
| Critical materials / components | Can constrain supply despite available factory floor space. |
| Qualification and test | Controls how quickly new capacity becomes usable by customers. |
| Regional support | Improves lead time, resilience and customer retention. |
Market Dynamics
The India Industrial Robot market is driven by higher system performance, automation, digitalization and expanding use in high-value applications. Growth is moderated by development cost, qualification requirements and supply-chain concentration. The strongest opportunities occur where new architectures or applications create a clear performance advantage and where suppliers can reduce integration complexity for customers.
MARKET DRIVERS
| Driver | Relative impact | Commercial mechanism |
|---|---|---|
| Structural end-market growth | High | Expanding deployments increase unit demand and installed-base requirements. |
| Technology upgrade cycle | High | Higher performance raises value per product and accelerates replacement. |
| Customer integration needs | Medium-High | Validated solutions reduce engineering time and project risk. |
| Regional capacity expansion | Medium | New manufacturing clusters create local supplier demand. |
Structural end-market expansion
Growth in the India Industrial Robot market is supported by rising deployment across its principal applications. Customers are investing because the technology improves performance, efficiency, automation or product capability in ways that are difficult to replicate with older approaches. This expands both new-system demand and the installed base that later requires replacement, upgrades or related services.
Higher technical requirements increase value per system
New product generations demand tighter performance, greater integration and better reliability. These requirements can increase selling prices even when unit volumes grow more slowly, because customers are willing to pay for solutions that protect yield, uptime or user experience. Suppliers with stronger engineering capability therefore benefit disproportionately from technology transitions.
Regional investment broadens customer access
Manufacturing and infrastructure investment in North America, Europe and Asia is creating additional customer clusters outside traditional centers. Local engineering support and shorter supply chains help suppliers qualify products earlier in new projects, creating an opportunity to win design positions before production reaches full scale.
MARKET RESTRAINTS
| Restraint | Relative impact | Commercial mechanism |
|---|---|---|
| Development and qualification cost | High | Raises barriers to entry and lengthens customer adoption. |
| Supply-chain concentration | Medium-High | Critical components or materials can limit output. |
| Price pressure | Medium | Customers seek lower total system cost as volumes increase. |
| Technology substitution | Medium | Alternative architectures can replace incumbent solutions in selected uses. |
Qualification slows supplier switching
Customers in technical markets cannot change suppliers based only on purchase price. New products must demonstrate performance, reliability and compatibility in the actual application, which can require months of engineering work. This limits the pace at which new entrants gain share and can delay commercialization of technically promising products.
Specialized inputs can constrain supply
Advanced products depend on a limited number of qualified materials, components or manufacturing tools. Shortages or long lead times at one upstream stage can restrict finished-product output even when downstream assembly capacity is available. Suppliers therefore carry strategic inventory or qualify alternate sources, but those actions increase cost.
Customer cost pressure remains persistent
As a technology becomes more widely adopted, customers expect lower unit costs and may redesign systems to use standardized components. Suppliers must offset this pressure through better performance, lower manufacturing cost and additional software or service value. Vendors that cannot maintain differentiation can face margin erosion even in a growing market.
MARKET OPPORTUNITIES
High-performance product generations
New architectures create opportunities for premium products that solve tighter performance, efficiency or integration requirements.
Localized supply and technical support
Customers increasingly value shorter lead times and regional engineering, especially for production-critical components.
Software and data-enabled services
Monitoring, analytics and updateable software can create recurring value beyond the initial hardware sale.
Emerging end-use applications
New industries and use cases can broaden the addressable market beyond the traditional customer base.
Supply Chain Analysis
Specialized materials and components
Core product manufacturing
Qualification and system integration
End-user deployment, service and replacement
The upstream supply chain provides the specialized materials, semiconductor devices, mechanical components or substrates that determine baseline product performance. Qualified inputs are important because changes in composition or manufacturing source can alter reliability, electrical behavior or process compatibility. Suppliers therefore maintain close technical relationships with upstream partners and often approve alternate sources before a disruption occurs.
Manufacturing converts these inputs into finished products using process-specific equipment, inspection and test. Quality systems are central because customers expect lot-to-lot consistency and traceability, particularly in semiconductor, automotive and industrial applications. High-value suppliers differentiate through process control rather than simple assembly scale, and they invest heavily in metrology or validation to protect yield.
Downstream value is created when the product is integrated into the customer system and validated under real operating conditions. Application engineers support installation, software, calibration or process optimization, while service teams maintain the installed base. This lifecycle relationship creates recurring revenue through replacement, updates, refurbishment or expansion and makes customer support an important part of the market structure.
Recent Developments
25 Sep 2025 — India rises to sixth globally in industrial-robot installations
The International Federation of Robotics reported a record 9,120 industrial robots installed in India during 2024, up 7%. Automotive installations rose 15% to 4,070 units and the operational stock reached 52,570 robots, confirming that automation is expanding beyond a small number of flagship factories. Source
25 Sep 2025 — World Robotics 2025 confirms India’s growth
Global installations reached 542,000 units in 2024 and Asia accounted for 74% of deployments. India moved to sixth place globally, increasing competitive pressure on domestic manufacturers to automate production and quality processes. Source
REPORT SCOPE & SEGMENTATION
| Base Year | 2025 |
| Estimated Year | 2026 |
| Forecast Year | 2034 |
| 2025 Market Size | USD 1.37 billion |
| 2026 Market Size | USD 1.52 billion |
| 2034 Market Size | USD 3.59 billion |
| CAGR | 11.3% during 2026–2034 |
| Largest Market / Leading Geography | Western India |
| By Type | Articulated Robots; Parallel Robots; SCARA Robots; Cylindrical Robots; Cartesian Robots |
| By Application | Automotive; Electrical & Electronics; Chemical, Rubber & Plastic; Metal & Machinery; Food, Beverages & Pharmaceuticals; Others |
| By Payload Class | Low Payload; Medium Payload; High Payload |
| By Integration Mode | Traditional Fenced Cells; Collaborative Robot Cells; Flexible / Vision-guided Cells |
| Key Companies | ABB India; FANUC India; Yaskawa India; KUKA Robotics India; Mitsubishi Electric India; Kawasaki Robotics India; Epson; Stäubli India; Universal Robots India; Comau India |
Frequently Asked Questions
What is the size of India’s industrial robot market?
The market is estimated at USD 1.52 billion in 2026 and is projected to reach USD 3.59 billion by 2034, representing an 11.3% CAGR during 2026–2034. The 2025 market size is USD 1.37 billion.
How many industrial robots were installed in India in 2024?
IFR reported 9,120 industrial robots installed in India in 2024, a 7% year-over-year increase. India ranked sixth globally for annual industrial-robot installations.
Which industry leads robot demand in India?
Automotive is the leading application. IFR recorded 4,070 installations in the automotive sector in 2024, representing 45% of India’s total industrial-robot installations.
Which robot type leads the market?
Articulated robots lead because they are widely used for welding, machine tending, material handling and assembly, particularly in automotive and general engineering.
What is the main opportunity outside automotive?
Electronics, EV components, general machinery and SMEs provide the largest white-space opportunity, especially for compact articulated robots, SCARA systems, collaborative robots and vision-guided cells.
What are the biggest barriers to adoption?
Upfront integration cost, limited automation expertise among smaller manufacturers, production variability and dependence on globally sourced components remain the main constraints.
Research Sources & Evidence Base
Get Sample Report PDF for Exclusive Insights
Report Sample Includes
- Table of Contents
- List of Tables & Figures
- Charts, Research Methodology, and more...
 Download Sample Report PDF