Image Processing SoC Chip Market, Size, Trends, Business Strategies 2025-2032

The global Image Processing SoC Chip Market size was estimated at USD 3400 million in 2023 and is projected to reach USD 7569.38 million by 2032, exhibiting a CAGR of 9.30% during the forecast period.

PDF Icon Download Sample Report PDF
  • Quick Dispatch

    All Orders

  • Secure Payment

    100% Secure Payment

Compare

$1,500.00$4,250.00

Clear

Image Processing SoC Chip Market Overview

Image processing SoC chip is a chip solution that integrates multiple functions such as image processor, CPU, memory, interface controller, etc. It can efficiently process visual data collected from image sensors, including multiple steps such as image acquisition, encoding and decoding, analysis, enhancement and transmission. These chips are widely used in various devices that require visual processing capabilities. Through image processing SoC chips, devices can realize real-time image processing and analysis, including advanced functions such as face recognition, object detection and tracking, scene recognition, etc., which greatly improves the intelligence level of the device and user experience.

This report provides a deep insight into the global Image Processing SoC Chip market covering all its essential aspects. This ranges from a macro overview of the market to micro details of the market size, competitive landscape, development trend, niche market, key market drivers and challenges, SWOT analysis, value chain analysis, etc.

The analysis helps the reader to shape the competition within the industries and strategies for the competitive environment to enhance the potential profit. Furthermore, it provides a simple framework for evaluating and accessing the position of the business organization. The report structure also focuses on the competitive landscape of the Global Image Processing SoC Chip Market, this report introduces in detail the market share, market performance, product situation, operation situation, etc. of the main players, which helps the readers in the industry to identify the main competitors and deeply understand the competition pattern of the market.
In a word, this report is a must-read for industry players, investors, researchers, consultants, business strategists, and all those who have any kind of stake or are planning to foray into the Image Processing SoC Chip market in any manner.

Image Processing SoC Chip Market Analysis:

The global Image Processing SoC Chip Market size was estimated at USD 3400 million in 2023 and is projected to reach USD 7569.38 million by 2032, exhibiting a CAGR of 9.30% during the forecast period.

North America Image Processing SoC Chip market size was estimated at USD 1032.82 million in 2023, at a CAGR of 7.97% during the forecast period of 2025 through 2032.

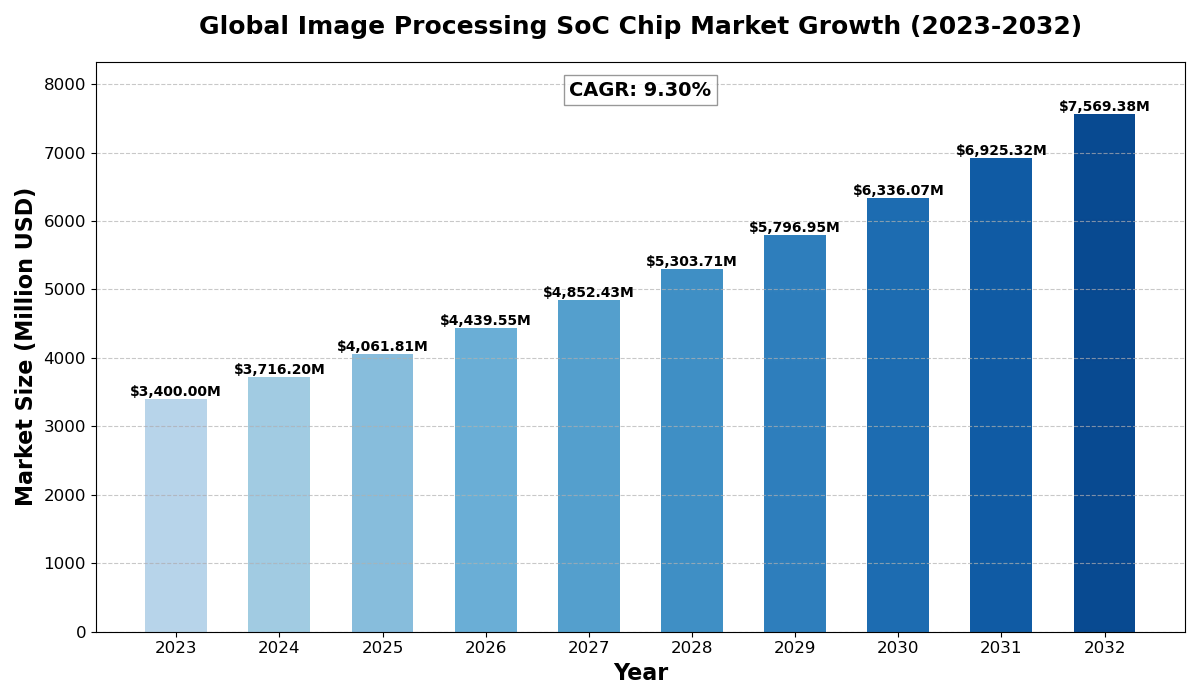
Image Processing SoC Chip Key Market Trends  :

  1. Growing Adoption in AI and Edge Computing
    Image processing SoC chips are increasingly integrated with AI and edge computing to enable real-time processing for applications like autonomous vehicles and smart surveillance.
  2. Rising Demand in Automotive Applications
    The automotive industry is a key driver, with the growing adoption of ADAS (Advanced Driver Assistance Systems) and autonomous driving solutions boosting demand for high-performance image processing SoCs.
  3. Advancements in 3D Imaging and Computational Photography
    Enhanced 3D imaging, AR/VR applications, and computational photography innovations are shaping the market, particularly in consumer electronics and healthcare.
  4. Increasing Integration of AI-Based Security Systems
    AI-powered security equipment leveraging image processing SoCs for facial recognition, motion detection, and behavior analysis is gaining traction in smart cities and enterprise security.
  5. Shift Towards Energy-Efficient and Compact SoCs
    Manufacturers are focusing on power-efficient, high-performance SoCs to enhance battery life in portable devices while maintaining processing capabilities.

Image Processing SoC Chip Market Regional Analysis :

semi insight

  • North America:

    Strong demand driven by EVs, 5G infrastructure, and renewable energy, with the U.S. leading the market.

  • Europe:

    Growth fueled by automotive electrification, renewable energy, and strong regulatory support, with Germany as a key player.

  • Asia-Pacific:

    Dominates the market due to large-scale manufacturing in China and Japan, with growing demand from EVs, 5G, and semiconductors.

  • South America:

    Emerging market, driven by renewable energy and EV adoption, with Brazil leading growth.

  • Middle East & Africa:

    Gradual growth, mainly due to investments in renewable energy and EV infrastructure, with Saudi Arabia and UAE as key contributors.

Image Processing SoC Chip Market Segmentation

The research report includes specific segments by region (country), manufacturers, Type, and Application. Market segmentation creates subsets of a market based on product type, end-user or application, Geographic, and other factors. By understanding the market segments, the decision-maker can leverage this targeting in the product, sales, and marketing strategies. Market segments can power your product development cycles by informing how you create product offerings for different segments.
Key Company

  • Kneron
  • Marvell
  • Imagination Technologies
  • Qualcomm
  • OMNIVISION
  • AMD
  • Ambarella
  • NXP Semiconductors
  • STMicroelectronics
  • Haisi Technology
  • Verisilicon Microelectronics
  • Realtek
  • Foxlink
  • Lianyun Technology
  • X Chip Microelectronics
  • Fullhan Microelectronics

Market Segmentation (by Type)

  • Integrated
  • Modular

Market Segmentation (by Application)

  • Automotive
  • Consumer Electronics
  • Security Equipment
  • Others

Drivers:

  • Rapid Growth of AI and IoT Devices
    The increasing integration of AI and IoT in smart devices is fueling demand for advanced image processing SoC chips.
  • Expanding Use in Consumer Electronics
    High adoption in smartphones, smart cameras, and wearable devices is driving market expansion.
  • Government Investments in Smart Infrastructure
    Various countries are investing in smart city projects, boosting demand for AI-powered surveillance systems and intelligent transportation solutions.

Restraints:

  • High Development Costs
    Designing and manufacturing image processing SoC chips requires significant investment, limiting market entry for smaller players.
  • Complexity in Integration
    The integration of AI and image processing capabilities increases design complexity, requiring skilled expertise and advanced technology.
  • Supply Chain Disruptions
    Chip shortages and supply chain disruptions can impact production and delay product launches in the industry.

Opportunities:

  • Rising Demand for AR/VR and Metaverse Applications
    The growth of AR/VR technologies in gaming, retail, and education presents a lucrative market for image processing SoC chips.
  • Advancements in 5G Connectivity
    5G networks enable faster data transmission, enhancing the capabilities of real-time image processing solutions.
  • Growing Adoption in Healthcare Imaging
    The increasing use of image processing SoCs in medical imaging devices improves diagnostic accuracy and efficiency.

Challenges:

  • Intense Market Competition
    Leading tech giants dominate the market, making it challenging for new entrants to establish a strong presence.
  • Regulatory and Privacy Concerns
    Data security and privacy regulations may restrict the use of AI-powered image processing solutions in certain regions.
  • Technical Limitations in Low-Power Applications
    Power constraints in portable and battery-operated devices limit the performance of high-end image processing SoCs.

Key Benefits of This Market Research:

  • Industry drivers, restraints, and opportunities covered in the study
  • Neutral perspective on the market performance
  • Recent industry trends and developments
  • Competitive landscape & strategies of key players
  • Potential & niche segments and regions exhibiting promising growth covered
  • Historical, current, and projected market size, in terms of value
  • In-depth analysis of the Image Processing SoC Chip Market
  • Overview of the regional outlook of the Image Processing SoC Chip Market:

Key Reasons to Buy this Report:

  • Access to date statistics compiled by our researchers. These provide you with historical and forecast data, which is analyzed to tell you why your market is set to change
  • This enables you to anticipate market changes to remain ahead of your competitors
  • You will be able to copy data from the Excel spreadsheet straight into your marketing plans, business presentations, or other strategic documents
  • The concise analysis, clear graph, and table format will enable you to pinpoint the information you require quickly
  • Provision of market value data for each segment and sub-segment
  • Indicates the region and segment that is expected to witness the fastest growth as well as to dominate the market
  • Includes in-depth analysis of the market from various perspectives through Porters five forces analysis
  • Provides insight into the market through Value Chain
  • Market dynamics scenario, along with growth opportunities of the market in the years to come
  • 6-month post-sales analyst support

Customization of the Report
In case of any queries or customization requirements, please connect with our sales team, who will ensure that your requirements are met.


FAQs

Q: What are the key driving factors and opportunities in the Image Processing SoC Chip market?

A: The market is driven by advancements in AI, the rising demand for consumer electronics, and government investments in smart infrastructure. Opportunities lie in AR/VR applications, 5G connectivity, and healthcare imaging.


Q: Which region is projected to have the largest market share?

A: Asia-Pacific is expected to dominate the market due to high consumer electronics demand, technological advancements, and strong manufacturing capabilities in countries like China, Japan, and South Korea.


Q: Who are the top players in the global Image Processing SoC Chip market?

A: Leading companies include Qualcomm, AMD, OMNIVISION, NXP Semiconductors, STMicroelectronics, and Ambarella, among others.


Q: What are the latest technological advancements in the industry?

A: Recent advancements include AI-driven image processing, 3D imaging, energy-efficient SoCs, and improved computational photography techniques for better image enhancement.


Q: What is the current size of the global Image Processing SoC Chip market?

A: The market was valued at USD 3,400 million in 2023 and is expected to reach USD 7,569.38 million by 2032, with a CAGR of 9.30% during the forecast period.

Image Processing SoC Chip Market, Size, Trends, Business Strategies 2025-2032

Get Sample Report PDF for Exclusive Insights

Report Sample Includes

  • Table of Contents
  • List of Tables & Figures
  • Charts, Research Methodology, and more...
PDF Icon Download Sample Report PDF

Download Sample Report

Table of Content

Table of Contents
1 Research Methodology and Statistical Scope
1.1 Market Definition and Statistical Scope of Image Processing SoC Chip
1.2 Key Market Segments
1.2.1 Image Processing SoC Chip Segment by Type
1.2.2 Image Processing SoC Chip Segment by Application
1.3 Methodology & Sources of Information
1.3.1 Research Methodology
1.3.2 Research Process
1.3.3 Market Breakdown and Data Triangulation
1.3.4 Base Year
1.3.5 Report Assumptions & Caveats
2 Image Processing SoC Chip Market Overview
2.1 Global Market Overview
2.1.1 Global Image Processing SoC Chip Market Size (M USD) Estimates and Forecasts (2019-2032)
2.1.2 Global Image Processing SoC Chip Sales Estimates and Forecasts (2019-2032)
2.2 Market Segment Executive Summary
2.3 Global Market Size by Region
3 Image Processing SoC Chip Market Competitive Landscape
3.1 Global Image Processing SoC Chip Sales by Manufacturers (2019-2025)
3.2 Global Image Processing SoC Chip Revenue Market Share by Manufacturers (2019-2025)
3.3 Image Processing SoC Chip Market Share by Company Type (Tier 1, Tier 2, and Tier 3)
3.4 Global Image Processing SoC Chip Average Price by Manufacturers (2019-2025)
3.5 Manufacturers Image Processing SoC Chip Sales Sites, Area Served, Product Type
3.6 Image Processing SoC Chip Market Competitive Situation and Trends
3.6.1 Image Processing SoC Chip Market Concentration Rate
3.6.2 Global 5 and 10 Largest Image Processing SoC Chip Players Market Share by Revenue
3.6.3 Mergers & Acquisitions, Expansion
4 Image Processing SoC Chip Industry Chain Analysis
4.1 Image Processing SoC Chip Industry Chain Analysis
4.2 Market Overview of Key Raw Materials
4.3 Midstream Market Analysis
4.4 Downstream Customer Analysis
5 The Development and Dynamics of Image Processing SoC Chip Market
5.1 Key Development Trends
5.2 Driving Factors
5.3 Market Challenges
5.4 Market Restraints
5.5 Industry News
5.5.1 New Product Developments
5.5.2 Mergers & Acquisitions
5.5.3 Expansions
5.5.4 Collaboration/Supply Contracts
5.6 Industry Policies
6 Image Processing SoC Chip Market Segmentation by Type
6.1 Evaluation Matrix of Segment Market Development Potential (Type)
6.2 Global Image Processing SoC Chip Sales Market Share by Type (2019-2025)
6.3 Global Image Processing SoC Chip Market Size Market Share by Type (2019-2025)
6.4 Global Image Processing SoC Chip Price by Type (2019-2025)
7 Image Processing SoC Chip Market Segmentation by Application
7.1 Evaluation Matrix of Segment Market Development Potential (Application)
7.2 Global Image Processing SoC Chip Market Sales by Application (2019-2025)
7.3 Global Image Processing SoC Chip Market Size (M USD) by Application (2019-2025)
7.4 Global Image Processing SoC Chip Sales Growth Rate by Application (2019-2025)
8 Image Processing SoC Chip Market Consumption by Region
8.1 Global Image Processing SoC Chip Sales by Region
8.1.1 Global Image Processing SoC Chip Sales by Region
8.1.2 Global Image Processing SoC Chip Sales Market Share by Region
8.2 North America
8.2.1 North America Image Processing SoC Chip Sales by Country
8.2.2 U.S.
8.2.3 Canada
8.2.4 Mexico
8.3 Europe
8.3.1 Europe Image Processing SoC Chip Sales by Country
8.3.2 Germany
8.3.3 France
8.3.4 U.K.
8.3.5 Italy
8.3.6 Russia
8.4 Asia Pacific
8.4.1 Asia Pacific Image Processing SoC Chip Sales by Region
8.4.2 China
8.4.3 Japan
8.4.4 South Korea
8.4.5 India
8.4.6 Southeast Asia
8.5 South America
8.5.1 South America Image Processing SoC Chip Sales by Country
8.5.2 Brazil
8.5.3 Argentina
8.5.4 Columbia
8.6 Middle East and Africa
8.6.1 Middle East and Africa Image Processing SoC Chip Sales by Region
8.6.2 Saudi Arabia
8.6.3 UAE
8.6.4 Egypt
8.6.5 Nigeria
8.6.6 South Africa
9 Image Processing SoC Chip Market Production by Region
9.1 Global Production of Image Processing SoC Chip by Region (2019-2025)
9.2 Global Image Processing SoC Chip Revenue Market Share by Region (2019-2025)
9.3 Global Image Processing SoC Chip Production, Revenue, Price and Gross Margin (2019-2025)
9.4 North America Image Processing SoC Chip Production
9.4.1 North America Image Processing SoC Chip Production Growth Rate (2019-2025)
9.4.2 North America Image Processing SoC Chip Production, Revenue, Price and Gross Margin (2019-2025)
9.5 Europe Image Processing SoC Chip Production
9.5.1 Europe Image Processing SoC Chip Production Growth Rate (2019-2025)
9.5.2 Europe Image Processing SoC Chip Production, Revenue, Price and Gross Margin (2019-2025)
9.6 Japan Image Processing SoC Chip Production (2019-2025)
9.6.1 Japan Image Processing SoC Chip Production Growth Rate (2019-2025)
9.6.2 Japan Image Processing SoC Chip Production, Revenue, Price and Gross Margin (2019-2025)
9.7 China Image Processing SoC Chip Production (2019-2025)
9.7.1 China Image Processing SoC Chip Production Growth Rate (2019-2025)
9.7.2 China Image Processing SoC Chip Production, Revenue, Price and Gross Margin (2019-2025)
10 Key Companies Profile
10.1 Kneron
10.1.1 Kneron Image Processing SoC Chip Basic Information
10.1.2 Kneron Image Processing SoC Chip Product Overview
10.1.3 Kneron Image Processing SoC Chip Product Market Performance
10.1.4 Kneron Business Overview
10.1.5 Kneron Image Processing SoC Chip SWOT Analysis
10.1.6 Kneron Recent Developments
10.2 Marvell
10.2.1 Marvell Image Processing SoC Chip Basic Information
10.2.2 Marvell Image Processing SoC Chip Product Overview
10.2.3 Marvell Image Processing SoC Chip Product Market Performance
10.2.4 Marvell Business Overview
10.2.5 Marvell Image Processing SoC Chip SWOT Analysis
10.2.6 Marvell Recent Developments
10.3 Imagination Technologies
10.3.1 Imagination Technologies Image Processing SoC Chip Basic Information
10.3.2 Imagination Technologies Image Processing SoC Chip Product Overview
10.3.3 Imagination Technologies Image Processing SoC Chip Product Market Performance
10.3.4 Imagination Technologies Image Processing SoC Chip SWOT Analysis
10.3.5 Imagination Technologies Business Overview
10.3.6 Imagination Technologies Recent Developments
10.4 Qualcomm
10.4.1 Qualcomm Image Processing SoC Chip Basic Information
10.4.2 Qualcomm Image Processing SoC Chip Product Overview
10.4.3 Qualcomm Image Processing SoC Chip Product Market Performance
10.4.4 Qualcomm Business Overview
10.4.5 Qualcomm Recent Developments
10.5 OMNIVISION
10.5.1 OMNIVISION Image Processing SoC Chip Basic Information
10.5.2 OMNIVISION Image Processing SoC Chip Product Overview
10.5.3 OMNIVISION Image Processing SoC Chip Product Market Performance
10.5.4 OMNIVISION Business Overview
10.5.5 OMNIVISION Recent Developments
10.6 AMD
10.6.1 AMD Image Processing SoC Chip Basic Information
10.6.2 AMD Image Processing SoC Chip Product Overview
10.6.3 AMD Image Processing SoC Chip Product Market Performance
10.6.4 AMD Business Overview
10.6.5 AMD Recent Developments
10.7 Ambarella
10.7.1 Ambarella Image Processing SoC Chip Basic Information
10.7.2 Ambarella Image Processing SoC Chip Product Overview
10.7.3 Ambarella Image Processing SoC Chip Product Market Performance
10.7.4 Ambarella Business Overview
10.7.5 Ambarella Recent Developments
10.8 NXP Semiconductors
10.8.1 NXP Semiconductors Image Processing SoC Chip Basic Information
10.8.2 NXP Semiconductors Image Processing SoC Chip Product Overview
10.8.3 NXP Semiconductors Image Processing SoC Chip Product Market Performance
10.8.4 NXP Semiconductors Business Overview
10.8.5 NXP Semiconductors Recent Developments
10.9 STMicroelectronics
10.9.1 STMicroelectronics Image Processing SoC Chip Basic Information
10.9.2 STMicroelectronics Image Processing SoC Chip Product Overview
10.9.3 STMicroelectronics Image Processing SoC Chip Product Market Performance
10.9.4 STMicroelectronics Business Overview
10.9.5 STMicroelectronics Recent Developments
10.10 Haisi Technology
10.10.1 Haisi Technology Image Processing SoC Chip Basic Information
10.10.2 Haisi Technology Image Processing SoC Chip Product Overview
10.10.3 Haisi Technology Image Processing SoC Chip Product Market Performance
10.10.4 Haisi Technology Business Overview
10.10.5 Haisi Technology Recent Developments
10.11 Verisilicon Microelectronics
10.11.1 Verisilicon Microelectronics Image Processing SoC Chip Basic Information
10.11.2 Verisilicon Microelectronics Image Processing SoC Chip Product Overview
10.11.3 Verisilicon Microelectronics Image Processing SoC Chip Product Market Performance
10.11.4 Verisilicon Microelectronics Business Overview
10.11.5 Verisilicon Microelectronics Recent Developments
10.12 Realtek
10.12.1 Realtek Image Processing SoC Chip Basic Information
10.12.2 Realtek Image Processing SoC Chip Product Overview
10.12.3 Realtek Image Processing SoC Chip Product Market Performance
10.12.4 Realtek Business Overview
10.12.5 Realtek Recent Developments
10.13 Foxlink
10.13.1 Foxlink Image Processing SoC Chip Basic Information
10.13.2 Foxlink Image Processing SoC Chip Product Overview
10.13.3 Foxlink Image Processing SoC Chip Product Market Performance
10.13.4 Foxlink Business Overview
10.13.5 Foxlink Recent Developments
10.14 Lianyun Technology
10.14.1 Lianyun Technology Image Processing SoC Chip Basic Information
10.14.2 Lianyun Technology Image Processing SoC Chip Product Overview
10.14.3 Lianyun Technology Image Processing SoC Chip Product Market Performance
10.14.4 Lianyun Technology Business Overview
10.14.5 Lianyun Technology Recent Developments
10.15 X Chip Microelectronics
10.15.1 X Chip Microelectronics Image Processing SoC Chip Basic Information
10.15.2 X Chip Microelectronics Image Processing SoC Chip Product Overview
10.15.3 X Chip Microelectronics Image Processing SoC Chip Product Market Performance
10.15.4 X Chip Microelectronics Business Overview
10.15.5 X Chip Microelectronics Recent Developments
10.16 Fullhan Microelectronics
10.16.1 Fullhan Microelectronics Image Processing SoC Chip Basic Information
10.16.2 Fullhan Microelectronics Image Processing SoC Chip Product Overview
10.16.3 Fullhan Microelectronics Image Processing SoC Chip Product Market Performance
10.16.4 Fullhan Microelectronics Business Overview
10.16.5 Fullhan Microelectronics Recent Developments
11 Image Processing SoC Chip Market Forecast by Region
11.1 Global Image Processing SoC Chip Market Size Forecast
11.2 Global Image Processing SoC Chip Market Forecast by Region
11.2.1 North America Market Size Forecast by Country
11.2.2 Europe Image Processing SoC Chip Market Size Forecast by Country
11.2.3 Asia Pacific Image Processing SoC Chip Market Size Forecast by Region
11.2.4 South America Image Processing SoC Chip Market Size Forecast by Country
11.2.5 Middle East and Africa Forecasted Consumption of Image Processing SoC Chip by Country
12 Forecast Market by Type and by Application (2025-2032)
12.1 Global Image Processing SoC Chip Market Forecast by Type (2025-2032)
12.1.1 Global Forecasted Sales of Image Processing SoC Chip by Type (2025-2032)
12.1.2 Global Image Processing SoC Chip Market Size Forecast by Type (2025-2032)
12.1.3 Global Forecasted Price of Image Processing SoC Chip by Type (2025-2032)
12.2 Global Image Processing SoC Chip Market Forecast by Application (2025-2032)
12.2.1 Global Image Processing SoC Chip Sales (K Units) Forecast by Application
12.2.2 Global Image Processing SoC Chip Market Size (M USD) Forecast by Application (2025-2032)
13 Conclusion and Key FindingsList of Tables
Table 1. Introduction of the Type
Table 2. Introduction of the Application
Table 3. Market Size (M USD) Segment Executive Summary
Table 4. Image Processing SoC Chip Market Size Comparison by Region (M USD)
Table 5. Global Image Processing SoC Chip Sales (K Units) by Manufacturers (2019-2025)
Table 6. Global Image Processing SoC Chip Sales Market Share by Manufacturers (2019-2025)
Table 7. Global Image Processing SoC Chip Revenue (M USD) by Manufacturers (2019-2025)
Table 8. Global Image Processing SoC Chip Revenue Share by Manufacturers (2019-2025)
Table 9. Company Type (Tier 1, Tier 2, and Tier 3) & (based on the Revenue in Image Processing SoC Chip as of 2022)
Table 10. Global Market Image Processing SoC Chip Average Price (USD/Unit) of Key Manufacturers (2019-2025)
Table 11. Manufacturers Image Processing SoC Chip Sales Sites and Area Served
Table 12. Manufacturers Image Processing SoC Chip Product Type
Table 13. Global Image Processing SoC Chip Manufacturers Market Concentration Ratio (CR5 and HHI)
Table 14. Mergers & Acquisitions, Expansion Plans
Table 15. Industry Chain Map of Image Processing SoC Chip
Table 16. Market Overview of Key Raw Materials
Table 17. Midstream Market Analysis
Table 18. Downstream Customer Analysis
Table 19. Key Development Trends
Table 20. Driving Factors
Table 21. Image Processing SoC Chip Market Challenges
Table 22. Global Image Processing SoC Chip Sales by Type (K Units)
Table 23. Global Image Processing SoC Chip Market Size by Type (M USD)
Table 24. Global Image Processing SoC Chip Sales (K Units) by Type (2019-2025)
Table 25. Global Image Processing SoC Chip Sales Market Share by Type (2019-2025)
Table 26. Global Image Processing SoC Chip Market Size (M USD) by Type (2019-2025)
Table 27. Global Image Processing SoC Chip Market Size Share by Type (2019-2025)
Table 28. Global Image Processing SoC Chip Price (USD/Unit) by Type (2019-2025)
Table 29. Global Image Processing SoC Chip Sales (K Units) by Application
Table 30. Global Image Processing SoC Chip Market Size by Application
Table 31. Global Image Processing SoC Chip Sales by Application (2019-2025) & (K Units)
Table 32. Global Image Processing SoC Chip Sales Market Share by Application (2019-2025)
Table 33. Global Image Processing SoC Chip Sales by Application (2019-2025) & (M USD)
Table 34. Global Image Processing SoC Chip Market Share by Application (2019-2025)
Table 35. Global Image Processing SoC Chip Sales Growth Rate by Application (2019-2025)
Table 36. Global Image Processing SoC Chip Sales by Region (2019-2025) & (K Units)
Table 37. Global Image Processing SoC Chip Sales Market Share by Region (2019-2025)
Table 38. North America Image Processing SoC Chip Sales by Country (2019-2025) & (K Units)
Table 39. Europe Image Processing SoC Chip Sales by Country (2019-2025) & (K Units)
Table 40. Asia Pacific Image Processing SoC Chip Sales by Region (2019-2025) & (K Units)
Table 41. South America Image Processing SoC Chip Sales by Country (2019-2025) & (K Units)
Table 42. Middle East and Africa Image Processing SoC Chip Sales by Region (2019-2025) & (K Units)
Table 43. Global Image Processing SoC Chip Production (K Units) by Region (2019-2025)
Table 44. Global Image Processing SoC Chip Revenue (US$ Million) by Region (2019-2025)
Table 45. Global Image Processing SoC Chip Revenue Market Share by Region (2019-2025)
Table 46. Global Image Processing SoC Chip Production (K Units), Revenue (US$ Million), Price (USD/Unit) and Gross Margin (2019-2025)
Table 47. North America Image Processing SoC Chip Production (K Units), Revenue (US$ Million), Price (USD/Unit) and Gross Margin (2019-2025)
Table 48. Europe Image Processing SoC Chip Production (K Units), Revenue (US$ Million), Price (USD/Unit) and Gross Margin (2019-2025)
Table 49. Japan Image Processing SoC Chip Production (K Units), Revenue (US$ Million), Price (USD/Unit) and Gross Margin (2019-2025)
Table 50. China Image Processing SoC Chip Production (K Units), Revenue (US$ Million), Price (USD/Unit) and Gross Margin (2019-2025)
Table 51. Kneron Image Processing SoC Chip Basic Information
Table 52. Kneron Image Processing SoC Chip Product Overview
Table 53. Kneron Image Processing SoC Chip Sales (K Units), Revenue (M USD), Price (USD/Unit) and Gross Margin (2019-2025)
Table 54. Kneron Business Overview
Table 55. Kneron Image Processing SoC Chip SWOT Analysis
Table 56. Kneron Recent Developments
Table 57. Marvell Image Processing SoC Chip Basic Information
Table 58. Marvell Image Processing SoC Chip Product Overview
Table 59. Marvell Image Processing SoC Chip Sales (K Units), Revenue (M USD), Price (USD/Unit) and Gross Margin (2019-2025)
Table 60. Marvell Business Overview
Table 61. Marvell Image Processing SoC Chip SWOT Analysis
Table 62. Marvell Recent Developments
Table 63. Imagination Technologies Image Processing SoC Chip Basic Information
Table 64. Imagination Technologies Image Processing SoC Chip Product Overview
Table 65. Imagination Technologies Image Processing SoC Chip Sales (K Units), Revenue (M USD), Price (USD/Unit) and Gross Margin (2019-2025)
Table 66. Imagination Technologies Image Processing SoC Chip SWOT Analysis
Table 67. Imagination Technologies Business Overview
Table 68. Imagination Technologies Recent Developments
Table 69. Qualcomm Image Processing SoC Chip Basic Information
Table 70. Qualcomm Image Processing SoC Chip Product Overview
Table 71. Qualcomm Image Processing SoC Chip Sales (K Units), Revenue (M USD), Price (USD/Unit) and Gross Margin (2019-2025)
Table 72. Qualcomm Business Overview
Table 73. Qualcomm Recent Developments
Table 74. OMNIVISION Image Processing SoC Chip Basic Information
Table 75. OMNIVISION Image Processing SoC Chip Product Overview
Table 76. OMNIVISION Image Processing SoC Chip Sales (K Units), Revenue (M USD), Price (USD/Unit) and Gross Margin (2019-2025)
Table 77. OMNIVISION Business Overview
Table 78. OMNIVISION Recent Developments
Table 79. AMD Image Processing SoC Chip Basic Information
Table 80. AMD Image Processing SoC Chip Product Overview
Table 81. AMD Image Processing SoC Chip Sales (K Units), Revenue (M USD), Price (USD/Unit) and Gross Margin (2019-2025)
Table 82. AMD Business Overview
Table 83. AMD Recent Developments
Table 84. Ambarella Image Processing SoC Chip Basic Information
Table 85. Ambarella Image Processing SoC Chip Product Overview
Table 86. Ambarella Image Processing SoC Chip Sales (K Units), Revenue (M USD), Price (USD/Unit) and Gross Margin (2019-2025)
Table 87. Ambarella Business Overview
Table 88. Ambarella Recent Developments
Table 89. NXP Semiconductors Image Processing SoC Chip Basic Information
Table 90. NXP Semiconductors Image Processing SoC Chip Product Overview
Table 91. NXP Semiconductors Image Processing SoC Chip Sales (K Units), Revenue (M USD), Price (USD/Unit) and Gross Margin (2019-2025)
Table 92. NXP Semiconductors Business Overview
Table 93. NXP Semiconductors Recent Developments
Table 94. STMicroelectronics Image Processing SoC Chip Basic Information
Table 95. STMicroelectronics Image Processing SoC Chip Product Overview
Table 96. STMicroelectronics Image Processing SoC Chip Sales (K Units), Revenue (M USD), Price (USD/Unit) and Gross Margin (2019-2025)
Table 97. STMicroelectronics Business Overview
Table 98. STMicroelectronics Recent Developments
Table 99. Haisi Technology Image Processing SoC Chip Basic Information
Table 100. Haisi Technology Image Processing SoC Chip Product Overview
Table 101. Haisi Technology Image Processing SoC Chip Sales (K Units), Revenue (M USD), Price (USD/Unit) and Gross Margin (2019-2025)
Table 102. Haisi Technology Business Overview
Table 103. Haisi Technology Recent Developments
Table 104. Verisilicon Microelectronics Image Processing SoC Chip Basic Information
Table 105. Verisilicon Microelectronics Image Processing SoC Chip Product Overview
Table 106. Verisilicon Microelectronics Image Processing SoC Chip Sales (K Units), Revenue (M USD), Price (USD/Unit) and Gross Margin (2019-2025)
Table 107. Verisilicon Microelectronics Business Overview
Table 108. Verisilicon Microelectronics Recent Developments
Table 109. Realtek Image Processing SoC Chip Basic Information
Table 110. Realtek Image Processing SoC Chip Product Overview
Table 111. Realtek Image Processing SoC Chip Sales (K Units), Revenue (M USD), Price (USD/Unit) and Gross Margin (2019-2025)
Table 112. Realtek Business Overview
Table 113. Realtek Recent Developments
Table 114. Foxlink Image Processing SoC Chip Basic Information
Table 115. Foxlink Image Processing SoC Chip Product Overview
Table 116. Foxlink Image Processing SoC Chip Sales (K Units), Revenue (M USD), Price (USD/Unit) and Gross Margin (2019-2025)
Table 117. Foxlink Business Overview
Table 118. Foxlink Recent Developments
Table 119. Lianyun Technology Image Processing SoC Chip Basic Information
Table 120. Lianyun Technology Image Processing SoC Chip Product Overview
Table 121. Lianyun Technology Image Processing SoC Chip Sales (K Units), Revenue (M USD), Price (USD/Unit) and Gross Margin (2019-2025)
Table 122. Lianyun Technology Business Overview
Table 123. Lianyun Technology Recent Developments
Table 124. X Chip Microelectronics Image Processing SoC Chip Basic Information
Table 125. X Chip Microelectronics Image Processing SoC Chip Product Overview
Table 126. X Chip Microelectronics Image Processing SoC Chip Sales (K Units), Revenue (M USD), Price (USD/Unit) and Gross Margin (2019-2025)
Table 127. X Chip Microelectronics Business Overview
Table 128. X Chip Microelectronics Recent Developments
Table 129. Fullhan Microelectronics Image Processing SoC Chip Basic Information
Table 130. Fullhan Microelectronics Image Processing SoC Chip Product Overview
Table 131. Fullhan Microelectronics Image Processing SoC Chip Sales (K Units), Revenue (M USD), Price (USD/Unit) and Gross Margin (2019-2025)
Table 132. Fullhan Microelectronics Business Overview
Table 133. Fullhan Microelectronics Recent Developments
Table 134. Global Image Processing SoC Chip Sales Forecast by Region (2025-2032) & (K Units)
Table 135. Global Image Processing SoC Chip Market Size Forecast by Region (2025-2032) & (M USD)
Table 136. North America Image Processing SoC Chip Sales Forecast by Country (2025-2032) & (K Units)
Table 137. North America Image Processing SoC Chip Market Size Forecast by Country (2025-2032) & (M USD)
Table 138. Europe Image Processing SoC Chip Sales Forecast by Country (2025-2032) & (K Units)
Table 139. Europe Image Processing SoC Chip Market Size Forecast by Country (2025-2032) & (M USD)
Table 140. Asia Pacific Image Processing SoC Chip Sales Forecast by Region (2025-2032) & (K Units)
Table 141. Asia Pacific Image Processing SoC Chip Market Size Forecast by Region (2025-2032) & (M USD)
Table 142. South America Image Processing SoC Chip Sales Forecast by Country (2025-2032) & (K Units)
Table 143. South America Image Processing SoC Chip Market Size Forecast by Country (2025-2032) & (M USD)
Table 144. Middle East and Africa Image Processing SoC Chip Consumption Forecast by Country (2025-2032) & (Units)
Table 145. Middle East and Africa Image Processing SoC Chip Market Size Forecast by Country (2025-2032) & (M USD)
Table 146. Global Image Processing SoC Chip Sales Forecast by Type (2025-2032) & (K Units)
Table 147. Global Image Processing SoC Chip Market Size Forecast by Type (2025-2032) & (M USD)
Table 148. Global Image Processing SoC Chip Price Forecast by Type (2025-2032) & (USD/Unit)
Table 149. Global Image Processing SoC Chip Sales (K Units) Forecast by Application (2025-2032)
Table 150. Global Image Processing SoC Chip Market Size Forecast by Application (2025-2032) & (M USD)
List of Figures
Figure 1. Product Picture of Image Processing SoC Chip
Figure 2. Data Triangulation
Figure 3. Key Caveats
Figure 4. Global Image Processing SoC Chip Market Size (M USD), 2019-2032
Figure 5. Global Image Processing SoC Chip Market Size (M USD) (2019-2032)
Figure 6. Global Image Processing SoC Chip Sales (K Units) & (2019-2032)
Figure 7. Evaluation Matrix of Segment Market Development Potential (Type)
Figure 8. Evaluation Matrix of Segment Market Development Potential (Application)
Figure 9. Evaluation Matrix of Regional Market Development Potential
Figure 10. Image Processing SoC Chip Market Size by Country (M USD)
Figure 11. Image Processing SoC Chip Sales Share by Manufacturers in 2023
Figure 12. Global Image Processing SoC Chip Revenue Share by Manufacturers in 2023
Figure 13. Image Processing SoC Chip Market Share by Company Type (Tier 1, Tier 2 and Tier 3): 2023
Figure 14. Global Market Image Processing SoC Chip Average Price (USD/Unit) of Key Manufacturers in 2023
Figure 15. The Global 5 and 10 Largest Players: Market Share by Image Processing SoC Chip Revenue in 2023
Figure 16. Evaluation Matrix of Segment Market Development Potential (Type)
Figure 17. Global Image Processing SoC Chip Market Share by Type
Figure 18. Sales Market Share of Image Processing SoC Chip by Type (2019-2025)
Figure 19. Sales Market Share of Image Processing SoC Chip by Type in 2023
Figure 20. Market Size Share of Image Processing SoC Chip by Type (2019-2025)
Figure 21. Market Size Market Share of Image Processing SoC Chip by Type in 2023
Figure 22. Evaluation Matrix of Segment Market Development Potential (Application)
Figure 23. Global Image Processing SoC Chip Market Share by Application
Figure 24. Global Image Processing SoC Chip Sales Market Share by Application (2019-2025)
Figure 25. Global Image Processing SoC Chip Sales Market Share by Application in 2023
Figure 26. Global Image Processing SoC Chip Market Share by Application (2019-2025)
Figure 27. Global Image Processing SoC Chip Market Share by Application in 2023
Figure 28. Global Image Processing SoC Chip Sales Growth Rate by Application (2019-2025)
Figure 29. Global Image Processing SoC Chip Sales Market Share by Region (2019-2025)
Figure 30. North America Image Processing SoC Chip Sales and Growth Rate (2019-2025) & (K Units)
Figure 31. North America Image Processing SoC Chip Sales Market Share by Country in 2023
Figure 32. U.S. Image Processing SoC Chip Sales and Growth Rate (2019-2025) & (K Units)
Figure 33. Canada Image Processing SoC Chip Sales (K Units) and Growth Rate (2019-2025)
Figure 34. Mexico Image Processing SoC Chip Sales (Units) and Growth Rate (2019-2025)
Figure 35. Europe Image Processing SoC Chip Sales and Growth Rate (2019-2025) & (K Units)
Figure 36. Europe Image Processing SoC Chip Sales Market Share by Country in 2023
Figure 37. Germany Image Processing SoC Chip Sales and Growth Rate (2019-2025) & (K Units)
Figure 38. France Image Processing SoC Chip Sales and Growth Rate (2019-2025) & (K Units)
Figure 39. U.K. Image Processing SoC Chip Sales and Growth Rate (2019-2025) & (K Units)
Figure 40. Italy Image Processing SoC Chip Sales and Growth Rate (2019-2025) & (K Units)
Figure 41. Russia Image Processing SoC Chip Sales and Growth Rate (2019-2025) & (K Units)
Figure 42. Asia Pacific Image Processing SoC Chip Sales and Growth Rate (K Units)
Figure 43. Asia Pacific Image Processing SoC Chip Sales Market Share by Region in 2023
Figure 44. China Image Processing SoC Chip Sales and Growth Rate (2019-2025) & (K Units)
Figure 45. Japan Image Processing SoC Chip Sales and Growth Rate (2019-2025) & (K Units)
Figure 46. South Korea Image Processing SoC Chip Sales and Growth Rate (2019-2025) & (K Units)
Figure 47. India Image Processing SoC Chip Sales and Growth Rate (2019-2025) & (K Units)
Figure 48. Southeast Asia Image Processing SoC Chip Sales and Growth Rate (2019-2025) & (K Units)
Figure 49. South America Image Processing SoC Chip Sales and Growth Rate (K Units)
Figure 50. South America Image Processing SoC Chip Sales Market Share by Country in 2023
Figure 51. Brazil Image Processing SoC Chip Sales and Growth Rate (2019-2025) & (K Units)
Figure 52. Argentina Image Processing SoC Chip Sales and Growth Rate (2019-2025) & (K Units)
Figure 53. Columbia Image Processing SoC Chip Sales and Growth Rate (2019-2025) & (K Units)
Figure 54. Middle East and Africa Image Processing SoC Chip Sales and Growth Rate (K Units)
Figure 55. Middle East and Africa Image Processing SoC Chip Sales Market Share by Region in 2023
Figure 56. Saudi Arabia Image Processing SoC Chip Sales and Growth Rate (2019-2025) & (K Units)
Figure 57. UAE Image Processing SoC Chip Sales and Growth Rate (2019-2025) & (K Units)
Figure 58. Egypt Image Processing SoC Chip Sales and Growth Rate (2019-2025) & (K Units)
Figure 59. Nigeria Image Processing SoC Chip Sales and Growth Rate (2019-2025) & (K Units)
Figure 60. South Africa Image Processing SoC Chip Sales and Growth Rate (2019-2025) & (K Units)
Figure 61. Global Image Processing SoC Chip Production Market Share by Region (2019-2025)
Figure 62. North America Image Processing SoC Chip Production (K Units) Growth Rate (2019-2025)
Figure 63. Europe Image Processing SoC Chip Production (K Units) Growth Rate (2019-2025)
Figure 64. Japan Image Processing SoC Chip Production (K Units) Growth Rate (2019-2025)
Figure 65. China Image Processing SoC Chip Production (K Units) Growth Rate (2019-2025)
Figure 66. Global Image Processing SoC Chip Sales Forecast by Volume (2019-2032) & (K Units)
Figure 67. Global Image Processing SoC Chip Market Size Forecast by Value (2019-2032) & (M USD)
Figure 68. Global Image Processing SoC Chip Sales Market Share Forecast by Type (2025-2032)
Figure 69. Global Image Processing SoC Chip Market Share Forecast by Type (2025-2032)
Figure 70. Global Image Processing SoC Chip Sales Forecast by Application (2025-2032)
Figure 71. Global Image Processing SoC Chip Market Share Forecast by Application (2025-2032)