SEMICONDUCTOR INSIGHT
MARKET RESEARCH REPORT

IGZO Display Panel Market

2026 to 2034
MARKET INTELLIGENCE
ACROSS KEY REGIONS
2026 EDITION
DISPLAY AND VISUALIZATION Semiconductor Market Research

IGZO Display Panel Market

Size, Emerging Trends, Technological Advancements, and Business Strategies 2026-2034

◷
UPDATED 08 September 2026
▤
REPORT LENGTH Detailed Report
▣
REPORT CODE 2221c5737b28
▯
FORMATS PDF

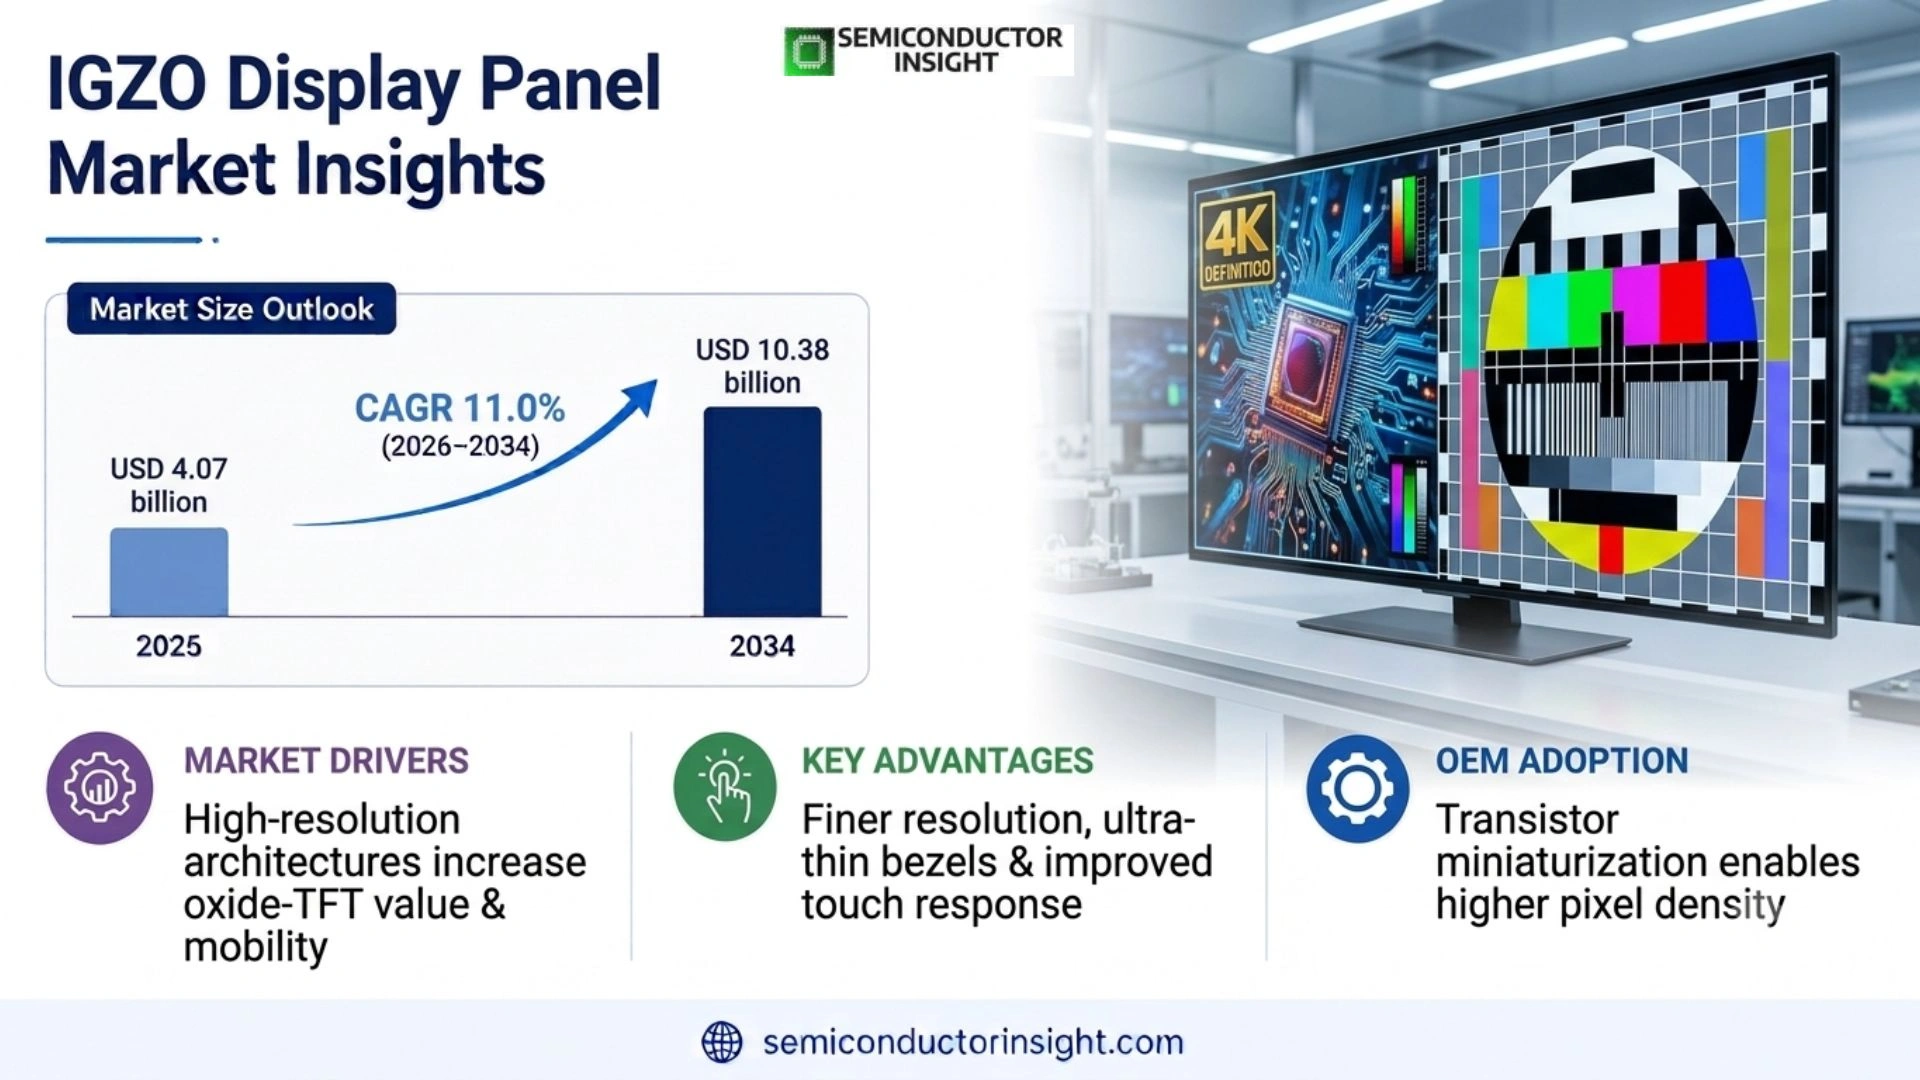
IGZO display panel market is projected to grow  USD 10.38 billion by 2034, registering a CAGR of 11.0% during 2026–2034

Get the sample PDF with study scope, segmentation and methodology details.

Key Statistics

2025 Market Size
USD 4.07 billion
2034 Projected Size
USD 10.38 billion
CAGR (2026–2034)
11.0%
Largest Market in 2025
Asia Pacific – >65% production and consumption (2024)

Key Takeaways

  • Market scale reaches USD 4.07 billion in 2025 and USD 10.38 billion by 2034 at a CAGR of 11.0% during 2026–2034; 9.7–20 inch panels remain the leading size category, supported by tablets, notebooks, monitors and other medium-format devices that need high pixel density without excessive power consumption.
  • Tablets are the leading application in the defined scope, while smartphones, monitors and specialized X-ray detectors extend demand into premium and medical use cases.
  • Crystalline IGZO is the higher-performance technology direction, while amorphous IGZO offers a scalable path for broad oxide-TFT manufacturing across display architectures.
  • Asia Pacific is the dominant production and consumption center, with the report page indicating more than 65% of production and consumption in the region.
  • Resolution, power efficiency and transistor scaling are the central demand mechanisms, while yield, material complexity and competing display architectures constrain expansion.

IGZO Display Panel Market Overview

IGZO display panel market is projected to grow from USD 4.07 billion in 2025 to USD 10.38 billion by 2034, registering a CAGR of 11.0% during 2026–2034. Asia Pacific is the largest production and consumption center, while demand is expanding across tablets, smartphones, monitors, televisions and medical imaging. IGZO display panel market covers the report-defined size, application, technology and end-user segments.

Base year: 2025 · Forecast period: 2026–2034 · Historical period: 2020–2024 · Values in USD

An IGZO display panel uses an indium-gallium-zinc-oxide thin-film transistor backplane to control pixels in a flat-panel display. The material system is attractive where higher carrier mobility supports tighter transistor geometry, high pixel density and lower power operation. Sharp describes electron mobility around 20–50 times that of conventional amorphous silicon, linking the technology directly to transistor miniaturization and efficient display driving.

IGZO can support more than one display architecture. It is used in LCD and OLED backplanes and can also serve specialized flat-panel X-ray detectors. Canon lists a 430 × 430 mm detector using IGZO TFTs with 3,072 × 3,072 pixels and a 140 μm pitch for fluoroscopy and radiography, demonstrating a technically demanding application in which the backplane’s electrical and spatial characteristics become part of the imaging system’s performance.

Demand is changing as end products require higher resolution, brighter imagery, thinner bezels, faster refresh and lower energy use. Sharp’s 2025 AQUOS R10, for example, combines a Pro IGZO OLED display with 3,000-nit peak brightness and variable 1–240 Hz driving. The commercial implication is that oxide-TFT engineering remains relevant to premium mobile differentiation even as the industry adds OLED and larger-format products.

Segment Analysis: By Type

The report-defined panel-size segmentation comprises Under 9.7 inches, 9.7–20 inches, 20–30 inches and Above 32 inches. The 9.7–20 inch range leads the scope, supported by tablets and computing displays, while larger formats represent an expansion area where high-resolution oxide backplanes can support professional and large-area products. This mix gives suppliers a portfolio challenge: smaller panels emphasize density and power, mid-sized panels reward balanced cost and performance, and large panels increase the importance of yield and substrate utilization. The commercial opportunity therefore varies materially by geometry.

Panel Size Primary demand role Market position and commercial logic
Under 9.7 inches Compact portable and specialty displays Demand is shaped by tight device envelopes, high pixel density and battery constraints. Customers value transistor performance, efficient drive behavior and reliable integration into compact modules. Competitive differentiation is strongest where the panel can combine low power with high touch sensitivity or fine pixel pitch.
9.7–20 inches Tablets, notebooks and monitors Largest defined size segment. It benefits from the widest overlap of portability and productivity, giving OEMs reasons to value high resolution, efficient pixel control and display longevity. Suppliers compete on yield, uniformity, refresh behavior and multi-generation supply commitments.
20–30 inches Professional monitors and industrial visualization This range increasingly rewards image quality and information density. Suppliers face higher glass-utilization and yield sensitivity than in small displays, so commercial performance depends on process stability as much as electrical mobility. The segment is suitable for premium monitors, professional visualization and selected control systems.
Above 32 inches Large monitors, TVs and emerging applications A developing opportunity where large-area uniformity and yield become decisive. Oxide-TFT capability can support high-resolution large screens, but adoption depends on total panel economics, factory yield and competition from other mature backplane architectures.

Technology architecture: amorphous versus crystalline IGZO

The technology axis distinguishes amorphous IGZO and crystalline IGZO. Amorphous oxide structures offer a practical manufacturing route, while crystalline forms can support higher-performance transistor behavior. JST documents an IGZO TFT patent portfolio covering single-crystal, polycrystalline, microcrystalline and amorphous thin-film structures across multiple jurisdictions, making process know-how and intellectual-property access relevant alongside equipment and materials.

Segment Analysis: By Application

The application scope includes Tablets, Monitor, Notebook, Smartphone, TV, IGZO X-Ray Detectors and Others. Tablets lead in the source segmentation, while smartphones and medical imaging provide differentiated value pools where low-power operation, brightness, pixel density and detector performance can support higher-value adoption. The different applications also create different qualification economics, with consumer programs emphasizing launch timing and cost while medical and industrial programs emphasize reliability, documentation and lifecycle support. That changes which supplier capabilities matter most.

Application Demand characteristics
Tablets The purchase trigger is the combination of high pixel density, low power and long viewing time. IGZO can support efficient static-image operation while maintaining a thin panel architecture. OEM qualification therefore focuses on display uniformity, response, touch performance and long-term availability rather than simply the lowest panel cost.
Monitor Monitor buyers increasingly combine resolution, refresh behavior, brightness and energy performance. IGZO is attractive where transistor performance supports dense pixels, but supplier selection still compares OLED, other oxide TFT and silicon-based architectures. Larger panel economics make yield, glass utilization and factory consistency important commercial decision variables.
Notebook Notebook programs are highly sensitive to battery life, thickness and high-resolution image quality. IGZO’s efficient static-image behavior can help reduce display energy, while high mobility supports dense circuits. OEMs also require stable supply, consistent calibration and long qualification windows, giving established process capability an strength.
Smartphone Premium handset programs use display brightness, refresh rate and power as direct product features. Sharp’s AQUOS R10 demonstrates this with a Pro IGZO OLED display rated to 3,000 nits and variable 1–240 Hz driving. The commercial trigger is visible user experience, so backplane innovation can support premium device positioning.
TV Large-screen programs emphasize uniformity, yield and total cost more strongly than small mobile applications. IGZO can support high-resolution large displays, but adoption is constrained where alternative backplanes already have large installed production ecosystems. The winning proposition is therefore a measurable combination of resolution, power and manufacturability.
IGZO X-Ray Detectors Medical imaging purchasing is driven by detector performance, image quality, spatial resolution and system qualification. Canon’s 430 × 430 mm IGZO detector uses 3,072 × 3,072 pixels at a 140 μm pitch for fluoroscopy and radiography. This creates a specialized, qualification-heavy demand stream distinct from consumer display economics.
Others Industrial, automotive, scientific and specialty displays can use IGZO where reliability, compact electronics and efficient pixel control solve a defined system problem. Volumes are typically lower than mass consumer applications, but qualification and lifecycle support can produce longer customer relationships and higher value per program.

IGZO Display Panel Market Prizing

Regional Analysis

Asia Pacific leads the IGZO display panel market and the report scope indicates more than 65% of production and consumption in the region. North America is application-led, Europe is weighted toward automotive and industrial qualification, South America relies on imported devices, and Middle East & Africa demand is concentrated in healthcare, infrastructure and premium electronics.

How do regional demand patterns differ across the IGZO display panel market?

Regional demand follows panel fabrication, device assembly and application specialization rather than geography alone. Asia Pacific combines display fabs with downstream electronics production, creating the deepest process and customer ecosystem. North America supports high-value medical and computing programs, Europe emphasizes reliability and lifecycle support, while South America and Middle East & Africa depend more heavily on imported panels and finished equipment.

Region Position Growth outlook Demand profile Supplier selection
Asia Pacific Largest Highest deployment intensity Panel fabrication and consumer electronics Yield, qualification, local capacity and cost determine awards.
North America Major application center Selective growth Medical imaging, computing and premium devices Performance documentation, regulatory qualification and service are critical.
Europe Established Steady specialist growth Automotive, industrial and healthcare Reliability, traceability and lifecycle support drive supplier selection.
South America Smaller Moderate Imported consumer and industrial Landed cost, distribution and replacement support determine reach.
Middle East & Africa Smallest Niche growth Healthcare, infrastructure and premium electronics Project qualification, availability and service responsiveness dominate.

Detailed Regional Blocks

Asia Pacific LARGEST & FASTEST-GROWING

Why does Asia Pacific lead the IGZO display panel market?

Asia Pacific leads through the close integration of display fabs, panel makers, electronics assemblers and consumer-device OEMs. The strength is structural: process improvements can move rapidly from materials and TFT fabrication into commercial modules and finished products. The region therefore captures both manufacturing value and downstream demand, creating a stronger commercial ecosystem than regions where panels are primarily imported.

Market positionLargest regional center
Growth outlookHighest deployment intensity
Demand profileManufacturing plus device demand
Market access gateOEM qualification and process yield
Country Position in region What drives demand
China Largest production ecosystem Display fabs, panel assembly and consumer-electronics manufacturing support broad demand across tablets, monitors, televisions and smartphones, while local supply improves response times and cost control.
Japan Technology and premium-device hub Advanced display engineering and premium products support higher-value IGZO use, with Sharp providing a visible commercial pathway from oxide-TFT technology to finished mobile devices.
South Korea Major advanced display base Large-scale panel engineering and OLED manufacturing support oxide-TFT adoption where mobility, efficiency and high-resolution backplanes improve product performance.

Market instances

  • May 29, 2025 – Sharp announced the AQUOS R10 with a Pro IGZO OLED display, 3,000-nit peak brightness and variable 1–240 Hz driving. The development matters as premium handset makers continue to turn display engineering into product differentiation, supporting demand for advanced oxide-TFT capability. Sharp announcement.
  • JST documents IGZO TFT patents across Japan, Korea, Taiwan, Europe, the United States and China, covering multiple thin-film forms. The commercial implication is that process access and intellectual-property management remain relevant to advanced oxide-TFT programs, especially for suppliers expanding across several production jurisdictions. JST technology and licensing record.
  • Sharp states that IGZO mobility can reach 20–50 times that of conventional amorphous silicon and that still-image power can fall to one-fifth or one-tenth of conventional screens. These attributes create a direct commercial case in tablets, notebooks and premium mobile displays where battery life and resolution are visible customer requirements. Sharp IGZO technology.

Full-report note: Asia Pacific is the principal manufacturing and consumption cluster, so suppliers need local engineering, fast qualification, strong yield control and reliable supply rather than only a low-cost panel offer. For suppliers, the commercial implication is to align product positioning with measurable display performance, qualification requirements and the lifecycle expectations of the target application rather than treating the technology as a uniform commodity across every panel category.

North America APPLICATION-LED MARKET

What drives IGZO display panel demand in North America?

North American demand is more application-led than fabrication-led, with medical imaging, computing, professional visualization and premium devices creating value. Buyers usually place high weight on performance documentation, product availability and integration support. That shifts competition toward application engineering and qualification rather than pure substrate scale, giving technically differentiated suppliers opportunities in specialized display programs.

Market positionMajor application center
Growth outlookSelective growth
Demand profileMedical, computing and specialty display
Market access gateQualification and compliance
Country Position in region What drives demand
United States Largest demand base Healthcare imaging, computing systems and premium electronics create diverse demand where performance specifications and system qualification influence purchases.
Canada Specialized demand Healthcare and industrial applications reward reliability and long support windows, creating a smaller but technically demanding market.
Mexico Electronics manufacturing base Assembly and manufacturing activity creates downstream demand for qualified panels incorporated into systems shipped throughout North America.

Market instances

  • Canon lists an IGZO TFT detector with a 430 × 430 mm field, 3,072 × 3,072 pixels and 140 μm pitch for fluoroscopy and radiography. The product demonstrates that IGZO demand can come from medical equipment where spatial resolution and detector performance matter more than commodity panel pricing. Canon detector portfolio.
  • Sharp’s IGZO documentation ties higher mobility to transistor miniaturization and higher resolution at comparable transmittance. For North American OEMs, the value is a measurable system benefit in devices that have tight power or pixel-density requirements, although product qualification still depends on lifetime, uniformity and integration. Sharp IGZO documentation.
  • Sharp’s display business notes commercial mass production of IGZO LCDs since 2012. The long production history provides a base of practical manufacturing experience, while newer applications still require separate qualification for brightness, size, refresh behavior and system interfaces. Sharp display business.

Full-report note: North America is strongest where IGZO solves a specific application requirement. Suppliers should target medical, professional visualization and premium devices with strong documentation and application engineering. For suppliers, the commercial implication is to align product positioning with measurable display performance, qualification requirements and the lifecycle expectations of the target application rather than treating the technology as a uniform commodity across every panel category.

Europe AUTOMOTIVE & INDUSTRIAL QUALITY-LED

What characterises European IGZO display panel demand?

Europe’s demand is shaped by automotive, industrial, premium electronics and healthcare applications in which reliability, traceability and lifecycle support matter. Qualification can be longer than in consumer programs, but once a display platform is embedded, the customer relationship can be durable. Suppliers therefore compete on process consistency and long-term support as well as brightness and resolution.

Market positionEstablished specialist market
Growth outlookSteady
Demand profileAutomotive, industrial and healthcare
Market access gateReliability and qualification
Country Position in region What drives demand
Germany Automotive and industrial hub Vehicle cockpit displays and factory equipment require reliable high-resolution panels, stable product revisions and support through long production programs.
France Healthcare and transport applications Medical systems and transport equipment create specialized demand where technical documentation and service continuity carry material weight.
Netherlands High-tech systems ecosystem Advanced industrial and electronics applications use displays inside complex equipment, increasing the importance of compatibility, reliability and lifecycle support.

Market instances

  • JST’s IGZO patent portfolio includes European jurisdictions alongside Asia and the United States, showing that the technology has a multinational commercialization footprint. For European suppliers, access to established technology rights and repeatable processing is relevant when integrating oxide-TFT structures into regulated or long-lived equipment. JST record.
  • Sharp links IGZO mobility with transistor miniaturization, higher resolution and efficient operation. In automotive and industrial interfaces, these attributes can support dense information presentation in constrained spaces, while commercial adoption depends on temperature behavior, reliability and stable sourcing across long program cycles. Sharp technical source.
  • Canon’s IGZO detector configuration demonstrates use in fluoroscopy and radiography, broadening the technology’s role beyond entertainment and personal electronics. The European implication is a wider application set for suppliers able to provide documented optical, electrical and reliability performance. Canon FPD source.

Full-report note: Europe rewards qualified, application-specific display solutions. Competitive success depends on reliability and lifecycle support rather than commodity panel volume alone. For suppliers, the commercial implication is to align product positioning with measurable display performance, qualification requirements and the lifecycle expectations of the target application rather than treating the technology as a uniform commodity across every panel category.

South America IMPORT-DEPENDENT OPPORTUNITY

What shapes the South America IGZO display panel market?

South America relies more heavily on imported panels and finished devices, so distribution, landed cost and replacement availability become central to market access. Consumer electronics provide the broader volume opportunity, while healthcare and industrial equipment can support higher-value demand where display performance justifies imported technology. Suppliers can improve economics through regional stocking and strong distributor relationships.

Market positionSmaller regional base
Growth outlookModerate
Demand profileImported consumer and industrial
Market access gateLanded cost and channels
Country Position in region What drives demand
Brazil Largest addressable base Consumer electronics, healthcare and industrial applications provide the broadest demand base, with imported panels feeding local assembly and equipment channels.
Argentina Selective premium market Professional displays and imported electronics create demand that is strongly influenced by distributor inventory and replacement availability.
Chile Industrial and healthcare niche Mining, infrastructure and medical systems can create higher-value display demand despite smaller total panel volumes.

Market instances

  • Sharp’s 2025 AQUOS R10 illustrates the premium-device route, combining a 3,000-nit Pro IGZO OLED display with 1–240 Hz variable driving. For imported markets, visible display features can support premium ASPs when distributors can keep qualified devices available despite logistics costs. Sharp launch.
  • Canon’s IGZO medical detector shows a specialized route into healthcare equipment, where image quality and detector performance create a stronger purchasing case than consumer-style feature comparison. South American integrators can therefore create value by targeting qualified medical programs rather than relying only on mass-market retail channels. Canon medical imaging source.
  • Sharp describes IGZO as an oxide-semiconductor platform for high-performance displays, with commercial applications spanning multiple device categories. In import-dependent markets this broad application range allows distributors to spread inventory and service investments across consumer, professional and industrial customers rather than depending on one product class. Sharp business source.

Full-report note: South America is best approached through channels and specialized applications. Inventory continuity, technical support and landed economics are the practical levers for growth. For suppliers, the commercial implication is to align product positioning with measurable display performance, qualification requirements and the lifecycle expectations of the target application rather than treating the technology as a uniform commodity across every panel category.

Middle East & Africa PROJECT & HEALTHCARE-LED

Which Middle East and African applications create opportunities for IGZO panels?

The region is smaller but attractive in projects requiring premium visualization, medical imaging and high-performance electronics. Procurement is often routed through system integrators, so qualification, delivery reliability and service access matter. The addressable opportunity is stronger for specialized equipment than for broad panel manufacturing, creating a market where supplier responsiveness can matter as much as manufacturing scale.

Market positionSmallest regional base
Growth outlookNiche expansion
Demand profileHealthcare and infrastructure projects
Market access gateProject qualification and service
Country Position in region What drives demand
Saudi Arabia Project-led premium demand Healthcare, infrastructure and industrial programs require specified display systems, commonly procured through integrators and distributors.
United Arab Emirates High-value commercial applications Transport, hospitality, smart-building and healthcare projects can support premium display demand when brightness, resolution and service are important.
South Africa Healthcare and industrial base Medical imaging and industrial systems create recurring demand alongside consumer electronics distribution.

Market instances

  • Canon’s IGZO detector portfolio includes a model for fluoroscopy and radiography with 430 × 430 mm imaging area and 3,072 × 3,072 pixels. This creates a practical healthcare use case for regional projects where detector performance and system integration are central procurement criteria. Canon detector source.
  • Sharp’s IGZO technology emphasizes lower still-image power and higher resolution, which can support information displays and control systems that remain active for long periods. In Middle Eastern projects, the commercial benefit can extend to power-sensitive visualization environments where display readability and energy use affect operating cost. Sharp technology source.
  • JST documents a licensing and patent framework for IGZO TFT technology covering major Asian, European and North American markets. For project-led regions, this reinforces the importance of traceability and approved technology supply when a system integrator specifies a particular oxide-TFT platform. JST licensing source.

Full-report note: The opportunity is selective and project driven. Suppliers should target healthcare, infrastructure and premium electronics through strong regional integrators and service networks. For suppliers, the commercial implication is to align product positioning with measurable display performance, qualification requirements and the lifecycle expectations of the target application rather than treating the technology as a uniform commodity across every panel category.

Competitive Landscape

Competition is shaped by display-fabrication scale, oxide-TFT process capability, OEM qualification, panel yield and application specialization. Large panel makers benefit from equipment scale and broad customer relationships, while differentiated suppliers can compete through premium smartphones, OLED backplanes, professional monitors and medical imaging. The practical commercial test is consistent electrical performance, uniformity, yield and reliable multi-generation supply.

Large panel manufacturers have an strength when customers need high-volume supply, as substrate utilization and factory scale spread fixed costs across more panels. However, scale does not remove the need for process-specific qualification. A supplier can win a specialized program through better brightness, resolution, detector performance or lower power even when its overall panel capacity is smaller.

Qualification is especially important in medical, automotive and industrial applications. Once a display is embedded into a validated product, changing the panel can require optical, mechanical, electrical and software checks. This raises switching costs and rewards suppliers that maintain process stability, long product-life support and documentation discipline rather than competing only on annual panel pricing.

Technology roadmaps also define competitive strength. IGZO competes with amorphous silicon, low-temperature polysilicon, other oxide backplanes and OLED architectures. Suppliers that can move customers toward higher resolution, lower power and larger formats without forcing a complete platform redesign have a stronger opportunity to retain programs as device requirements evolve. Roadmap credibility matters as customers plan several device generations, since a panel supplier must show that today’s process can evolve toward higher resolution, brighter output and improved efficiency without creating an abrupt qualification reset. This favors suppliers with sustained process-development investment.

Key Industry Players

  • Sharp Corporation
  • Samsung Display Co., Ltd.
  • LG Display Co., Ltd.
  • BOE Technology Group Co., Ltd.
  • TCL China Star Optoelectronics Technology (CSOT)
  • AU Optronics Corp. (AUO)
  • CPT Technology (Chunghwa Picture Tubes, Ltd.)

Tier structure

Competitive tier Participants How competition is won
Integrated display manufacturers Large panel makers Customers prioritize capacity, yield, multi-size capability and long-term supply. Competitive strength comes from process control, factory utilization, technology roadmaps and customer qualification across several end-device programs.
Technology-led premium suppliers Specialized display innovators Value is created through differentiated brightness, low-power behavior, refresh capability, sensing or advanced oxide-TFT structures. These suppliers rely on application proof and premium-device integration rather than scale alone.
Specialty application suppliers Medical and industrial ecosystem participants Competition is qualification-driven. Reliability, detector or industrial specifications, long lifecycle support and system integration determine awards, with lower switching frequency after platform approval.

IGZO Display Panel Production Capacity Analysis

Production capacity is concentrated in Asia Pacific, where display fabs, oxide-TFT engineering and downstream module assembly are closely connected. Effective capacity depends on substrate utilization, deposition uniformity, defect control, inspection and yield rather than installed glass area alone. Larger displays amplify yield sensitivity, making process discipline a primary commercial constraint.

Large-area oxide-TFT lines create a scaling challenge: every defect on a larger substrate has the potential to reduce the number of saleable panels or require repair. Suppliers therefore focus on deposition uniformity, lithography alignment, inspection and process windows. Capacity expansion is commercially useful only when incremental output maintains the yield and reliability demanded by OEM qualification.

Upstream inputs also constrain output. Oxide targets, specialty gases, glass substrates, photoresist, cleaning chemicals and precision equipment must arrive at consistent quality. A change in material formulation can alter electrical behavior or yield, creating qualification work that slows substitution. This makes dual sourcing and approved-vendor management important for maintaining effective rather than nominal capacity.

The geography of panel production reduces some logistics friction but increases regional concentration risk. When a large share of fabrication and assembly sits in one region, disruptions in power, equipment, shipping or supplier availability can propagate through several product categories. Commercial resilience therefore increasingly depends on regional inventory, alternate materials and qualified production routes.

IGZO Display Panel Market Dynamics: Drivers, Restraints and Opportunities

Market growth is the result of rising display performance requirements meeting the economics of oxide-TFT manufacturing. Demand strengthens where higher resolution, lower energy use or specialized detector performance produce a visible system benefit. Restraints are strongest where alternative backplanes already achieve adequate performance at lower cost or where manufacturing complexity reduces effective yield.

MARKET DRIVERS

Drivers Impact Analysis*

Driver Directional impact Commercial implication
High-resolution mobile and computing displays High Higher pixel density increases the value of high-mobility TFT structures and supports premium panel differentiation.
Lower display power consumption High Battery-sensitive products benefit from efficient pixel driving and reduced static-image refresh activity.
Medical imaging applications Medium IGZO detector architectures widen the market beyond consumer displays by addressing resolution and imaging requirements.
Large-format oxide-TFT adoption Medium New monitor and large-screen programs create additional addressable demand if yield and cost can remain competitive.

High-resolution architectures increase oxide-TFT value

Sharp links higher mobility with transistor miniaturization and higher resolution. This allows display designers to pack more pixels into a given area without proportionally expanding transistor footprint. Suppliers gain commercially when that technical strength becomes a product feature such as finer resolution, thinner bezels or improved touch response, giving OEMs a reason to qualify oxide-TFT technology rather than selecting purely on panel price.

Power efficiency supports portable devices

Sharp reports that IGZO can reduce still-image display power to one-fifth or one-tenth of conventional screens by limiting unnecessary rewriting. For tablets and notebooks, that creates a system-level battery benefit. The supplier response is to combine efficient backplanes with high-resolution products, while OEMs can use lower display energy to protect battery-life targets without reducing panel size.

Medical imaging broadens the market

Canon’s IGZO detector example provides a direct commercial bridge into medical imaging. A 430 × 430 mm detector with 3,072 × 3,072 pixels and 140 μm pitch must meet requirements that differ sharply from consumer displays. The market opportunity therefore depends on specialized qualification, detector performance and system integration, allowing suppliers with proven engineering capability to access a higher-value niche.

Premium smartphones keep oxide-TFT differentiation visible

Sharp’s AQUOS R10 pairs a Pro IGZO OLED display with 3,000-nit peak brightness and 1–240 Hz variable driving. The product demonstrates how backplane capability can remain visible in premium device specifications. This creates a commercial incentive for continued IGZO process development even as OLED becomes increasingly dominant in selected smartphone tiers.

MARKET RESTRAINTS

Restraints Impact Analysis*

Restraint Directional impact Commercial implication
Manufacturing complexity and yield Medium Higher defect sensitivity can offset the performance value of oxide-TFT technology, especially on large substrates.
Competition from OLED and other TFT architectures High Customers have several mature backplane choices, so IGZO must deliver a clear system benefit.
Specialized material and process dependencies Medium Vendor changes can require requalification and disrupt stable production recipes.
Long qualification periods Medium Automotive and medical programs delay adoption but can also strengthen incumbency after approval.

Yield economics can offset mobility strengths

High electron mobility is valuable only when the manufacturing process converts it into consistent saleable panels. Defectivity, deposition variation and substrate-scale uniformity can raise effective cost. Suppliers therefore compete through process-control and inspection capability as much as through materials engineering. Customers compare finished-panel yield and reliability, not the mobility figure in isolation, so stable factory performance remains a major restraint on technology expansion.

Alternative display architectures intensify substitution

OLED, low-temperature polysilicon, amorphous silicon and other oxide technologies compete for the same device programs. A customer can accept a different backplane if it meets required brightness, resolution, response and power at a lower system cost. IGZO suppliers therefore need application-specific proof rather than generic technology claims, particularly where incumbent manufacturing infrastructure already has high utilization.

Specialized inputs raise switching friction

JST’s patent documentation shows that IGZO commercialization includes defined thin-film structures and a large body of technology rights. In production, alternative materials or process suppliers can require qualification when electrical characteristics change. This friction protects proven suppliers but also increases the time and engineering resources required to expand capacity or introduce new vendor combinations.

Qualification cycles slow new-program adoption

Medical and automotive displays can remain in production for several years, so a new panel technology must demonstrate stability over temperature, lifetime and electrical conditions before adoption. This reduces short-term switching but makes customer acquisition expensive. Suppliers with engineering resources, reference designs and long-term support are better positioned to absorb the qualification burden.

MARKET OPPORTUNITIES

Premium mobile and computing products

Where: smartphones, tablets and notebooks. Who benefits: panel suppliers with high-resolution oxide-TFT capability. What changes: customers want brighter, denser and more power-efficient displays with high refresh flexibility. Commercial implication: suppliers can protect premium pricing when IGZO performance is tied to battery life, readability and responsiveness rather than presented as an invisible process improvement.

Medical and industrial imaging

Where: radiography, fluoroscopy and industrial inspection. Who benefits: suppliers with validated IGZO detector architectures. What changes: more demanding pixel resolution and detector performance increase the value of stable oxide backplanes. Commercial implication: once a detector is embedded in a qualified platform, lifecycle support and reliability can create durable customer relationships and reduce switching frequency.

Large high-resolution displays

Where: professional monitors, industrial visualization and selected large screens. Who benefits: manufacturers with strong large-area yield control. What changes: higher pixel counts and larger substrates increase the benefit of transistor mobility but also amplify defect economics. Commercial implication: suppliers can expand addressable demand when they pair oxide-TFT performance with credible large-area manufacturing economics.

Regionalized display manufacturing

Where: Asia Pacific and markets seeking stronger electronics localization. Who benefits: display makers, materials suppliers and equipment vendors with local support. What changes: customers place greater value on supply resilience and shorter technical response times. Commercial implication: local inventory, multiple qualified sources and application engineering can become as important as panel technology when winning new programs.

IGZO Display Panel Supply Chain Analysis

1. Materials
Oxide targets, glass, gases, photoresist and process chemicals establish the electrical and optical foundation for the backplane.
2. TFT fabrication
Deposition, lithography, etch, anneal, inspection and repair convert materials into functional oxide transistor arrays.
3. Panel and module
LCD/OLED stack integration, color filters, drivers, bonding and encapsulation turn backplanes into saleable display modules.
4. OEM integration
Smartphones, tablets, monitors, televisions and imaging systems integrate modules into finished products and validated platforms.

Materials capture value through purity, formulation and repeatability. A small change in composition or substrate behavior can alter electrical properties and yield, so qualified suppliers often remain embedded for long periods. Upstream bottlenecks can therefore influence downstream capacity even when panel demand is strong, making vendor qualification and regional inventory important parts of the commercial model.

TFT fabrication captures the greatest process value as yield and electrical uniformity determine whether a substrate becomes saleable output. Deposition, lithography, anneal and inspection equipment must be tightly coordinated, especially as pixel density rises. Suppliers with process-control expertise can improve effective capacity without adding an entire new line, which can produce stronger economics than capacity expansion alone.

Panel and module assembly adds optical and electrical integration value. Drivers, bonding, calibration and encapsulation influence final image quality and reliability, while module suppliers must coordinate with OEM mechanical and software specifications. Bottlenecks appear when a popular device configuration requires a specific driver or bonding method, making component availability and change control important to launch schedules.

OEM integration captures final commercial value by turning panel attributes into product differentiation or system performance. The same backplane can support a premium smartphone, a professional monitor or an X-ray detector, but each market values different properties. This fragmentation means suppliers benefit from application-specific engineering and lifecycle support instead of relying on one universal specification.

Recent Developments in the IGZO Display Panel Market

May 29, 2025 – Sharp AQUOS R10. Sharp introduced the AQUOS R10 with a Pro IGZO OLED display rated to 3,000 nits and variable 1–240 Hz driving. The development shows that IGZO-related engineering remains relevant to premium smartphone differentiation through brightness, refresh behavior and visual quality. Source
2024 – Sharp low-power and outdoor display concepts. Sharp presented display concepts combining reflective structures and low-frequency IGZO driving for outdoor and low-power uses. The direction matters commercially as it broadens IGZO’s value proposition from conventional mobile displays toward power-sensitive and high-ambient-light applications. Source
2019 – IGZO patent validity matters consolidated. JST records that challenges involving parts of its IGZO patent portfolio in Japan, Korea, Taiwan and Europe concluded by April 2019 with patent validity confirmed. The development supports a clearer licensing environment for commercial oxide-TFT adoption. Source
Current product portfolio – Canon IGZO detector. Canon lists an IGZO TFT flat-panel detector measuring 430 × 430 mm with 3,072 × 3,072 pixels and a 140 μm pitch for fluoroscopy and radiography. The product demonstrates the technology’s commercial role in specialized medical imaging. Source

REPORT SCOPE & SEGMENTATION

Attribute Details
Study Period 2020–2034
Base Year 2025
Estimated Year 2026
Forecast Period 2026–2034
Historical Period 2020–2024
Market Size 2025 USD 4.07 Billion
Market Size 2034 USD 10.38 Billion
Growth Rate CAGR of 11.0% from 2026–2034
Unit Market value in USD
Type Segmentation Under 9.7 inches; 9.7–20 inches; 20–30 inches; Above 32 inches
Application Segmentation Tablets; Monitor; Notebook; Smartphone; TV; IGZO X-Ray Detectors; Others
Technology Segmentation Amorphous IGZO (a-IGZO); Crystalline IGZO (c-IGZO)
End-User Segmentation Consumer Electronics; Healthcare; Automotive; Industrial; Others
Regions North America; Europe; Asia; South America; Middle East & Africa
Key Companies Sharp Corporation; Samsung Display Co., Ltd.; LG Display Co., Ltd.; BOE Technology Group Co., Ltd.; TCL China Star Optoelectronics Technology (CSOT); AU Optronics Corp. (AUO); CPT Technology (Chunghwa Picture Tubes, Ltd.)

Frequently Asked Questions

What is the current size of the IGZO display panel market?

The market is projected at USD 4.07 billion in 2025 and USD 10.38 billion by 2034 , representing a CAGR of 11.0% during 2026–2034. The scope covers panel size, application, technology, end-user and regional dimensions. The growth outlook is tied to continued adoption of solid-state storage across client systems and to the rising storage intensity of data-center workloads. Higher interface speeds and larger capacities are also creating replacement and upgrade opportunities within established device platforms.

Which companies are profiled?

The profiled companies are Sharp Corporation, Samsung Display Co., Ltd., LG Display Co., Ltd., BOE Technology Group Co., Ltd., TCL China Star Optoelectronics Technology (CSOT), AU Optronics Corp. (AUO), and CPT Technology. Their competitive strengths differ by fabrication scale, application coverage, qualification and technology roadmap. The companies span panel fabrication, display integration and specialized technology capabilities, so competitive intensity differs by application. Supplier selection depends on the customer’s required panel size, technology architecture, qualification standard and expected production life.

What is IGZO technology?

IGZO is an oxide semiconductor based on indium, gallium, zinc and oxygen used in thin-film transistor backplanes. Sharp describes electron mobility around 20–50 times that of conventional amorphous silicon and highlights strengths in transistor miniaturization, resolution, touch response and efficient still-image display operation. The technology therefore competes on system-level outcomes rather than material identity alone. Higher mobility is valuable when it improves pixel density, refresh behavior, touch response or energy use without creating unacceptable yield or reliability penalties.

What are the main panel-size segments?

The defined sizes are Under 9.7 inches, 9.7–20 inches, 20–30 inches and Above 32 inches. The 9.7–20 inch range is the leading segment in the scope, supported by tablets, notebooks and monitors that require high pixel density and efficient power use. The size split also changes factory economics, since larger substrates expose yield losses across more pixels and increase the importance of inspection, repair and uniform deposition. Suppliers therefore need size-specific process controls rather than treating all IGZO panels as one manufacturing category.

Which applications use IGZO panels?

Applications include Tablets, Monitor, Notebook, Smartphone, TV, IGZO X-Ray Detectors and Others. Consumer electronics provide the broad demand base, while medical imaging creates a specialized path where detector resolution, image quality and system qualification determine purchasing. The application mix creates a broad but uneven addressable market. Consumer devices offer scale and fast product cycles, while medical and industrial systems offer smaller volumes but can support longer programs once the display or detector is qualified within the customer’s equipment platform.

Which region leads the market?

Asia Pacific is the leading region and the report scope indicates more than 65% of production and consumption in the region. Its strength comes from concentrated display fabrication, panel assembly and downstream electronics manufacturing across major Asian technology centers. Its strength comes from concentrated display fabrication, panel assembly and downstream electronics production, which shortens the path from process development to commercial deployment. The region consequently combines supply-side depth with substantial end-market demand.

Why are tablets important?

Tablets combine high pixel density, battery sensitivity and long viewing periods, so efficient transistor operation can create an end-product strength. IGZO’s reported mobility and still-image power characteristics provide a technical rationale for adoption where image quality and battery life must improve together. For suppliers, the practical requirement is to translate these technical attributes into measurable battery-life, readability and responsiveness benefits that an OEM can validate during qualification. This makes device-level engineering evidence more commercially useful than a standalone material-performance claim.

What are the main growth drivers?

The major drivers are high-resolution consumer electronics, lower display power, premium smartphone differentiation, medical imaging and emerging large-format applications. Each driver creates a different commercial requirement, so suppliers benefit from application-specific product roadmaps rather than a single generic IGZO proposition. These drivers reinforce one another: a higher-resolution panel increases data and circuit complexity, which raises the value of efficient transistor operation, while premium devices provide the price headroom needed to justify more advanced process technology. The strongest opportunities occur where several of these requirements coincide.

What are the main restraints?

The principal restraints are manufacturing complexity and yield sensitivity, competition from OLED and other TFT architectures, specialized material and process dependencies, and long qualification cycles. These factors can raise development cost and slow new-product adoption even when customer demand for high-resolution or low-power displays is strong. Their combined effect is to narrow the applications in which a technology premium is immediately justified. Suppliers therefore need to target programs where resolution, energy use or sensing performance creates enough end-product value to compensate for additional qualification and manufacturing complexity.

What is the medical imaging opportunity?

Medical imaging is a specialized IGZO opportunity where large TFT arrays must deliver defined pixel pitch and imaging performance. Canon lists an IGZO detector with a 430 × 430 mm field, 3,072 × 3,072 pixels and a 140 μm pitch for fluoroscopy and radiography, demonstrating a commercial role beyond consumer displays.

IGZO Display Panel Market Size, Emerging Trends, Technological Advancements, and Business Strategies 2026-2034

Get Sample Report PDF for Exclusive Insights

Report Sample Includes

  • Table of Contents
  • List of Tables & Figures
  • Charts, Research Methodology, and more...

PDF Icon Download Sample Report PDF

Download Sample Report

Table of Content

1 Introduction to Research & Analysis Reports
1.1 IGZO Display Panel Market Definition
1.2 Market Segments
1.2.1 Segment by Type
1.2.2 Segment by Application
1.3 Global IGZO Display Panel Market Overview
1.4 Features & Benefits of This Report
1.5 Methodology & Sources of Information
1.5.1 Research Methodology
1.5.2 Research Process
1.5.3 Base Year
1.5.4 Report Assumptions & Caveats
2 Global IGZO Display Panel Overall Market Size
2.1 Global IGZO Display Panel Market Size: 2024 VS 2031
2.2 Global IGZO Display Panel Market Size, Prospects & Forecasts: 2020-2031
2.3 Global IGZO Display Panel Sales: 2020-2031
3 Company Landscape
3.1 Top IGZO Display Panel Players in Global Market
3.2 Top Global IGZO Display Panel Companies Ranked by Revenue
3.3 Global IGZO Display Panel Revenue by Companies
3.4 Global IGZO Display Panel Sales by Companies
3.5 Global IGZO Display Panel Price by Manufacturer (2020-2025)
3.6 Top 3 and Top 5 IGZO Display Panel Companies in Global Market, by Revenue in 2024
3.7 Global Manufacturers IGZO Display Panel Product Type
3.8 Tier 1, Tier 2, and Tier 3 IGZO Display Panel Players in Global Market
3.8.1 List of Global Tier 1 IGZO Display Panel Companies
3.8.2 List of Global Tier 2 and Tier 3 IGZO Display Panel Companies
4 Sights by Product
4.1 Overview
4.1.1 Segment by Type – Global IGZO Display Panel Market Size Markets, 2024 & 2031
4.1.2 Under 9.7 inches
4.1.3 9.7-20 inches
4.1.4 20-30 inches
4.1.5 Above 32 inches
4.2 Segment by Type – Global IGZO Display Panel Revenue & Forecasts
4.2.1 Segment by Type – Global IGZO Display Panel Revenue, 2020-2025
4.2.2 Segment by Type – Global IGZO Display Panel Revenue, 2026-2031
4.2.3 Segment by Type – Global IGZO Display Panel Revenue Market Share, 2020-2031
4.3 Segment by Type – Global IGZO Display Panel Sales & Forecasts
4.3.1 Segment by Type – Global IGZO Display Panel Sales, 2020-2025
4.3.2 Segment by Type – Global IGZO Display Panel Sales, 2026-2031
4.3.3 Segment by Type – Global IGZO Display Panel Sales Market Share, 2020-2031
4.4 Segment by Type – Global IGZO Display Panel Price (Manufacturers Selling Prices), 2020-2031
5 Sights by Application
5.1 Overview
5.1.1 Segment by Application – Global IGZO Display Panel Market Size, 2024 & 2031
5.1.2 Tablets
5.1.3 Monitor
5.1.4 Notebook
5.1.5 Smartphone
5.1.6 TV
5.1.7 IGZO X-Ray Detectors
5.1.8 Others
5.2 Segment by Application – Global IGZO Display Panel Revenue & Forecasts
5.2.1 Segment by Application – Global IGZO Display Panel Revenue, 2020-2025
5.2.2 Segment by Application – Global IGZO Display Panel Revenue, 2026-2031
5.2.3 Segment by Application – Global IGZO Display Panel Revenue Market Share, 2020-2031
5.3 Segment by Application – Global IGZO Display Panel Sales & Forecasts
5.3.1 Segment by Application – Global IGZO Display Panel Sales, 2020-2025
5.3.2 Segment by Application – Global IGZO Display Panel Sales, 2026-2031
5.3.3 Segment by Application – Global IGZO Display Panel Sales Market Share, 2020-2031
5.4 Segment by Application – Global IGZO Display Panel Price (Manufacturers Selling Prices), 2020-2031
6 Sights by Region
6.1 By Region – Global IGZO Display Panel Market Size, 2024 & 2031
6.2 By Region – Global IGZO Display Panel Revenue & Forecasts
6.2.1 By Region – Global IGZO Display Panel Revenue, 2020-2025
6.2.2 By Region – Global IGZO Display Panel Revenue, 2026-2031
6.2.3 By Region – Global IGZO Display Panel Revenue Market Share, 2020-2031
6.3 By Region – Global IGZO Display Panel Sales & Forecasts
6.3.1 By Region – Global IGZO Display Panel Sales, 2020-2025
6.3.2 By Region – Global IGZO Display Panel Sales, 2026-2031
6.3.3 By Region – Global IGZO Display Panel Sales Market Share, 2020-2031
6.4 North America
6.4.1 By Country – North America IGZO Display Panel Revenue, 2020-2031
6.4.2 By Country – North America IGZO Display Panel Sales, 2020-2031
6.4.3 United States IGZO Display Panel Market Size, 2020-2031
6.4.4 Canada IGZO Display Panel Market Size, 2020-2031
6.4.5 Mexico IGZO Display Panel Market Size, 2020-2031
6.5 Europe
6.5.1 By Country – Europe IGZO Display Panel Revenue, 2020-2031
6.5.2 By Country – Europe IGZO Display Panel Sales, 2020-2031
6.5.3 Germany IGZO Display Panel Market Size, 2020-2031
6.5.4 France IGZO Display Panel Market Size, 2020-2031
6.5.5 U.K. IGZO Display Panel Market Size, 2020-2031
6.5.6 Italy IGZO Display Panel Market Size, 2020-2031
6.5.7 Russia IGZO Display Panel Market Size, 2020-2031
6.5.8 Nordic Countries IGZO Display Panel Market Size, 2020-2031
6.5.9 Benelux IGZO Display Panel Market Size, 2020-2031
6.6 Asia
6.6.1 By Region – Asia IGZO Display Panel Revenue, 2020-2031
6.6.2 By Region – Asia IGZO Display Panel Sales, 2020-2031
6.6.3 China IGZO Display Panel Market Size, 2020-2031
6.6.4 Japan IGZO Display Panel Market Size, 2020-2031
6.6.5 South Korea IGZO Display Panel Market Size, 2020-2031
6.6.6 Southeast Asia IGZO Display Panel Market Size, 2020-2031
6.6.7 India IGZO Display Panel Market Size, 2020-2031
6.7 South America
6.7.1 By Country – South America IGZO Display Panel Revenue, 2020-2031
6.7.2 By Country – South America IGZO Display Panel Sales, 2020-2031
6.7.3 Brazil IGZO Display Panel Market Size, 2020-2031
6.7.4 Argentina IGZO Display Panel Market Size, 2020-2031
6.8 Middle East & Africa
6.8.1 By Country – Middle East & Africa IGZO Display Panel Revenue, 2020-2031
6.8.2 By Country – Middle East & Africa IGZO Display Panel Sales, 2020-2031
6.8.3 Turkey IGZO Display Panel Market Size, 2020-2031
6.8.4 Israel IGZO Display Panel Market Size, 2020-2031
6.8.5 Saudi Arabia IGZO Display Panel Market Size, 2020-2031
6.8.6 UAE IGZO Display Panel Market Size, 2020-2031
7 Manufacturers & Brands Profiles
7.1 Sharp
7.1.1 Sharp Company Summary
7.1.2 Sharp Business Overview
7.1.3 Sharp IGZO Display Panel Major Product Offerings
7.1.4 Sharp IGZO Display Panel Sales and Revenue in Global (2020-2025)
7.1.5 Sharp Key News & Latest Developments
7.2 Samsung
7.2.1 Samsung Company Summary
7.2.2 Samsung Business Overview
7.2.3 Samsung IGZO Display Panel Major Product Offerings
7.2.4 Samsung IGZO Display Panel Sales and Revenue in Global (2020-2025)
7.2.5 Samsung Key News & Latest Developments
7.3 LG Display
7.3.1 LG Display Company Summary
7.3.2 LG Display Business Overview
7.3.3 LG Display IGZO Display Panel Major Product Offerings
7.3.4 LG Display IGZO Display Panel Sales and Revenue in Global (2020-2025)
7.3.5 LG Display Key News & Latest Developments
7.4 BOE
7.4.1 BOE Company Summary
7.4.2 BOE Business Overview
7.4.3 BOE IGZO Display Panel Major Product Offerings
7.4.4 BOE IGZO Display Panel Sales and Revenue in Global (2020-2025)
7.4.5 BOE Key News & Latest Developments
7.5 TCL
7.5.1 TCL Company Summary
7.5.2 TCL Business Overview
7.5.3 TCL IGZO Display Panel Major Product Offerings
7.5.4 TCL IGZO Display Panel Sales and Revenue in Global (2020-2025)
7.5.5 TCL Key News & Latest Developments
7.6 AUO
7.6.1 AUO Company Summary
7.6.2 AUO Business Overview
7.6.3 AUO IGZO Display Panel Major Product Offerings
7.6.4 AUO IGZO Display Panel Sales and Revenue in Global (2020-2025)
7.6.5 AUO Key News & Latest Developments
7.7 CPT Technology
7.7.1 CPT Technology Company Summary
7.7.2 CPT Technology Business Overview
7.7.3 CPT Technology IGZO Display Panel Major Product Offerings
7.7.4 CPT Technology IGZO Display Panel Sales and Revenue in Global (2020-2025)
7.7.5 CPT Technology Key News & Latest Developments
8 Global IGZO Display Panel Production Capacity, Analysis
8.1 Global IGZO Display Panel Production Capacity, 2020-2031
8.2 IGZO Display Panel Production Capacity of Key Manufacturers in Global Market
8.3 Global IGZO Display Panel Production by Region
9 Key Market Trends, Opportunity, Drivers and Restraints
9.1 Market Opportunities & Trends
9.2 Market Drivers
9.3 Market Restraints
10 IGZO Display Panel Supply Chain Analysis
10.1 IGZO Display Panel Industry Value Chain
10.2 IGZO Display Panel Upstream Market
10.3 IGZO Display Panel Downstream and Clients
10.4 Marketing Channels Analysis
10.4.1 Marketing Channels
10.4.2 IGZO Display Panel Distributors and Sales Agents in Global
11 Conclusion
12 Appendix
12.1 Note
12.2 Examples of Clients
12.3 DisclaimerList of Tables
Table 1. Key Players of IGZO Display Panel in Global Market
Table 2. Top IGZO Display Panel Players in Global Market, Ranking by Revenue (2024)
Table 3. Global IGZO Display Panel Revenue by Companies, (US$, Mn), 2020-2025
Table 4. Global IGZO Display Panel Revenue Share by Companies, 2020-2025
Table 5. Global IGZO Display Panel Sales by Companies, (K Sqm), 2020-2025
Table 6. Global IGZO Display Panel Sales Share by Companies, 2020-2025
Table 7. Key Manufacturers IGZO Display Panel Price (2020-2025) & (USD/Sqm)
Table 8. Global Manufacturers IGZO Display Panel Product Type
Table 9. List of Global Tier 1 IGZO Display Panel Companies, Revenue (US$, Mn) in 2024 and Market Share
Table 10. List of Global Tier 2 and Tier 3 IGZO Display Panel Companies, Revenue (US$, Mn) in 2024 and Market Share
Table 11. Segment by Type – Global IGZO Display Panel Revenue, (US$, Mn), 2024 & 2031
Table 12. Segment by Type – Global IGZO Display Panel Revenue (US$, Mn), 2020-2025
Table 13. Segment by Type – Global IGZO Display Panel Revenue (US$, Mn), 2026-2031
Table 14. Segment by Type – Global IGZO Display Panel Sales (K Sqm), 2020-2025
Table 15. Segment by Type – Global IGZO Display Panel Sales (K Sqm), 2026-2031
Table 16. Segment by Application – Global IGZO Display Panel Revenue, (US$, Mn), 2024 & 2031
Table 17. Segment by Application – Global IGZO Display Panel Revenue, (US$, Mn), 2020-2025
Table 18. Segment by Application – Global IGZO Display Panel Revenue, (US$, Mn), 2026-2031
Table 19. Segment by Application – Global IGZO Display Panel Sales, (K Sqm), 2020-2025
Table 20. Segment by Application – Global IGZO Display Panel Sales, (K Sqm), 2026-2031
Table 21. By Region – Global IGZO Display Panel Revenue, (US$, Mn), 2025-2031
Table 22. By Region – Global IGZO Display Panel Revenue, (US$, Mn), 2020-2025
Table 23. By Region – Global IGZO Display Panel Revenue, (US$, Mn), 2026-2031
Table 24. By Region – Global IGZO Display Panel Sales, (K Sqm), 2020-2025
Table 25. By Region – Global IGZO Display Panel Sales, (K Sqm), 2026-2031
Table 26. By Country – North America IGZO Display Panel Revenue, (US$, Mn), 2020-2025
Table 27. By Country – North America IGZO Display Panel Revenue, (US$, Mn), 2026-2031
Table 28. By Country – North America IGZO Display Panel Sales, (K Sqm), 2020-2025
Table 29. By Country – North America IGZO Display Panel Sales, (K Sqm), 2026-2031
Table 30. By Country – Europe IGZO Display Panel Revenue, (US$, Mn), 2020-2025
Table 31. By Country – Europe IGZO Display Panel Revenue, (US$, Mn), 2026-2031
Table 32. By Country – Europe IGZO Display Panel Sales, (K Sqm), 2020-2025
Table 33. By Country – Europe IGZO Display Panel Sales, (K Sqm), 2026-2031
Table 34. By Region – Asia IGZO Display Panel Revenue, (US$, Mn), 2020-2025
Table 35. By Region – Asia IGZO Display Panel Revenue, (US$, Mn), 2026-2031
Table 36. By Region – Asia IGZO Display Panel Sales, (K Sqm), 2020-2025
Table 37. By Region – Asia IGZO Display Panel Sales, (K Sqm), 2026-2031
Table 38. By Country – South America IGZO Display Panel Revenue, (US$, Mn), 2020-2025
Table 39. By Country – South America IGZO Display Panel Revenue, (US$, Mn), 2026-2031
Table 40. By Country – South America IGZO Display Panel Sales, (K Sqm), 2020-2025
Table 41. By Country – South America IGZO Display Panel Sales, (K Sqm), 2026-2031
Table 42. By Country – Middle East & Africa IGZO Display Panel Revenue, (US$, Mn), 2020-2025
Table 43. By Country – Middle East & Africa IGZO Display Panel Revenue, (US$, Mn), 2026-2031
Table 44. By Country – Middle East & Africa IGZO Display Panel Sales, (K Sqm), 2020-2025
Table 45. By Country – Middle East & Africa IGZO Display Panel Sales, (K Sqm), 2026-2031
Table 46. Sharp Company Summary
Table 47. Sharp IGZO Display Panel Product Offerings
Table 48. Sharp IGZO Display Panel Sales (K Sqm), Revenue (US$, Mn) and Average Price (USD/Sqm) & (2020-2025)
Table 49. Sharp Key News & Latest Developments
Table 50. Samsung Company Summary
Table 51. Samsung IGZO Display Panel Product Offerings
Table 52. Samsung IGZO Display Panel Sales (K Sqm), Revenue (US$, Mn) and Average Price (USD/Sqm) & (2020-2025)
Table 53. Samsung Key News & Latest Developments
Table 54. LG Display Company Summary
Table 55. LG Display IGZO Display Panel Product Offerings
Table 56. LG Display IGZO Display Panel Sales (K Sqm), Revenue (US$, Mn) and Average Price (USD/Sqm) & (2020-2025)
Table 57. LG Display Key News & Latest Developments
Table 58. BOE Company Summary
Table 59. BOE IGZO Display Panel Product Offerings
Table 60. BOE IGZO Display Panel Sales (K Sqm), Revenue (US$, Mn) and Average Price (USD/Sqm) & (2020-2025)
Table 61. BOE Key News & Latest Developments
Table 62. TCL Company Summary
Table 63. TCL IGZO Display Panel Product Offerings
Table 64. TCL IGZO Display Panel Sales (K Sqm), Revenue (US$, Mn) and Average Price (USD/Sqm) & (2020-2025)
Table 65. TCL Key News & Latest Developments
Table 66. AUO Company Summary
Table 67. AUO IGZO Display Panel Product Offerings
Table 68. AUO IGZO Display Panel Sales (K Sqm), Revenue (US$, Mn) and Average Price (USD/Sqm) & (2020-2025)
Table 69. AUO Key News & Latest Developments
Table 70. CPT Technology Company Summary
Table 71. CPT Technology IGZO Display Panel Product Offerings
Table 72. CPT Technology IGZO Display Panel Sales (K Sqm), Revenue (US$, Mn) and Average Price (USD/Sqm) & (2020-2025)
Table 73. CPT Technology Key News & Latest Developments
Table 74. IGZO Display Panel Capacity of Key Manufacturers in Global Market, 2023-2025 (K Sqm)
Table 75. Global IGZO Display Panel Capacity Market Share of Key Manufacturers, 2023-2025
Table 76. Global IGZO Display Panel Production by Region, 2020-2025 (K Sqm)
Table 77. Global IGZO Display Panel Production by Region, 2026-2031 (K Sqm)
Table 78. IGZO Display Panel Market Opportunities & Trends in Global Market
Table 79. IGZO Display Panel Market Drivers in Global Market
Table 80. IGZO Display Panel Market Restraints in Global Market
Table 81. IGZO Display Panel Raw Materials
Table 82. IGZO Display Panel Raw Materials Suppliers in Global Market
Table 83. Typical IGZO Display Panel Downstream
Table 84. IGZO Display Panel Downstream Clients in Global Market
Table 85. IGZO Display Panel Distributors and Sales Agents in Global Market

List of Figures
Figure 1. IGZO Display Panel Product Picture
Figure 2. IGZO Display Panel Segment by Type in 2024
Figure 3. IGZO Display Panel Segment by Application in 2024
Figure 4. Global IGZO Display Panel Market Overview: 2024
Figure 5. Key Caveats
Figure 6. Global IGZO Display Panel Market Size: 2024 VS 2031 (US$, Mn)
Figure 7. Global IGZO Display Panel Revenue: 2020-2031 (US$, Mn)
Figure 8. IGZO Display Panel Sales in Global Market: 2020-2031 (K Sqm)
Figure 9. The Top 3 and 5 Players Market Share by IGZO Display Panel Revenue in 2024
Figure 10. Segment by Type – Global IGZO Display Panel Revenue, (US$, Mn), 2024 & 2031
Figure 11. Segment by Type – Global IGZO Display Panel Revenue Market Share, 2020-2031
Figure 12. Segment by Type – Global IGZO Display Panel Sales Market Share, 2020-2031
Figure 13. Segment by Type – Global IGZO Display Panel Price (USD/Sqm), 2020-2031
Figure 14. Segment by Application – Global IGZO Display Panel Revenue, (US$, Mn), 2024 & 2031
Figure 15. Segment by Application – Global IGZO Display Panel Revenue Market Share, 2020-2031
Figure 16. Segment by Application – Global IGZO Display Panel Sales Market Share, 2020-2031
Figure 17. Segment by Application -Global IGZO Display Panel Price (USD/Sqm), 2020-2031
Figure 18. By Region – Global IGZO Display Panel Revenue, (US$, Mn), 2025 & 2031
Figure 19. By Region – Global IGZO Display Panel Revenue Market Share, 2020 VS 2024 VS 2031
Figure 20. By Region – Global IGZO Display Panel Revenue Market Share, 2020-2031
Figure 21. By Region – Global IGZO Display Panel Sales Market Share, 2020-2031
Figure 22. By Country – North America IGZO Display Panel Revenue Market Share, 2020-2031
Figure 23. By Country – North America IGZO Display Panel Sales Market Share, 2020-2031
Figure 24. United States IGZO Display Panel Revenue, (US$, Mn), 2020-2031
Figure 25. Canada IGZO Display Panel Revenue, (US$, Mn), 2020-2031
Figure 26. Mexico IGZO Display Panel Revenue, (US$, Mn), 2020-2031
Figure 27. By Country – Europe IGZO Display Panel Revenue Market Share, 2020-2031
Figure 28. By Country – Europe IGZO Display Panel Sales Market Share, 2020-2031
Figure 29. Germany IGZO Display Panel Revenue, (US$, Mn), 2020-2031
Figure 30. France IGZO Display Panel Revenue, (US$, Mn), 2020-2031
Figure 31. U.K. IGZO Display Panel Revenue, (US$, Mn), 2020-2031
Figure 32. Italy IGZO Display Panel Revenue, (US$, Mn), 2020-2031
Figure 33. Russia IGZO Display Panel Revenue, (US$, Mn), 2020-2031
Figure 34. Nordic Countries IGZO Display Panel Revenue, (US$, Mn), 2020-2031
Figure 35. Benelux IGZO Display Panel Revenue, (US$, Mn), 2020-2031
Figure 36. By Region – Asia IGZO Display Panel Revenue Market Share, 2020-2031
Figure 37. By Region – Asia IGZO Display Panel Sales Market Share, 2020-2031
Figure 38. China IGZO Display Panel Revenue, (US$, Mn), 2020-2031
Figure 39. Japan IGZO Display Panel Revenue, (US$, Mn), 2020-2031
Figure 40. South Korea IGZO Display Panel Revenue, (US$, Mn), 2020-2031
Figure 41. Southeast Asia IGZO Display Panel Revenue, (US$, Mn), 2020-2031
Figure 42. India IGZO Display Panel Revenue, (US$, Mn), 2020-2031
Figure 43. By Country – South America IGZO Display Panel Revenue Market Share, 2020-2031
Figure 44. By Country – South America IGZO Display Panel Sales, Market Share, 2020-2031
Figure 45. Brazil IGZO Display Panel Revenue, (US$, Mn), 2020-2031
Figure 46. Argentina IGZO Display Panel Revenue, (US$, Mn), 2020-2031
Figure 47. By Country – Middle East & Africa IGZO Display Panel Revenue, Market Share, 2020-2031
Figure 48. By Country – Middle East & Africa IGZO Display Panel Sales, Market Share, 2020-2031
Figure 49. Turkey IGZO Display Panel Revenue, (US$, Mn), 2020-2031
Figure 50. Israel IGZO Display Panel Revenue, (US$, Mn), 2020-2031
Figure 51. Saudi Arabia IGZO Display Panel Revenue, (US$, Mn), 2020-2031
Figure 52. UAE IGZO Display Panel Revenue, (US$, Mn), 2020-2031
Figure 53. Global IGZO Display Panel Production Capacity (K Sqm), 2020-2031
Figure 54. The Percentage of Production IGZO Display Panel by Region, 2024 VS 2031
Figure 55. IGZO Display Panel Industry Value Chain
Figure 56. Marketing Channels