High-performance Inertial Sensors and IMU Market, Global Business Strategies 2025-2032

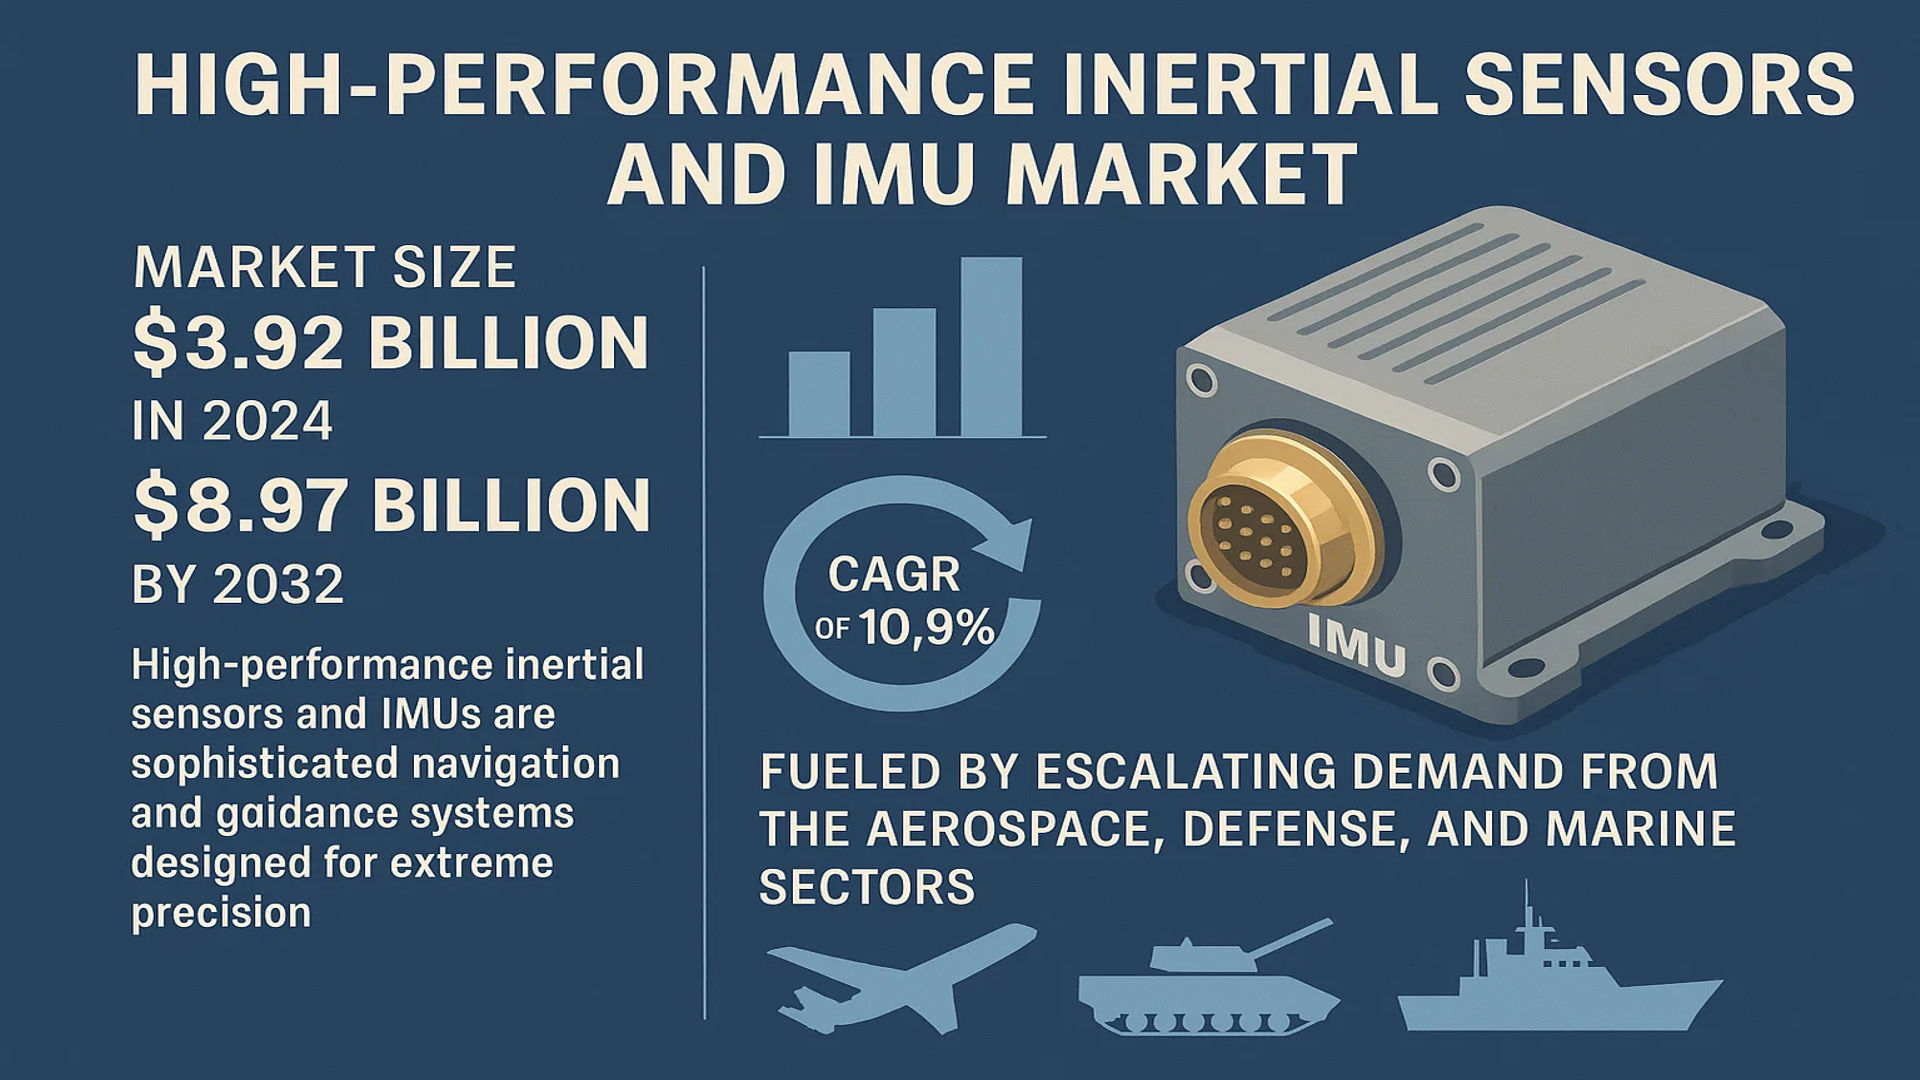
High-performance Inertial Sensors and IMU Market size was valued at US$ 3.92 billion in 2024 and is projected to reach US$ 8.97 billion by 2032, at a CAGR of 10.9% during the forecast period 2025-2032.


PDF Icon Download Sample Report PDF
  • Quick Dispatch

    All Orders

  • Secure Payment

    100% Secure Payment

Price range: $1,500.00 through $4,250.00

Clear

MARKET INSIGHTS

The global High-performance Inertial Sensors and IMU Market size was valued at US$ 3.92 billion in 2024 and is projected to reach US$ 8.97 billion by 2032, at a CAGR of 10.9% during the forecast period 2025-2032.

High-performance inertial sensors and inertial measurement units (IMUs) are sophisticated navigation and guidance systems designed for applications demanding extreme precision and reliability. These systems are traditionally manufactured using non-MEMS technologies, primarily fiber optic gyroscopes (FOGs) and ring laser gyros (RLGs), which offer superior performance characteristics compared to their MEMS-based counterparts. An IMU integrates these high-performance gyroscopes and accelerometers to measure and report a body’s specific force, angular rate, and sometimes the magnetic field surrounding the body.

The market’s robust growth is fueled by escalating demand from the aerospace, defense, and marine sectors, where precision navigation is mission-critical. Furthermore, the expansion of industrial automation and the increasing integration of these systems in unmanned vehicles are significant contributors. The market is highly technology-intensive, with major research and development concentrated in state-owned enterprises, particularly in China. Key global players driving innovation and market expansion include Navgnss, Avic-gyro, SDI, and Norinco Group.
High-performance Inertial Sensors and IMU Market

MARKET DYNAMICS

MARKET DRIVERS

Rising Defense Expenditure and Modernization Programs to Accelerate Market Growth

Global defense modernization initiatives are significantly driving demand for high-performance inertial sensors and IMUs, particularly in navigation, guidance, and stabilization systems for military applications. Countries are increasing their defense budgets to enhance capabilities in areas such as missile guidance, unmanned systems, and aircraft navigation. Defense spending has reached unprecedented levels, with several nations allocating over 2% of their GDP to military expenditures. This trend is particularly evident in regions with geopolitical tensions, where precision navigation and targeting systems are becoming critical components of national security strategies. The integration of fiber optic gyroscopes (FOGs) and ring laser gyros (RLGs) in defense applications provides the required accuracy and reliability under extreme conditions, making them indispensable for modern warfare systems.

Expansion of Commercial Aerospace and Autonomous Systems to Fuel Adoption

The commercial aerospace sector’s recovery and growth post-pandemic, coupled with increasing investments in autonomous vehicles and drones, are creating substantial demand for high-performance inertial measurement units. Aerospace applications require navigation systems that maintain accuracy during long flights and through various atmospheric conditions, driving the adoption of RLG and FOG-based IMUs. Meanwhile, the autonomous vehicle market is projected to experience exponential growth, with advanced navigation systems relying on high-performance sensors for precise positioning and orientation. These sensors provide critical data for obstacle avoidance, path planning, and stabilization, making them essential components in the development of fully autonomous systems across multiple industries.

Furthermore, the maritime industry’s increasing adoption of autonomous vessels and underwater navigation systems is contributing to market expansion. These applications require inertial sensors that can maintain accuracy in GPS-denied environments, creating additional demand for high-performance solutions.

For instance, recent developments in offshore exploration and underwater robotics have driven demand for navigation systems capable of operating at depths where satellite signals are unavailable, creating new application areas for high-performance IMUs.

Additionally, the space exploration sector’s renewed focus on lunar and planetary missions is expected to drive further innovation and adoption of advanced inertial navigation systems in the coming years.

MARKET CHALLENGES

High Development and Manufacturing Costs Pose Significant Market Barriers

The development and production of high-performance inertial sensors involve substantial capital investment and specialized manufacturing capabilities. These systems require precision engineering, advanced materials, and sophisticated calibration processes that drive up production costs. The manufacturing of fiber optic gyroscopes and ring laser gyros involves complex optical components and precise alignment systems that require specialized facilities and highly trained technicians. This results in unit costs that can range from thousands to hundreds of thousands of dollars depending on the performance grade, making these systems cost-prohibitive for many potential applications.

Other Challenges

Technical Complexity and Integration Issues
Integrating high-performance inertial systems into existing platforms presents significant technical challenges. These systems require sophisticated algorithms for error compensation, temperature stabilization, and data fusion with other navigation sensors. The complexity increases when implementing these systems in size-constrained or power-limited applications, where the substantial size and power requirements of traditional RLG and FOG systems can be limiting factors.

Supply Chain Vulnerabilities
The specialized components required for high-performance inertial sensors, particularly optical components and precision mechanical elements, face supply chain constraints and potential disruptions. Many critical components come from limited sources, creating vulnerabilities in the manufacturing process and potentially affecting delivery timelines and costs for end-users.

MARKET RESTRAINTS

Competition from Advanced MEMS Technologies to Limit Traditional Market Growth

While high-performance MEMS-based IMUs are excluded from this market segment, advancements in MEMS technology are creating competitive pressure on traditional RLG and FOG systems. Recent developments in MEMS manufacturing have enabled performance levels that approach traditional high-end systems at significantly lower costs and smaller form factors. This technological convergence is particularly evident in applications where the highest levels of performance are not absolutely required, allowing MEMS-based systems to capture market share from traditional high-performance solutions.

Additionally, the rapid pace of innovation in MEMS technology continues to narrow the performance gap, creating pricing pressure and forcing traditional manufacturers to justify the premium associated with their systems. This competitive dynamic is particularly challenging in commercial applications where cost sensitivity is higher than in defense and aerospace sectors.

MARKET OPPORTUNITIES

Emerging Applications in Quantum Navigation and Urban Air Mobility to Create New Growth Avenues

Emerging technologies such as quantum-enhanced navigation and the development of urban air mobility (UAM) systems are creating new opportunities for high-performance inertial sensors. Quantum navigation systems, while still in development, require ultra-precise inertial measurements as complementary sensors, driving demand for the highest performance IMUs. Meanwhile, the urban air mobility market is projected to require navigation systems that can operate in urban canyons and other GPS-challenged environments, creating substantial opportunities for inertial navigation solutions.

Furthermore, the increasing need for resilient positioning, navigation, and timing (PNT) systems in critical infrastructure protection is driving investment in inertial navigation technologies. These systems provide backup navigation capabilities when external signals are compromised or unavailable, making them essential for national security and critical infrastructure applications.

Additionally, advancements in sensor fusion algorithms and artificial intelligence are enabling new applications that combine inertial sensors with other technologies, creating opportunities for innovation and market expansion beyond traditional navigation applications.

HIGH-PERFORMANCE INERTIAL SENSORS AND IMU MARKET TRENDS

Advancements in Fiber Optic and Ring Laser Gyroscope Technologies Drive Market Precision

The relentless pursuit of higher precision and stability in navigation and guidance systems is fundamentally reshaping the high-performance inertial sensors and IMU landscape. While traditional non-MEMS technologies like Fiber Optic Gyroscopes (FOGs) and Ring Laser Gyroscopes (RLGs) have long been the cornerstone of this sector, recent innovations are pushing the boundaries of their performance. Manufacturers are achieving significant reductions in bias instability and angle random walk, with some advanced FOGs now demonstrating bias stability figures below 0.1 degrees per hour. This enhanced performance is critical for applications requiring extreme accuracy over prolonged periods without external reference, such as in submarine navigation and satellite pointing systems. Furthermore, the integration of sophisticated calibration algorithms and temperature compensation techniques is mitigating environmental effects, thereby expanding the operational envelope of these systems in harsh conditions. The drive towards miniaturization, without compromising on performance, is also a key focus, enabling their use in a wider array of platforms, from unmanned aerial vehicles to strategic defense systems.

Other Trends

Expansion in Defense and Aerospace Applications

The global defense sector’s modernization initiatives are a primary catalyst for market growth, creating sustained demand for reliable and precise inertial navigation systems. Modern military platforms, including next-generation fighter aircraft, naval vessels, and guided munitions, are increasingly dependent on high-performance IMUs for navigation in GPS-denied environments. This is because these systems provide continuous positional data where satellite signals are jammed or unavailable. Investment in unmanned systems is particularly significant, with the global military UAV market itself projected to see substantial growth, directly fueling demand for the inertial sensors that form their navigational backbone. The requirement for autonomous operations in complex scenarios ensures that this segment will remain a dominant and stable driver for the foreseeable future.

Rising Demand for Industrial and Robotic Automation

Beyond aerospace and defense, the industrial sector is emerging as a powerful growth engine for high-performance inertial sensors. The proliferation of industrial automation and robotics necessitates precise motion tracking and control, which these sensors provide. Applications range from stabilizing heavy machinery and robotic arms in manufacturing to providing navigation for autonomous guided vehicles (AGVs) within smart warehouses. The trend towards Industry 4.0, which emphasizes interconnectivity and real-time data, is accelerating this adoption. In these settings, the sensors ensure operational safety, enhance precision, and improve overall efficiency. The market is responding with the development of more robust and cost-effective solutions tailored to withstand the rigors of industrial environments, making high-performance inertial technology accessible to a broader range of commercial applications.

COMPETITIVE LANDSCAPE

Key Industry Players

Technological Innovation and Strategic Positioning Drive Market Leadership

The global high-performance inertial sensors and IMU market exhibits a semi-consolidated structure, characterized by a mix of large, state-affiliated entities, specialized technology firms, and emerging players. This landscape is heavily influenced by significant barriers to entry, including intense R&D requirements, stringent performance certifications for aerospace and defense applications, and complex manufacturing processes for non-MEMS technologies like Fiber Optic Gyroscopes (FOGs) and Ring Laser Gyros (RLGs). While North American and European companies have historically dominated the high-end spectrum, a notable and rapid expansion of manufacturing and innovation capabilities is occurring within China, reshaping global competitive dynamics.

Chinese state-owned enterprises, backed by substantial national investment, have emerged as formidable competitors. China Aerospace Science and Technology Corporation (CASC) and Aviation Industry Corporation of China (AVIC) are pivotal players, leveraging their deep integration into the country’s aerospace and defense programs. Their growth is not merely based on domestic procurement but is increasingly supported by advancements in indigenous technology, allowing them to contest international market share. Companies under these conglomerates, such as AVIC-Gyro and Norinco Group, are central to this effort, focusing on achieving performance parity with established Western products.

Alongside these state-backed giants, specialized Chinese manufacturers are strengthening their foothold through innovation and strategic market focus. Navgnss and HY Technology, for instance, have carved out significant niches by offering highly reliable and cost-competitive FOG-based solutions, primarily targeting the commercial aerospace, maritime, and surveying sectors. Their strategy often involves aggressive R&D investment to close the technology gap, followed by competitive pricing to capture market share in price-sensitive regions and applications. This approach is putting pressure on established players to accelerate their own innovation cycles and optimize production costs.

Meanwhile, other key global players are responding by deepening their technological moats and forming strategic alliances. They are investing heavily in next-generation inertial navigation systems that offer enhanced accuracy, smaller form factors, and better resistance to extreme environments. Furthermore, to sustain their leadership, these companies are actively pursuing contracts in next-generation defense systems, urban air mobility (UAM), and autonomous underwater vehicles (AUVs), applications where the demand for precision navigation is critical and growing. The competitive landscape is therefore defined by a dual trajectory: the rapid ascent of technologically proficient Chinese manufacturers and the strategic adaptation of established Western firms aiming to maintain their edge through superior performance and reliability.

List of Key High-performance Inertial Sensors and IMU Companies Profiled

  • Navgnss (China)
  • AVIC-Gyro (China)
  • Safran Data Instruments – SDI (France)
  • Norinco Group (China)
  • HY Technology (China)
  • Baocheng (China)
  • Right M&C (China)
  • Chinastar (China)
  • Xi’an Chenxi (China)
  • FACRI (China)
  • StarNeto (China)

Segment Analysis:

By Type

High-performance Gyroscopes Segment Dominates the Market Due to Critical Role in Navigation and Stabilization Systems

The market is segmented based on type into:

  • High-performance gyroscopes
    • Subtypes: Fiber Optic Gyroscopes (FOGs), Ring Laser Gyroscopes (RLGs), and others
  • High-performance accelerometers

By Application

INS/GPS Segment Leads Due to High Adoption in Defense, Aerospace, and Marine Navigation

The market is segmented based on application into:

  • IMU (Inertial Measurement Unit)
  • AHRS (Attitude and Heading Reference System)
  • INS/GPS (Inertial Navigation System/Global Positioning System)
  • Other

By Technology

Fiber Optic Gyroscope (FOG) Technology Holds Significant Share Owing to Superior Performance in Harsh Environments

The market is segmented based on technology into:

  • Fiber Optic Gyroscope (FOG)
  • Ring Laser Gyroscope (RLG)
  • Mechanical Gyroscope
  • Others

By End-User Industry

Defense and Aerospace Segment is the Primary Driver Due to Extensive Use in Missile Guidance, Aircraft, and Unmanned Systems

The market is segmented based on end-user industry into:

  • Defense and Aerospace
  • Marine
  • Industrial
  • Others

Regional Analysis: High-performance Inertial Sensors and IMU Market

Asia-Pacific
The Asia-Pacific region is the dominant force in the global high-performance inertial sensors and IMU market, largely driven by China’s extensive state-led aerospace and defense programs. The market is characterized by significant R&D investments concentrated within state-owned enterprises like the China Aerospace Science and Technology Corporation (CASC) and the Aviation Industry Corporation of China (AVIC). These entities are pivotal in advancing fiber optic gyroscope (FOG) and ring laser gyro (RLG) technologies for critical applications in missile guidance, satellite navigation, and unmanned systems. While cost sensitivity exists, the sheer scale of national infrastructure and modernization projects ensures sustained demand. Other key regional players, including Navgnss, Chinastar, and Xi’an Chenxi, contribute to a robust and increasingly self-reliant supply chain, though the market remains heavily influenced by government procurement and strategic imperatives.

North America
North America represents a mature and technologically advanced market, primarily fueled by the United States’ substantial defense budget and stringent performance requirements for military and aerospace applications. The region is a hub for innovation, with demand driven by next-generation programs in hypersonics, space exploration, and autonomous systems. While the provided data highlights Chinese manufacturers, the North American landscape is dominated by established Western defense contractors and specialized technology firms that supply high-grade FOGs and RLGs. The market is less volume-driven than Asia-Pacific but commands a premium for cutting-edge performance, reliability, and integration with complex navigation systems. Regulatory compliance and export controls significantly shape the competitive environment and supply chains within this region.

Europe
Europe maintains a strong, innovation-focused market for high-performance inertial sensors, supported by collaborative defense initiatives under the European Defence Fund and robust aerospace programs from companies like Airbus. The region emphasizes technological sovereignty and the development of secure, indigenous supply chains for critical navigation components. European manufacturers and research institutions are actively engaged in advancing FOG and RLG technologies to reduce dependency on external sources. Stringent certification standards and a focus on dual-use applications—spanning both defense and high-end industrial sectors like autonomous maritime navigation—are key market drivers. However, fragmentation across national markets and complex procurement processes can sometimes slow the pace of adoption compared to more centralized systems.

South America
The market in South America is nascent but developing, with growth opportunities linked to gradual modernization of defense capabilities and investments in natural resource exploration, which requires precise navigation for surveying and mapping. Countries like Brazil and Argentina are the primary drivers, though budgets are often constrained compared to other regions. This economic volatility limits large-scale adoption of the most advanced systems, leading to a market that often prioritizes cost-effective solutions or upgrades to existing platforms. While there is recognition of the strategic importance of inertial navigation technology, widespread deployment is hindered by budgetary cycles and a less mature local industrial base for these highly specialized components.

Middle East & Africa
This region presents an emerging market with potential driven by strategic defense investments in select nations, particularly in the Gulf Cooperation Council (GCC) countries like Saudi Arabia, Israel, and the UAE. Demand is primarily fueled by military modernization programs, procurement of advanced aerial and naval platforms, and the need for precise guidance systems. Israel, with its strong domestic defense technology sector, is a notable innovator and consumer. However, overall market growth is uneven and can be impacted by geopolitical instability and fluctuating oil revenues, which affect national defense budgets. The lack of a significant local manufacturing base means the market is largely served through imports and international partnerships, presenting both challenges and opportunities for global suppliers.

Report Scope

This market research report provides a comprehensive analysis of the global High-performance Inertial Sensors and IMU market, covering the forecast period 2025–2032. It offers detailed insights into market dynamics, technological advancements, competitive landscape, and key trends shaping the industry.

Key focus areas of the report include:

  • Market Size & Forecast: Historical data and future projections for revenue, unit shipments, and market value across major regions and segments.
  • Segmentation Analysis: Detailed breakdown by product type, technology, application, and end-user industry to identify high-growth segments and investment opportunities.
  • Regional Outlook: Insights into market performance across North America, Europe, Asia-Pacific, Latin America, and the Middle East & Africa, including country-level analysis where relevant.
  • Competitive Landscape: Profiles of leading market participants, including their product offerings, R&D focus, manufacturing capacity, pricing strategies, and recent developments such as mergers, acquisitions, and partnerships.
  • Technology Trends & Innovation: Assessment of emerging technologies, integration of AI/IoT, semiconductor design trends, fabrication techniques, and evolving industry standards.
  • Market Drivers & Restraints: Evaluation of factors driving market growth along with challenges, supply chain constraints, regulatory issues, and market-entry barriers.
  • Stakeholder Analysis: Insights for component suppliers, OEMs, system integrators, investors, and policymakers regarding the evolving ecosystem and strategic opportunities.

Primary and secondary research methods are employed, including interviews with industry experts, data from verified sources, and real-time market intelligence to ensure the accuracy and reliability of the insights presented.

FREQUENTLY ASKED QUESTIONS:

What is the current market size of Global High-performance Inertial Sensors and IMU Market?

-> The global High-performance Inertial Sensors and IMU market was valued at USD 3.92 billion in 2024 and is projected to reach USD 8.97 billion by 2032.

Which key companies operate in Global High-performance Inertial Sensors and IMU Market?

-> Key players include Navgnss, Avic-gyro, SDI, Norinco Group, HY Technology, Baocheng, Right M&C, Chinastar, Chenxi, FACRI, and StarNeto, among others.

What are the key growth drivers?

-> Key growth drivers include increased defense spending globally, expansion of aerospace and satellite navigation systems, and rising demand for precision navigation in autonomous vehicles and industrial automation.

Which region dominates the market?

-> Asia-Pacific is the fastest-growing region, driven by significant investments in China’s aerospace and defense sectors, while North America remains a dominant market due to advanced military and space programs.

What are the emerging trends?

-> Emerging trends include miniaturization of FOG and RLG technologies, integration with AI for enhanced data processing, and development of quantum inertial sensors for next-generation navigation systems.

High-performance Inertial Sensors and IMU Market, Global Business Strategies 2025-2032

Get Sample Report PDF for Exclusive Insights

Report Sample Includes

  • Table of Contents
  • List of Tables & Figures
  • Charts, Research Methodology, and more...

PDF Icon Download Sample Report PDF
SKU: 59da3e4de0de
Category:

Download Sample Report

Table of Content

1 Introduction to Research & Analysis Reports
1.1 High-performance Inertial Sensors and IMU Market Definition
1.2 Market Segments
1.2.1 Segment by Type
1.2.2 Segment by Application
1.3 Global High-performance Inertial Sensors and IMU Market Overview
1.4 Features & Benefits of This Report
1.5 Methodology & Sources of Information
1.5.1 Research Methodology
1.5.2 Research Process
1.5.3 Base Year
1.5.4 Report Assumptions & Caveats
2 Global High-performance Inertial Sensors and IMU Overall Market Size
2.1 Global High-performance Inertial Sensors and IMU Market Size: 2024 VS 2032
2.2 Global High-performance Inertial Sensors and IMU Market Size, Prospects & Forecasts: 2020-2032
2.3 Global High-performance Inertial Sensors and IMU Sales: 2020-2032
3 Company Landscape
3.1 Top High-performance Inertial Sensors and IMU Players in Global Market
3.2 Top Global High-performance Inertial Sensors and IMU Companies Ranked by Revenue
3.3 Global High-performance Inertial Sensors and IMU Revenue by Companies
3.4 Global High-performance Inertial Sensors and IMU Sales by Companies
3.5 Global High-performance Inertial Sensors and IMU Price by Manufacturer (2020-2025)
3.6 Top 3 and Top 5 High-performance Inertial Sensors and IMU Companies in Global Market, by Revenue in 2024
3.7 Global Manufacturers High-performance Inertial Sensors and IMU Product Type
3.8 Tier 1, Tier 2, and Tier 3 High-performance Inertial Sensors and IMU Players in Global Market
3.8.1 List of Global Tier 1 High-performance Inertial Sensors and IMU Companies
3.8.2 List of Global Tier 2 and Tier 3 High-performance Inertial Sensors and IMU Companies
4 Sights by Product
4.1 Overview
4.1.1 Segment by Type – Global High-performance Inertial Sensors and IMU Market Size Markets, 2024 & 2032
4.1.2 High-performance gyroscopes
4.1.3 High-performance accelerometers
4.2 Segment by Type – Global High-performance Inertial Sensors and IMU Revenue & Forecasts
4.2.1 Segment by Type – Global High-performance Inertial Sensors and IMU Revenue, 2020-2025
4.2.2 Segment by Type – Global High-performance Inertial Sensors and IMU Revenue, 2026-2032
4.2.3 Segment by Type – Global High-performance Inertial Sensors and IMU Revenue Market Share, 2020-2032
4.3 Segment by Type – Global High-performance Inertial Sensors and IMU Sales & Forecasts
4.3.1 Segment by Type – Global High-performance Inertial Sensors and IMU Sales, 2020-2025
4.3.2 Segment by Type – Global High-performance Inertial Sensors and IMU Sales, 2026-2032
4.3.3 Segment by Type – Global High-performance Inertial Sensors and IMU Sales Market Share, 2020-2032
4.4 Segment by Type – Global High-performance Inertial Sensors and IMU Price (Manufacturers Selling Prices), 2020-2032
5 Sights by Application
5.1 Overview
5.1.1 Segment by Application – Global High-performance Inertial Sensors and IMU Market Size, 2024 & 2032
5.1.2 IMU
5.1.3 AHRS
5.1.4 INS/GPS
5.1.5 Other
5.2 Segment by Application – Global High-performance Inertial Sensors and IMU Revenue & Forecasts
5.2.1 Segment by Application – Global High-performance Inertial Sensors and IMU Revenue, 2020-2025
5.2.2 Segment by Application – Global High-performance Inertial Sensors and IMU Revenue, 2026-2032
5.2.3 Segment by Application – Global High-performance Inertial Sensors and IMU Revenue Market Share, 2020-2032
5.3 Segment by Application – Global High-performance Inertial Sensors and IMU Sales & Forecasts
5.3.1 Segment by Application – Global High-performance Inertial Sensors and IMU Sales, 2020-2025
5.3.2 Segment by Application – Global High-performance Inertial Sensors and IMU Sales, 2026-2032
5.3.3 Segment by Application – Global High-performance Inertial Sensors and IMU Sales Market Share, 2020-2032
5.4 Segment by Application – Global High-performance Inertial Sensors and IMU Price (Manufacturers Selling Prices), 2020-2032
6 Sights by Region
6.1 By Region – Global High-performance Inertial Sensors and IMU Market Size, 2024 & 2032
6.2 By Region – Global High-performance Inertial Sensors and IMU Revenue & Forecasts
6.2.1 By Region – Global High-performance Inertial Sensors and IMU Revenue, 2020-2025
6.2.2 By Region – Global High-performance Inertial Sensors and IMU Revenue, 2026-2032
6.2.3 By Region – Global High-performance Inertial Sensors and IMU Revenue Market Share, 2020-2032
6.3 By Region – Global High-performance Inertial Sensors and IMU Sales & Forecasts
6.3.1 By Region – Global High-performance Inertial Sensors and IMU Sales, 2020-2025
6.3.2 By Region – Global High-performance Inertial Sensors and IMU Sales, 2026-2032
6.3.3 By Region – Global High-performance Inertial Sensors and IMU Sales Market Share, 2020-2032
6.4 North America
6.4.1 By Country – North America High-performance Inertial Sensors and IMU Revenue, 2020-2032
6.4.2 By Country – North America High-performance Inertial Sensors and IMU Sales, 2020-2032
6.4.3 United States High-performance Inertial Sensors and IMU Market Size, 2020-2032
6.4.4 Canada High-performance Inertial Sensors and IMU Market Size, 2020-2032
6.4.5 Mexico High-performance Inertial Sensors and IMU Market Size, 2020-2032
6.5 Europe
6.5.1 By Country – Europe High-performance Inertial Sensors and IMU Revenue, 2020-2032
6.5.2 By Country – Europe High-performance Inertial Sensors and IMU Sales, 2020-2032
6.5.3 Germany High-performance Inertial Sensors and IMU Market Size, 2020-2032
6.5.4 France High-performance Inertial Sensors and IMU Market Size, 2020-2032
6.5.5 U.K. High-performance Inertial Sensors and IMU Market Size, 2020-2032
6.5.6 Italy High-performance Inertial Sensors and IMU Market Size, 2020-2032
6.5.7 Russia High-performance Inertial Sensors and IMU Market Size, 2020-2032
6.5.8 Nordic Countries High-performance Inertial Sensors and IMU Market Size, 2020-2032
6.5.9 Benelux High-performance Inertial Sensors and IMU Market Size, 2020-2032
6.6 Asia
6.6.1 By Region – Asia High-performance Inertial Sensors and IMU Revenue, 2020-2032
6.6.2 By Region – Asia High-performance Inertial Sensors and IMU Sales, 2020-2032
6.6.3 China High-performance Inertial Sensors and IMU Market Size, 2020-2032
6.6.4 Japan High-performance Inertial Sensors and IMU Market Size, 2020-2032
6.6.5 South Korea High-performance Inertial Sensors and IMU Market Size, 2020-2032
6.6.6 Southeast Asia High-performance Inertial Sensors and IMU Market Size, 2020-2032
6.6.7 India High-performance Inertial Sensors and IMU Market Size, 2020-2032
6.7 South America
6.7.1 By Country – South America High-performance Inertial Sensors and IMU Revenue, 2020-2032
6.7.2 By Country – South America High-performance Inertial Sensors and IMU Sales, 2020-2032
6.7.3 Brazil High-performance Inertial Sensors and IMU Market Size, 2020-2032
6.7.4 Argentina High-performance Inertial Sensors and IMU Market Size, 2020-2032
6.8 Middle East & Africa
6.8.1 By Country – Middle East & Africa High-performance Inertial Sensors and IMU Revenue, 2020-2032
6.8.2 By Country – Middle East & Africa High-performance Inertial Sensors and IMU Sales, 2020-2032
6.8.3 Turkey High-performance Inertial Sensors and IMU Market Size, 2020-2032
6.8.4 Israel High-performance Inertial Sensors and IMU Market Size, 2020-2032
6.8.5 Saudi Arabia High-performance Inertial Sensors and IMU Market Size, 2020-2032
6.8.6 UAE High-performance Inertial Sensors and IMU Market Size, 2020-2032
7 Manufacturers & Brands Profiles
7.1 Navgnss
7.1.1 Navgnss Company Summary
7.1.2 Navgnss Business Overview
7.1.3 Navgnss High-performance Inertial Sensors and IMU Major Product Offerings
7.1.4 Navgnss High-performance Inertial Sensors and IMU Sales and Revenue in Global (2020-2025)
7.1.5 Navgnss Key News & Latest Developments
7.2 Avic-gyro
7.2.1 Avic-gyro Company Summary
7.2.2 Avic-gyro Business Overview
7.2.3 Avic-gyro High-performance Inertial Sensors and IMU Major Product Offerings
7.2.4 Avic-gyro High-performance Inertial Sensors and IMU Sales and Revenue in Global (2020-2025)
7.2.5 Avic-gyro Key News & Latest Developments
7.3 SDI
7.3.1 SDI Company Summary
7.3.2 SDI Business Overview
7.3.3 SDI High-performance Inertial Sensors and IMU Major Product Offerings
7.3.4 SDI High-performance Inertial Sensors and IMU Sales and Revenue in Global (2020-2025)
7.3.5 SDI Key News & Latest Developments
7.4 Norinco Group
7.4.1 Norinco Group Company Summary
7.4.2 Norinco Group Business Overview
7.4.3 Norinco Group High-performance Inertial Sensors and IMU Major Product Offerings
7.4.4 Norinco Group High-performance Inertial Sensors and IMU Sales and Revenue in Global (2020-2025)
7.4.5 Norinco Group Key News & Latest Developments
7.5 HY Technology
7.5.1 HY Technology Company Summary
7.5.2 HY Technology Business Overview
7.5.3 HY Technology High-performance Inertial Sensors and IMU Major Product Offerings
7.5.4 HY Technology High-performance Inertial Sensors and IMU Sales and Revenue in Global (2020-2025)
7.5.5 HY Technology Key News & Latest Developments
7.6 Baocheng
7.6.1 Baocheng Company Summary
7.6.2 Baocheng Business Overview
7.6.3 Baocheng High-performance Inertial Sensors and IMU Major Product Offerings
7.6.4 Baocheng High-performance Inertial Sensors and IMU Sales and Revenue in Global (2020-2025)
7.6.5 Baocheng Key News & Latest Developments
7.7 Right M&C
7.7.1 Right M&C Company Summary
7.7.2 Right M&C Business Overview
7.7.3 Right M&C High-performance Inertial Sensors and IMU Major Product Offerings
7.7.4 Right M&C High-performance Inertial Sensors and IMU Sales and Revenue in Global (2020-2025)
7.7.5 Right M&C Key News & Latest Developments
7.8 Chinastar
7.8.1 Chinastar Company Summary
7.8.2 Chinastar Business Overview
7.8.3 Chinastar High-performance Inertial Sensors and IMU Major Product Offerings
7.8.4 Chinastar High-performance Inertial Sensors and IMU Sales and Revenue in Global (2020-2025)
7.8.5 Chinastar Key News & Latest Developments
7.9 Chenxi
7.9.1 Chenxi Company Summary
7.9.2 Chenxi Business Overview
7.9.3 Chenxi High-performance Inertial Sensors and IMU Major Product Offerings
7.9.4 Chenxi High-performance Inertial Sensors and IMU Sales and Revenue in Global (2020-2025)
7.9.5 Chenxi Key News & Latest Developments
7.10 FACRI
7.10.1 FACRI Company Summary
7.10.2 FACRI Business Overview
7.10.3 FACRI High-performance Inertial Sensors and IMU Major Product Offerings
7.10.4 FACRI High-performance Inertial Sensors and IMU Sales and Revenue in Global (2020-2025)
7.10.5 FACRI Key News & Latest Developments
7.11 StarNeto
7.11.1 StarNeto Company Summary
7.11.2 StarNeto Business Overview
7.11.3 StarNeto High-performance Inertial Sensors and IMU Major Product Offerings
7.11.4 StarNeto High-performance Inertial Sensors and IMU Sales and Revenue in Global (2020-2025)
7.11.5 StarNeto Key News & Latest Developments
8 Global High-performance Inertial Sensors and IMU Production Capacity, Analysis
8.1 Global High-performance Inertial Sensors and IMU Production Capacity, 2020-2032
8.2 High-performance Inertial Sensors and IMU Production Capacity of Key Manufacturers in Global Market
8.3 Global High-performance Inertial Sensors and IMU Production by Region
9 Key Market Trends, Opportunity, Drivers and Restraints
9.1 Market Opportunities & Trends
9.2 Market Drivers
9.3 Market Restraints
10 High-performance Inertial Sensors and IMU Supply Chain Analysis
10.1 High-performance Inertial Sensors and IMU Industry Value Chain
10.2 High-performance Inertial Sensors and IMU Upstream Market
10.3 High-performance Inertial Sensors and IMU Downstream and Clients
10.4 Marketing Channels Analysis
10.4.1 Marketing Channels
10.4.2 High-performance Inertial Sensors and IMU Distributors and Sales Agents in Global
11 Conclusion
12 Appendix
12.1 Note
12.2 Examples of Clients
12.3 DisclaimerList of Tables
Table 1. Key Players of High-performance Inertial Sensors and IMU in Global Market
Table 2. Top High-performance Inertial Sensors and IMU Players in Global Market, Ranking by Revenue (2024)
Table 3. Global High-performance Inertial Sensors and IMU Revenue by Companies, (US$, Mn), 2020-2025
Table 4. Global High-performance Inertial Sensors and IMU Revenue Share by Companies, 2020-2025
Table 5. Global High-performance Inertial Sensors and IMU Sales by Companies, (K Units), 2020-2025
Table 6. Global High-performance Inertial Sensors and IMU Sales Share by Companies, 2020-2025
Table 7. Key Manufacturers High-performance Inertial Sensors and IMU Price (2020-2025) & (USD/Unit)
Table 8. Global Manufacturers High-performance Inertial Sensors and IMU Product Type
Table 9. List of Global Tier 1 High-performance Inertial Sensors and IMU Companies, Revenue (US$, Mn) in 2024 and Market Share
Table 10. List of Global Tier 2 and Tier 3 High-performance Inertial Sensors and IMU Companies, Revenue (US$, Mn) in 2024 and Market Share
Table 11. Segment by Type – Global High-performance Inertial Sensors and IMU Revenue, (US$, Mn), 2024 & 2032
Table 12. Segment by Type – Global High-performance Inertial Sensors and IMU Revenue (US$, Mn), 2020-2025
Table 13. Segment by Type – Global High-performance Inertial Sensors and IMU Revenue (US$, Mn), 2026-2032
Table 14. Segment by Type – Global High-performance Inertial Sensors and IMU Sales (K Units), 2020-2025
Table 15. Segment by Type – Global High-performance Inertial Sensors and IMU Sales (K Units), 2026-2032
Table 16. Segment by Application – Global High-performance Inertial Sensors and IMU Revenue, (US$, Mn), 2024 & 2032
Table 17. Segment by Application – Global High-performance Inertial Sensors and IMU Revenue, (US$, Mn), 2020-2025
Table 18. Segment by Application – Global High-performance Inertial Sensors and IMU Revenue, (US$, Mn), 2026-2032
Table 19. Segment by Application – Global High-performance Inertial Sensors and IMU Sales, (K Units), 2020-2025
Table 20. Segment by Application – Global High-performance Inertial Sensors and IMU Sales, (K Units), 2026-2032
Table 21. By Region – Global High-performance Inertial Sensors and IMU Revenue, (US$, Mn), 2025-2032
Table 22. By Region – Global High-performance Inertial Sensors and IMU Revenue, (US$, Mn), 2020-2025
Table 23. By Region – Global High-performance Inertial Sensors and IMU Revenue, (US$, Mn), 2026-2032
Table 24. By Region – Global High-performance Inertial Sensors and IMU Sales, (K Units), 2020-2025
Table 25. By Region – Global High-performance Inertial Sensors and IMU Sales, (K Units), 2026-2032
Table 26. By Country – North America High-performance Inertial Sensors and IMU Revenue, (US$, Mn), 2020-2025
Table 27. By Country – North America High-performance Inertial Sensors and IMU Revenue, (US$, Mn), 2026-2032
Table 28. By Country – North America High-performance Inertial Sensors and IMU Sales, (K Units), 2020-2025
Table 29. By Country – North America High-performance Inertial Sensors and IMU Sales, (K Units), 2026-2032
Table 30. By Country – Europe High-performance Inertial Sensors and IMU Revenue, (US$, Mn), 2020-2025
Table 31. By Country – Europe High-performance Inertial Sensors and IMU Revenue, (US$, Mn), 2026-2032
Table 32. By Country – Europe High-performance Inertial Sensors and IMU Sales, (K Units), 2020-2025
Table 33. By Country – Europe High-performance Inertial Sensors and IMU Sales, (K Units), 2026-2032
Table 34. By Region – Asia High-performance Inertial Sensors and IMU Revenue, (US$, Mn), 2020-2025
Table 35. By Region – Asia High-performance Inertial Sensors and IMU Revenue, (US$, Mn), 2026-2032
Table 36. By Region – Asia High-performance Inertial Sensors and IMU Sales, (K Units), 2020-2025
Table 37. By Region – Asia High-performance Inertial Sensors and IMU Sales, (K Units), 2026-2032
Table 38. By Country – South America High-performance Inertial Sensors and IMU Revenue, (US$, Mn), 2020-2025
Table 39. By Country – South America High-performance Inertial Sensors and IMU Revenue, (US$, Mn), 2026-2032
Table 40. By Country – South America High-performance Inertial Sensors and IMU Sales, (K Units), 2020-2025
Table 41. By Country – South America High-performance Inertial Sensors and IMU Sales, (K Units), 2026-2032
Table 42. By Country – Middle East & Africa High-performance Inertial Sensors and IMU Revenue, (US$, Mn), 2020-2025
Table 43. By Country – Middle East & Africa High-performance Inertial Sensors and IMU Revenue, (US$, Mn), 2026-2032
Table 44. By Country – Middle East & Africa High-performance Inertial Sensors and IMU Sales, (K Units), 2020-2025
Table 45. By Country – Middle East & Africa High-performance Inertial Sensors and IMU Sales, (K Units), 2026-2032
Table 46. Navgnss Company Summary
Table 47. Navgnss High-performance Inertial Sensors and IMU Product Offerings
Table 48. Navgnss High-performance Inertial Sensors and IMU Sales (K Units), Revenue (US$, Mn) and Average Price (USD/Unit) & (2020-2025)
Table 49. Navgnss Key News & Latest Developments
Table 50. Avic-gyro Company Summary
Table 51. Avic-gyro High-performance Inertial Sensors and IMU Product Offerings
Table 52. Avic-gyro High-performance Inertial Sensors and IMU Sales (K Units), Revenue (US$, Mn) and Average Price (USD/Unit) & (2020-2025)
Table 53. Avic-gyro Key News & Latest Developments
Table 54. SDI Company Summary
Table 55. SDI High-performance Inertial Sensors and IMU Product Offerings
Table 56. SDI High-performance Inertial Sensors and IMU Sales (K Units), Revenue (US$, Mn) and Average Price (USD/Unit) & (2020-2025)
Table 57. SDI Key News & Latest Developments
Table 58. Norinco Group Company Summary
Table 59. Norinco Group High-performance Inertial Sensors and IMU Product Offerings
Table 60. Norinco Group High-performance Inertial Sensors and IMU Sales (K Units), Revenue (US$, Mn) and Average Price (USD/Unit) & (2020-2025)
Table 61. Norinco Group Key News & Latest Developments
Table 62. HY Technology Company Summary
Table 63. HY Technology High-performance Inertial Sensors and IMU Product Offerings
Table 64. HY Technology High-performance Inertial Sensors and IMU Sales (K Units), Revenue (US$, Mn) and Average Price (USD/Unit) & (2020-2025)
Table 65. HY Technology Key News & Latest Developments
Table 66. Baocheng Company Summary
Table 67. Baocheng High-performance Inertial Sensors and IMU Product Offerings
Table 68. Baocheng High-performance Inertial Sensors and IMU Sales (K Units), Revenue (US$, Mn) and Average Price (USD/Unit) & (2020-2025)
Table 69. Baocheng Key News & Latest Developments
Table 70. Right M&C Company Summary
Table 71. Right M&C High-performance Inertial Sensors and IMU Product Offerings
Table 72. Right M&C High-performance Inertial Sensors and IMU Sales (K Units), Revenue (US$, Mn) and Average Price (USD/Unit) & (2020-2025)
Table 73. Right M&C Key News & Latest Developments
Table 74. Chinastar Company Summary
Table 75. Chinastar High-performance Inertial Sensors and IMU Product Offerings
Table 76. Chinastar High-performance Inertial Sensors and IMU Sales (K Units), Revenue (US$, Mn) and Average Price (USD/Unit) & (2020-2025)
Table 77. Chinastar Key News & Latest Developments
Table 78. Chenxi Company Summary
Table 79. Chenxi High-performance Inertial Sensors and IMU Product Offerings
Table 80. Chenxi High-performance Inertial Sensors and IMU Sales (K Units), Revenue (US$, Mn) and Average Price (USD/Unit) & (2020-2025)
Table 81. Chenxi Key News & Latest Developments
Table 82. FACRI Company Summary
Table 83. FACRI High-performance Inertial Sensors and IMU Product Offerings
Table 84. FACRI High-performance Inertial Sensors and IMU Sales (K Units), Revenue (US$, Mn) and Average Price (USD/Unit) & (2020-2025)
Table 85. FACRI Key News & Latest Developments
Table 86. StarNeto Company Summary
Table 87. StarNeto High-performance Inertial Sensors and IMU Product Offerings
Table 88. StarNeto High-performance Inertial Sensors and IMU Sales (K Units), Revenue (US$, Mn) and Average Price (USD/Unit) & (2020-2025)
Table 89. StarNeto Key News & Latest Developments
Table 90. High-performance Inertial Sensors and IMU Capacity of Key Manufacturers in Global Market, 2023-2025 (K Units)
Table 91. Global High-performance Inertial Sensors and IMU Capacity Market Share of Key Manufacturers, 2023-2025
Table 92. Global High-performance Inertial Sensors and IMU Production by Region, 2020-2025 (K Units)
Table 93. Global High-performance Inertial Sensors and IMU Production by Region, 2026-2032 (K Units)
Table 94. High-performance Inertial Sensors and IMU Market Opportunities & Trends in Global Market
Table 95. High-performance Inertial Sensors and IMU Market Drivers in Global Market
Table 96. High-performance Inertial Sensors and IMU Market Restraints in Global Market
Table 97. High-performance Inertial Sensors and IMU Raw Materials
Table 98. High-performance Inertial Sensors and IMU Raw Materials Suppliers in Global Market
Table 99. Typical High-performance Inertial Sensors and IMU Downstream
Table 100. High-performance Inertial Sensors and IMU Downstream Clients in Global Market
Table 101. High-performance Inertial Sensors and IMU Distributors and Sales Agents in Global Market

List of Figures
Figure 1. High-performance Inertial Sensors and IMU Product Picture
Figure 2. High-performance Inertial Sensors and IMU Segment by Type in 2024
Figure 3. High-performance Inertial Sensors and IMU Segment by Application in 2024
Figure 4. Global High-performance Inertial Sensors and IMU Market Overview: 2024
Figure 5. Key Caveats
Figure 6. Global High-performance Inertial Sensors and IMU Market Size: 2024 VS 2032 (US$, Mn)
Figure 7. Global High-performance Inertial Sensors and IMU Revenue: 2020-2032 (US$, Mn)
Figure 8. High-performance Inertial Sensors and IMU Sales in Global Market: 2020-2032 (K Units)
Figure 9. The Top 3 and 5 Players Market Share by High-performance Inertial Sensors and IMU Revenue in 2024
Figure 10. Segment by Type – Global High-performance Inertial Sensors and IMU Revenue, (US$, Mn), 2024 & 2032
Figure 11. Segment by Type – Global High-performance Inertial Sensors and IMU Revenue Market Share, 2020-2032
Figure 12. Segment by Type – Global High-performance Inertial Sensors and IMU Sales Market Share, 2020-2032
Figure 13. Segment by Type – Global High-performance Inertial Sensors and IMU Price (USD/Unit), 2020-2032
Figure 14. Segment by Application – Global High-performance Inertial Sensors and IMU Revenue, (US$, Mn), 2024 & 2032
Figure 15. Segment by Application – Global High-performance Inertial Sensors and IMU Revenue Market Share, 2020-2032
Figure 16. Segment by Application – Global High-performance Inertial Sensors and IMU Sales Market Share, 2020-2032
Figure 17. Segment by Application -Global High-performance Inertial Sensors and IMU Price (USD/Unit), 2020-2032
Figure 18. By Region – Global High-performance Inertial Sensors and IMU Revenue, (US$, Mn), 2025 & 2032
Figure 19. By Region – Global High-performance Inertial Sensors and IMU Revenue Market Share, 2020 VS 2024 VS 2032
Figure 20. By Region – Global High-performance Inertial Sensors and IMU Revenue Market Share, 2020-2032
Figure 21. By Region – Global High-performance Inertial Sensors and IMU Sales Market Share, 2020-2032
Figure 22. By Country – North America High-performance Inertial Sensors and IMU Revenue Market Share, 2020-2032
Figure 23. By Country – North America High-performance Inertial Sensors and IMU Sales Market Share, 2020-2032
Figure 24. United States High-performance Inertial Sensors and IMU Revenue, (US$, Mn), 2020-2032
Figure 25. Canada High-performance Inertial Sensors and IMU Revenue, (US$, Mn), 2020-2032
Figure 26. Mexico High-performance Inertial Sensors and IMU Revenue, (US$, Mn), 2020-2032
Figure 27. By Country – Europe High-performance Inertial Sensors and IMU Revenue Market Share, 2020-2032
Figure 28. By Country – Europe High-performance Inertial Sensors and IMU Sales Market Share, 2020-2032
Figure 29. Germany High-performance Inertial Sensors and IMU Revenue, (US$, Mn), 2020-2032
Figure 30. France High-performance Inertial Sensors and IMU Revenue, (US$, Mn), 2020-2032
Figure 31. U.K. High-performance Inertial Sensors and IMU Revenue, (US$, Mn), 2020-2032
Figure 32. Italy High-performance Inertial Sensors and IMU Revenue, (US$, Mn), 2020-2032
Figure 33. Russia High-performance Inertial Sensors and IMU Revenue, (US$, Mn), 2020-2032
Figure 34. Nordic Countries High-performance Inertial Sensors and IMU Revenue, (US$, Mn), 2020-2032
Figure 35. Benelux High-performance Inertial Sensors and IMU Revenue, (US$, Mn), 2020-2032
Figure 36. By Region – Asia High-performance Inertial Sensors and IMU Revenue Market Share, 2020-2032
Figure 37. By Region – Asia High-performance Inertial Sensors and IMU Sales Market Share, 2020-2032
Figure 38. China High-performance Inertial Sensors and IMU Revenue, (US$, Mn), 2020-2032
Figure 39. Japan High-performance Inertial Sensors and IMU Revenue, (US$, Mn), 2020-2032
Figure 40. South Korea High-performance Inertial Sensors and IMU Revenue, (US$, Mn), 2020-2032
Figure 41. Southeast Asia High-performance Inertial Sensors and IMU Revenue, (US$, Mn), 2020-2032
Figure 42. India High-performance Inertial Sensors and IMU Revenue, (US$, Mn), 2020-2032
Figure 43. By Country – South America High-performance Inertial Sensors and IMU Revenue Market Share, 2020-2032
Figure 44. By Country – South America High-performance Inertial Sensors and IMU Sales, Market Share, 2020-2032
Figure 45. Brazil High-performance Inertial Sensors and IMU Revenue, (US$, Mn), 2020-2032
Figure 46. Argentina High-performance Inertial Sensors and IMU Revenue, (US$, Mn), 2020-2032
Figure 47. By Country – Middle East & Africa High-performance Inertial Sensors and IMU Revenue, Market Share, 2020-2032
Figure 48. By Country – Middle East & Africa High-performance Inertial Sensors and IMU Sales, Market Share, 2020-2032
Figure 49. Turkey High-performance Inertial Sensors and IMU Revenue, (US$, Mn), 2020-2032
Figure 50. Israel High-performance Inertial Sensors and IMU Revenue, (US$, Mn), 2020-2032
Figure 51. Saudi Arabia High-performance Inertial Sensors and IMU Revenue, (US$, Mn), 2020-2032
Figure 52. UAE High-performance Inertial Sensors and IMU Revenue, (US$, Mn), 2020-2032
Figure 53. Global High-performance Inertial Sensors and IMU Production Capacity (K Units), 2020-2032
Figure 54. The Percentage of Production High-performance Inertial Sensors and IMU by Region, 2024 VS 2032
Figure 55. High-performance Inertial Sensors and IMU Industry Value Chain
Figure 56. Marketing Channels