MARKET INSIGHTS
The global Herriott Cell Market size was valued at US$ 67 million in 2024 and is projected to reach US$ 89 million by 2032, at a CAGR of 4.1% during the forecast period 2025-2032. The U.S. currently holds the largest market share at 32%, followed by China with 18% market penetration.
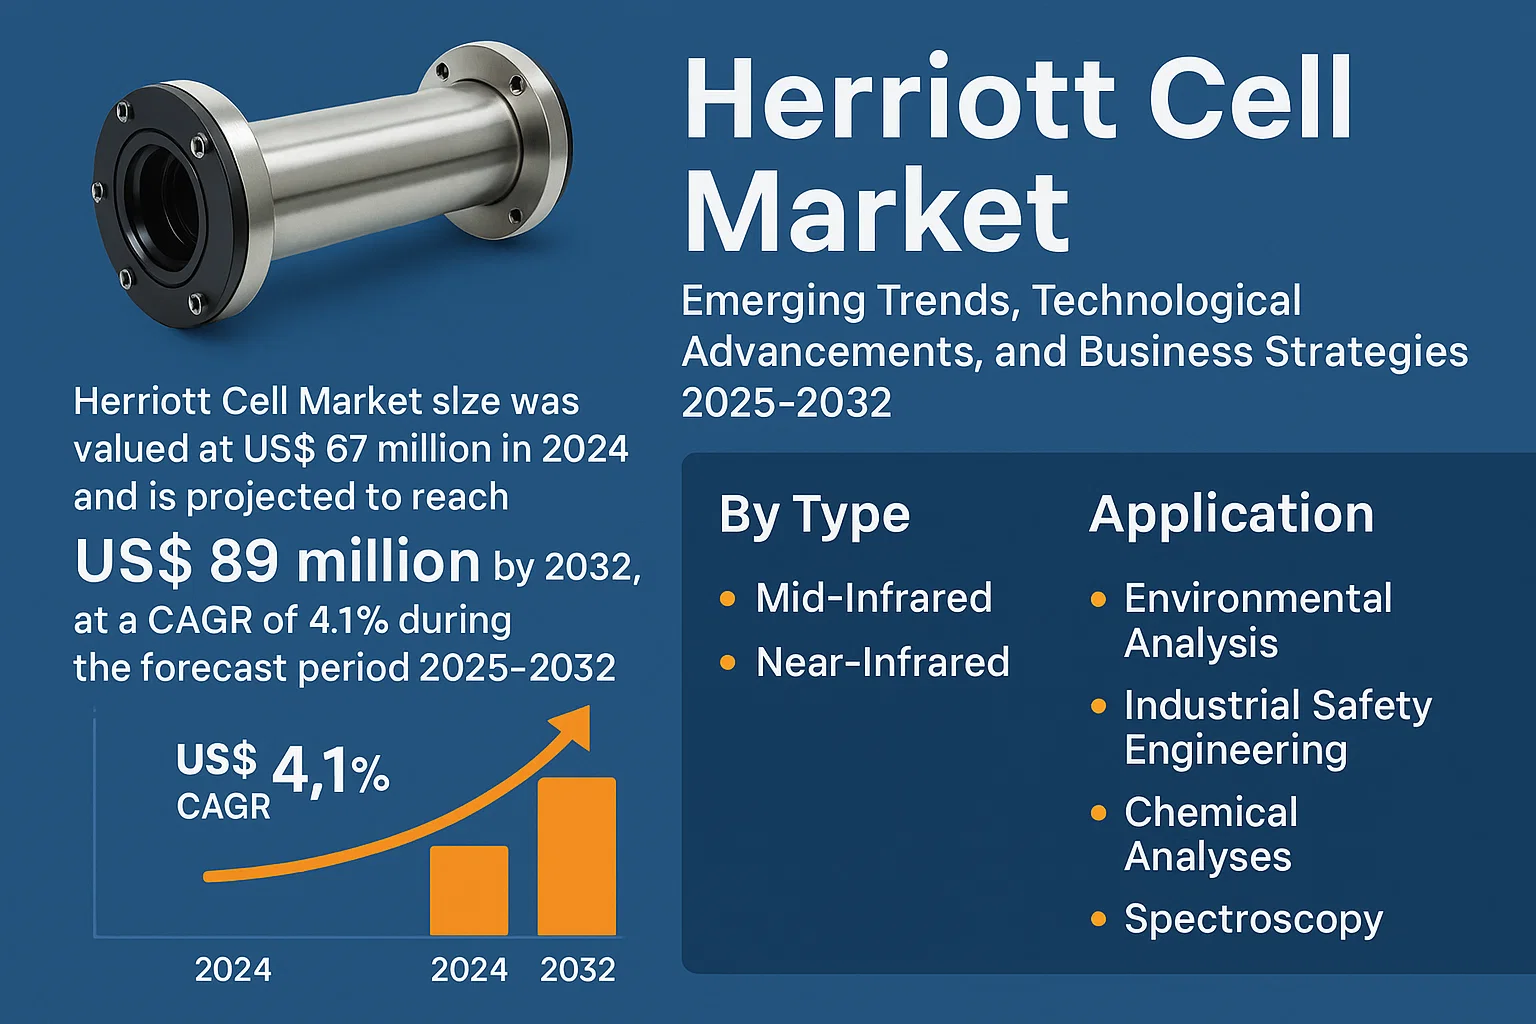
The Herriott cell is an optical delay line device consisting of two precisely aligned spherical mirrors, first developed at Bell Laboratories in 1965. This configuration creates multiple beam reflections within the cavity, significantly extending the effective optical path length while maintaining compact physical dimensions. The technology finds applications in environmental analysis, industrial safety monitoring, and advanced spectroscopy systems due to its superior light-trapping efficiency compared to alternative designs.
Market growth is driven by increasing adoption in infrared gas sensing applications, with the mid-infrared segment expected to grow at 6.3% CAGR through 2032. Key industry players including Thorlabs and HORIBA are expanding their product portfolios, while emerging applications in quantum computing research present new opportunities. Recent developments include Mesa Photonics’ 2023 launch of ultra-stable Herriott cells for precision laser spectroscopy, addressing demand from environmental monitoring sectors.
MARKET DYNAMICS
MARKET DRIVERS
Rising Demand for High-Precision Spectroscopy to Accelerate Market Adoption
The global spectroscopy market is experiencing significant growth due to increasing applications in pharmaceutical quality control, environmental monitoring, and industrial process analysis. Herriott cells play a critical role in enhancing spectroscopic resolution and sensitivity, particularly in trace gas detection and molecular absorption measurements. Recent technological advancements have improved their optical path length stability to within ±0.01%, making them indispensable for research requiring ultra-high precision. The Mid-Infrared segment, where Herriott cells excel, is projected to grow at a compound annual growth rate exceeding 6.5% through 2032, driven by demand from chemical analysis and emission monitoring applications.
Expansion of Environmental Monitoring Applications to Fuel Market Growth
Governments worldwide are implementing stricter environmental regulations, particularly concerning greenhouse gas emissions and industrial pollutants. Herriott cells enable sensitive detection of trace gases at parts-per-billion levels, making them essential for compliance monitoring systems. The environmental analysis segment currently accounts for nearly 32% of Herriott cell applications, with deployment in both stationary monitoring stations and mobile measurement platforms. Recent developments include integration with quantum cascade lasers for real-time monitoring of methane leaks in oil and gas operations, where detection sensitivity requirements continue to become more stringent.
➤ Industrial safety regulations now mandate continuous emissions monitoring across multiple sectors, with penalty structures creating strong compliance incentives for precision measurement technologies.
Furthermore, the miniaturization of optical components allows modern Herriott cells to maintain performance while reducing footprint by approximately 40% compared to decade-old designs. This enables their deployment in space-constrained environments without compromising measurement accuracy—a key advancement driving broader industrial adoption.
MARKET RESTRAINTS
High Sensitivity to Mechanical Vibrations Limits Field Deployment Capabilities
While Herriott cells offer superior optical performance, their multi-pass design makes them inherently sensitive to mechanical disturbances. Even minor vibrations can degrade signal quality by disrupting the precise mirror alignment required for optimal light path stability. This challenge becomes particularly problematic in industrial settings where vibration isolation isn’t always practical. Current mitigation strategies, including active alignment systems and vibration-damping mounts, can increase system costs by 15-25%, creating barriers for price-sensitive applications.
Other Restraints
Alignment Complexity
Initial alignment procedures require technical expertise and specialized equipment, with typical setup times ranging from 30-90 minutes depending on the application. Misalignment can reduce effective path length by up to 60%, significantly impacting measurement accuracy.
Thermal Instability
Temperature fluctuations as small as ±2°C can cause mirror spacing variations that alter the optical path length. While temperature-stabilized enclosures are available, they add substantial cost and complexity to deployment scenarios requiring portable or field-hardened solutions.
MARKET CHALLENGES
Competition from Alternative Measurement Technologies Pressures Market Position
Cavity ring-down spectroscopy (CRDS) and Fourier-transform infrared (FTIR) systems continue to gain market share in trace gas detection applications. These alternatives offer comparable sensitivity without the alignment challenges of Herriott cells, though typically at higher equipment costs. Recent pricing pressures have reduced the CRDS price premium to just 25-30% above equivalent Herriott-based systems, narrowing the traditional cost advantage. The spectroscopy equipment market demonstrates particularly strong price sensitivity, with approximately 65% of purchasing decisions influenced by total cost of ownership rather than upfront pricing.
Emerging Technology Competition
Photonic integrated circuits are beginning to enter the market, promising compact, alignment-free operation for certain applications. While currently limited to specific wavelength ranges, their development trajectory threatens to erode the Herriott cell’s position in portable and field-deployable systems.
Maintenance Requirements
Regular mirror cleaning and re-alignment creates ongoing operational costs that many end-users factor into purchasing decisions. In harsh industrial environments, maintenance intervals may shorten to as little as three months, increasing lifecycle costs by an estimated 40% compared to laboratory use scenarios.
MARKET OPPORTUNITIES
Emerging Quantum Technology Applications Open New Market Frontiers
Quantum sensing and communication systems increasingly require stable optical resonators with precisely controlled path lengths—parameters where Herriott cells excel. The quantum technology market is projected to grow at over 30% CAGR through 2030, creating substantial demand for compatible optical components. Recent breakthroughs in cold atom physics leverage Herriott configurations for atom interferometry, with potential applications ranging from inertial navigation to fundamental physics research.
Customized Solutions for Niche Applications Present Margin Enhancement Potential
While standard Herriott cells face pricing pressures, customized configurations for specialized applications command premium pricing with gross margins 20-35% higher than off-the-shelf products. Examples include ultra-high vacuum compatible designs for surface science research and radiation-hardened variants for space applications. The scientific research segment demonstrates particular willingness to pay for application-specific optimizations, accounting for nearly 45% of premium product sales despite representing only 22% of total unit volume.
➤ Leading manufacturers report that customized solutions now generate over 60% of total revenue from Herriott cell products, highlighting the market’s shift toward specialized applications.
Furthermore, integration with emerging laser technologies such as optical frequency combs creates opportunities in precision metrology. These advanced systems require stability and precision that aligns perfectly with Herriott cell capabilities, particularly for applications demanding sub-picometer wavelength resolution across extended measurement periods.
Technological Advancements in Spectroscopy Driving Herriott Cell Demand
The global Herriott Cell market has witnessed substantial growth, fueled by advancements in optical spectroscopy technologies. Originally developed in 1965, the Herriott cell’s unique design enables multiple beam traversals between precisely aligned spherical mirrors, making it indispensable for sensitive absorption measurements. Recent improvements in mirror coatings, alignment techniques, and manufacturing tolerances have enhanced performance, with modern cells achieving path lengths exceeding 100 meters while maintaining compact footprints. The precision offered by these systems has become critical for applications ranging from environmental monitoring to industrial gas analysis, with the market projected to grow at a steady CAGR through 2032.
Other Trends
Expanding Environmental Monitoring Applications
Regulatory pressures and climate change concerns have accelerated the adoption of Herriott cells in environmental analysis systems. These optical devices enable highly sensitive detection of trace gases like methane, carbon dioxide, and volatile organic compounds at parts-per-billion levels. New monitoring networks deploying Herriott cell-based sensors now provide real-time air quality data across urban and industrial areas. While traditional applications focused on laboratory analysis, field-deployable systems have emerged as a significant growth segment, with ruggedized designs enabling operation in harsh environments from Arctic research stations to volcanic monitoring sites.
Industrial Process Control Driving Innovation
The industrial sector has emerged as a key driver for Herriott cell adoption, particularly in process safety and quality control applications. Chemical plants, refineries, and semiconductor manufacturers increasingly utilize these optical systems for continuous emission monitoring and leak detection. The ability to simultaneously measure multiple gas species with high sensitivity has proven invaluable for optimizing industrial processes while maintaining regulatory compliance. Recent innovations include integrated systems combining Herriott cells with quantum cascade lasers, enabling mid-infrared spectroscopy capabilities critical for detecting complex industrial pollutants. Market analysis indicates that industrial safety applications currently account for nearly 35% of total Herriott cell deployments worldwide.
The production landscape remains concentrated among specialized optical manufacturers, with Asia-Pacific emerging as both a manufacturing hub and high-growth market. While traditional applications continue to dominate, emerging uses in breath analysis for medical diagnostics and space exploration instrumentation demonstrate the technology’s versatility. However, the market faces challenges including the need for skilled operators and competition from alternative spectroscopic techniques, though the unique advantages of Herriott cell configurations maintain their position as the gold standard for many precision measurement applications.
COMPETITIVE LANDSCAPE
Key Industry Players
Optical Technology Leaders Compete Through Innovation in Spectroscopy Applications
The global Bioanalytical Technologies market is moderately consolidated, with established players and emerging specialists competing across spectroscopy and analytical instrumentation segments. Thorlabs dominates the Herriott Cell market with an estimated 22% revenue share in 2024, leveraging its comprehensive photonics product ecosystem and direct sales infrastructure across 20+ countries.
HORIBA follows closely with 18% market share, capitalizing on its strong position in analytical instruments and strategic acquisitions like the 2023 purchase of Photon etc. Japan-based manufacturers like Ely Optics maintain technological leadership in precision mirror coatings, contributing to their 12% market presence despite higher product costs.
Recent developments show accelerated competition in parametric customization. Mesa Photonics launched adjustable-length Herriott cells in Q1 2024, while Port City Instruments introduced humidity-resistant models for harsh industrial environments. These innovations aim to capture growing demand from environmental monitoring sectors, projected to grow at 8.7% CAGR through 2030.
Meanwhile, HealthyPhoton and Koiné are reshaping the competitive landscape through nanotechnology integration. Their graphene-coated mirror versions demonstrate 15% longer lifespan in corrosive gas analysis applications – a critical advancement for chemical plant safety systems.
List of Key Herriott Cell Manufacturers
- Thorlabs (U.S.) – Market leader in modular optical systems
- Mesa Photonics (U.S.) – Specialty in industrial-grade cells
- Ely Optics (Japan) – Precision optics manufacturer
- HORIBA (Japan) – Analytical instrumentation conglomerate
- Photonics Technologies (Germany) – Research-focused solutions
- Port City Instruments (U.S.) – Custom configuration specialist
- HealthyPhoton (China) – Emerging nanotechnology innovator
- Koiné (Italy) – High-end spectroscopy components
Segment Analysis:
By Type
Mid-Infrared Segment Leads Market Growth Due to High Demand in Spectroscopy Applications
The market is segmented based on type into:
- Mid-Infrared
- Near-Infrared
- Others
By Application
Spectroscopy Application Dominates Driven by Precision Measurement Requirements
The market is segmented based on application into:
- Environmental Analysis
- Industrial Safety Engineering
- Chemical Analyses
- Spectroscopy
By Technology
Multi-Pass Configurations Gaining Traction for Enhanced Sensitivity
The market is segmented based on technology into:
- Single-Pass Systems
- Multi-Pass Systems
By End User
Research Laboratories Account for Significant Adoption
The market is segmented based on end user into:
- Research Laboratories
- Industrial Facilities
- Environmental Monitoring Agencies
Regional Analysis: Herriott Cell Market
North America
The North American Herriott Cell market is driven by advanced research infrastructure and strong investments in spectroscopy applications across environmental monitoring, industrial safety, and chemical analysis sectors. The U.S. accounts for the largest revenue share in the region, supported by government-funded initiatives in scientific research and a concentration of key manufacturers such as Thorlabs and Mesa Photonics. While demand for mid-infrared Herriott cells is rising in defense and aerospace applications, stringent regulatory standards for precision instrumentation also influence product development. However, high production costs and limited adoption in smaller-scale laboratories remain challenges. The growing emphasis on climate monitoring technologies presents significant opportunities for market expansion.
Europe
Europe demonstrates steady growth in Herriott Cell adoption due to its well-established spectroscopy industry and stringent quality standards for analytical instruments. Germany and the U.K. lead regional demand, with HORIBA and Koiné being prominent suppliers catering to pharmaceutical and environmental testing applications. EU regulations promoting emission monitoring and industrial process control further boost market prospects. A notable trend is the integration of Herriott cells with compact FTIR spectrometers for portable gas analysis solutions. Nonetheless, competition from alternative optical cavity technologies and slower replacement cycles in academic research institutions moderate growth potentials.
Asia-Pacific
The Asia-Pacific region exhibits the fastest growth rate, propelled by expanding industrialization and increasing government investments in scientific infrastructure. China dominates regional consumption owing to its thriving manufacturing sector and growing adoption in chemical process monitoring. India and Southeast Asian nations are emerging markets, with demand fueled by environmental regulations and expanding petrochemical industries. Price sensitivity drives preference for cost-effective near-infrared Herriott cells, though mid-infrared variants gain traction in specialized applications. Local manufacturers are increasing production capabilities, but quality inconsistencies compared to Western brands remain a concern. The region’s growth is further supported by rising R&D expenditures in Japan and South Korea.
South America
South America’s Herriott Cell market is in developing stages, with Brazil and Argentina representing key demand centers primarily for environmental analysis applications. Mining and oil extraction industries drive adoption for gas detection systems, though economic instability frequently disrupts procurement cycles. The lack of local manufacturing forces reliance on imports from North American and European suppliers, resulting in higher end-user costs. While academic and research institutions show growing interest, limited funding for advanced optical equipment constrains market penetration. Nonetheless, gradual improvements in industrial automation and environmental monitoring regulations suggest long-term growth opportunities.
Middle East & Africa
This region presents a niche but growing market, with demand concentrated in oil-rich Gulf nations and South Africa’s mining sector. Herriott cells are primarily used in process monitoring and safety systems within petrochemical plants, with the UAE and Saudi Arabia being the main adopters. High equipment costs and lack of technical expertise in optical systems hinder wider adoption across other industries. Infrastructure development for air quality monitoring networks offers potential, though political instability and inconsistent regulatory frameworks in parts of Africa limit market predictability. Partnerships between global suppliers and local distributors are gradually improving product accessibility across the region.
Report Scope
This market research report provides a comprehensive analysis of the global and regional Herriott Cell markets, covering the forecast period 2024–2032. It offers detailed insights into market dynamics, technological advancements, competitive landscape, and key trends shaping the industry.
Key focus areas of the report include:
- Market Size & Forecast: Historical data and future projections for revenue, unit shipments, and market value across major regions and segments. The Global Herriott Cell market was valued at USD million in 2024 and is projected to reach USD million by 2032.
- Segmentation Analysis: Detailed breakdown by product type (Mid-Infrared, Near-Infrared, Others) and application (Environmental Analysis, Industrial Safety Engineering, Chemical Analyses, Spectroscopy) to identify high-growth segments.
- Regional Outlook: Insights into market performance across North America, Europe, Asia-Pacific, Latin America, and Middle East & Africa, including country-level analysis. The U.S. market is estimated at USD million in 2024, while China is projected to reach USD million.
- Competitive Landscape: Profiles of leading market participants including Thorlabs, Mesa Photonics, Ely Optics, HORIBA, and others, covering their product offerings, market share, and recent developments.
- Technology Trends & Innovation: Assessment of optical measurement technologies, spectroscopy advancements, and evolving industry standards in Herriott Cell applications.
- Market Drivers & Restraints: Evaluation of factors driving market growth along with challenges in manufacturing precision optics and regulatory requirements.
- Stakeholder Analysis: Insights for component suppliers, OEMs, research institutions, and investors regarding strategic opportunities in spectroscopy and analytical instrumentation.
The research employs primary and secondary methods including expert interviews, verified market data, and manufacturer surveys to ensure accuracy and reliability of insights.
FREQUENTLY ASKED QUESTIONS:
What is the current market size of Global Herriott Cell Market?
-> The global Herriott Cell size was valued at US$ 67 million in 2024 and is projected to reach US$ 89 million by 2032, at a CAGR of 4.1% during the forecast period 2025-2032.
Which key companies operate in Global Herriott Cell Market?
-> Key players include Thorlabs, Mesa Photonics, Ely Optics, HORIBA, Photonics Technologies, Port City Instruments, HealthyPhoton, and Koiné.
What are the key growth drivers?
-> Key growth drivers include increasing demand for precision spectroscopy, environmental monitoring applications, and advancements in optical measurement technologies.
Which region dominates the market?
-> North America currently leads the market, while Asia-Pacific is expected to show the fastest growth during the forecast period.
What are the emerging trends?
-> Emerging trends include miniaturization of optical cells, integration with quantum technologies, and development of multi-pass systems for enhanced sensitivity.

Get Sample Report PDF for Exclusive Insights
Report Sample Includes
- Table of Contents
- List of Tables & Figures
- Charts, Research Methodology, and more...


