
Vehicle LCD Screen Market Insights
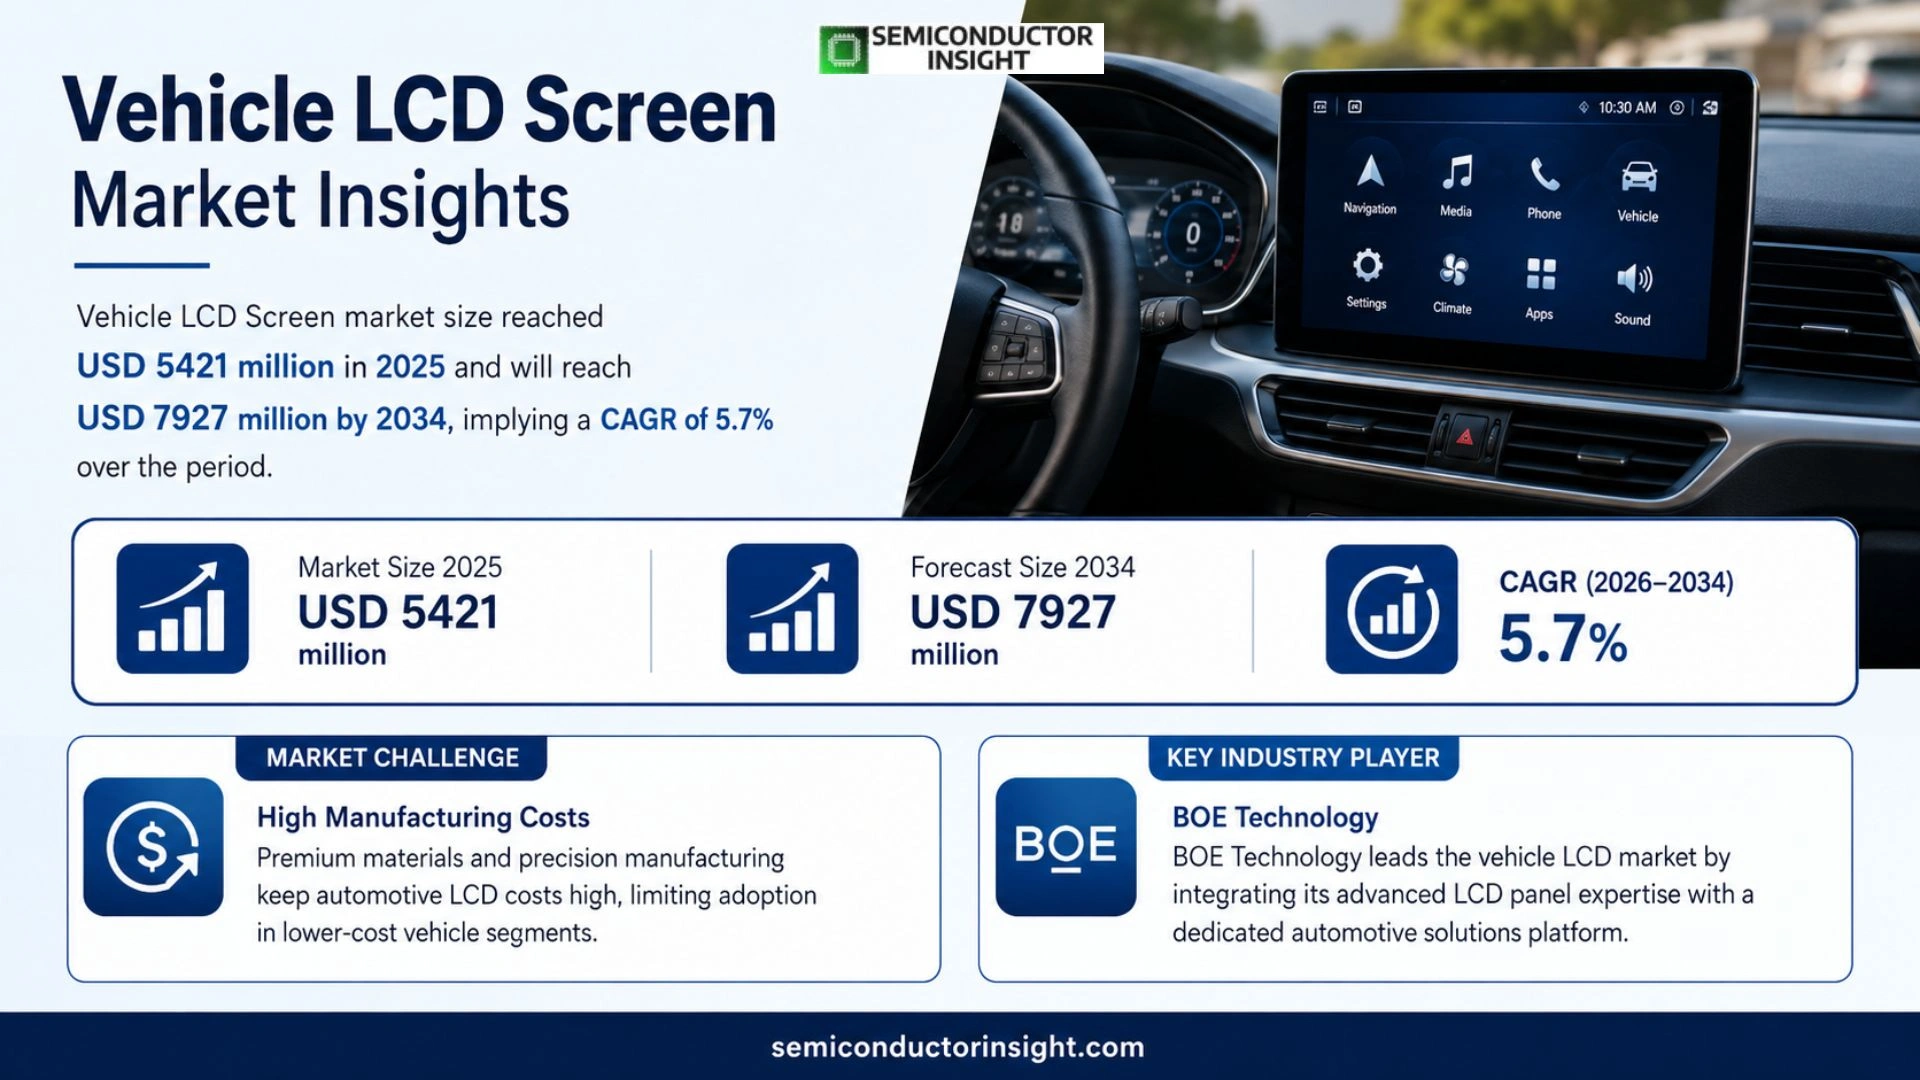
Vehicle LCD Screen market size reached USD 5421 million in 2025 and will reach USD 7927 million by 2034, implying a CAGR of 5.7% over the period.
A Vehicle LCD Screen is a liquid crystal display used in vehicles to present visual information such as speed indicators, navigation maps, entertainment graphics, rear‑view camera feeds and system status alerts. These screens are typically installed in instrument clusters, center consoles, head‑up displays and rear‑seat entertainment units. Built for automotive durability they offer high brightness levels, wide temperature tolerance ranges, vibration resistance and anti‑glare or anti‑reflective coatings for optimal visibility under direct sunlight. Technological options include TFT (Thin‑Film Transistor), IPS (In‑Plane Switching) and LTPS (Low‑Temperature Poly‑Silicon) panels,each delivering higher resolution while maintaining energy efficiency essential for driver safety and user experience.
MARKET DRIVERS
Demand for Advanced Driver‑Assist Features
Automakers increasingly embed Vehicle LCD Screen Market components to deliver real‑time safety data,lane‑departure alerts, collision warnings, and adaptive cruise controls,within a single visual stream. The convergence of high‑resolution displays with sophisticated sensor arrays enables drivers to interpret critical information without diverting attention from the road, reinforcing a safety‑first ethos that stakeholders aggressively pursue.
Technological Convergence in Automotive Electronics
Miniaturized, high‑brightness modules that support wide viewing angles are now being integrated into every vehicle cabin. The ability to merge infotainment, navigation, and vehicle diagnostics onto a unified interface drives buyers toward models with advanced interior displays, shifting purchasing power toward manufacturers that supply cutting‑edge LCD solutions.
➤ “Smart interfaces are redefining the driver‑vehicle relationship, positioning display modules as central to the future of mobility.”
With production volumes for high‑definition panels projected to increase steadily, Vehicle LCD Screen Market is poised to capture a larger share of the in‑car electronics pipeline, delivering value across both premium and mainstream platforms.
MARKET CHALLENGES
High Manufacturing Costs
Even as consumer demand rises, the premium materials and precision manufacturing required for automotive‑grade LCDs keep unit costs above industry averages. This price sensitivity constrains adoption in lower‑cost vehicle segments, compelling suppliers to explore alternative cost‑reduction strategies.
Quality assurance processes, including thermal stability testing and vibration tolerance, add to production complexity. Suppliers must invest in robust validation protocols, which further elevate the overall bill of materials.
Other Challenges
Regulatory Compliance
Compliance with stringent electromagnetic interference (EMI) standards and automotive safety certifications remains a stringent hurdle. Manufacturers need to invest in sophisticated testing infrastructure to meet global regulatory thresholds.
MARKET RESTRAINTS
Market Penetration Constraints
Distribution bottlenecks, especially in emerging economies, limit the reach of high‑performance displays. Coupled with a reliance on brand‑specific sourcing agreements, the pace at which new models roll out can delay the integration of next‑generation LCDs across the fleet.
Moreover, the strategic alignment required between OEMs and component suppliers can slow down joint development cycles, squeezing the time window available for innovation deployment.
MARKET OPPORTUNITIES
Growing Smart‑Vehicle Infrastructure
The expansion of connected‑car ecosystems, driven by 5G deployments and edge‑computing gateways, opens pathways for richer, context‑aware display content. Opportunities arise for suppliers to develop adaptive, user‑centric interfaces that harness real‑time vehicle data to improve driving comfort and safety. Such capabilities position Vehicle LCD Screen Market players to capture premium margins and secure long‑term partnership agreements with OEMs seeking to differentiate their brand through innovative cabin experiences.
Vehicle LCD Screen Market Trends
Adoption of Mini‑LED and LTPS TFT for Superior Contrast and Efficiency
The transition from conventional analog dials to embedded liquid‑crystal displays has become a defining shift in the vehicle display industry. Recent deployments showcase a move toward automotive‑grade LTPS TFT panels, which offer sharper resolution, slimmer form factors, and lower power draw compared with legacy amorphous‑silicon modules. Simultaneously, Mini‑LED local dimming,often paired with quantum‑dot filters,has been increasingly adopted to bridge the contrast gap while maintaining the longstanding brightness and longevity advantages of LCD technology. OEMs are integrating these higher‑end panels across instrument clusters, center consoles and head‑up displays, using the expanded visual surface to embed richer navigational overlays, media controls and safety alerts within a unified cockpit canvas. This convergence also sets the stage for quantum‑dot‑incorporated displays that can deliver true HDR without the cost of OLED.
Other Trends
Cockpit Surface Transformation
The eye‑catching pillar‑to‑pillar and panoramic dashboards that appear in premium electrified models signal a departure from isolated infotainment panels toward a continuous, gesture‑friendly cockpit. By weaving display real estate across the steering column, dashboard spine, and rear seat, manufacturers create a single visual narrative that communicates critical information without interrupting the driver’s line of sight. This holistic approach demands tighter coordination between display suppliers and HMI designers, as the integration of touch surfaces, voice recognition and over‑the‑air updates becomes essential for a cohesive user journey.
Emergence of Modular Cockpit Platforms
Parallel to surface integration, the rise of modular cockpit platforms allows OEMs to swap entire display arrays during design cycles, accelerating vehicle updates and facilitating hardware‑in‑the‑loop testing. These modules, comprising pre‑wired LTPS or Mini‑LED panels with frame‑synchronisation chips, simplify factory wiring and enable rapid post‑market upgrades. As upgrades become a competitive differentiator, suppliers that offer plug‑and‑play modules with firmware‑upgrade paths position themselves as strategic partners rather than mere component vendors.
Regulatory Pressure and HMI Simplification
Over the past three years, tightening road‑safety regulations, notably the EU’s mandatory advanced driver‑distraction warning platform and the Euro NCAP’s reward system for reduced eyes‑off‑road time, have re‑shaped HMI strategy. OEMs now prioritise interfaces that minimise visual clutter, often adopting colour‑coded icons, reduced font sizes and adaptive brightness to keep drivers focused. Coupled with the development of dual‑mode head‑up displays that overlay essential data onto the driver’s view, the emphasis is on delivering context‑aware information that can be perceived from the periphery, thereby reducing cognitive load without compromising safety. Furthermore, these changes drive a shift toward longer‑term supplier relationships, compelling vendors to invest in shared UI development toolkits to reduce integration time and maintain competitive differentiation.
COMPETITIVE LANDSCAPE
Key Industry Players
Vehicle LCD Screen Market
BOE Technology dominates the vehicle LCD segment by consolidating its extensive LCD panel capabilities with a dedicated automotive renders platform. Its ability to tailor LTPS TFT panels to northern European OEM specifications,toughened for 100 °C thermal margins and ultra‑low power consumption,has secured contracts with Tier‑1 suppliers such as Bosch and Continental. The company’s vertical integration, from glass substrates to driver ICs, enables rapid iteration on pedal‑level display size constraints, making it a preferred partner for manufacturers targeting plug‑in hybrid and electric vehicles where form factor compression is critical.
Complementing BOE’s lead, niche but influential firms are reshaping the aftermarket through targeted technological advances. Tianma Microelectronics has accelerated adoption of Mini‑LED local dimming, achieving HDR‑like contrast while preserving LCD lifetime integrity. LG Display pairs its ultra‑thin IPS modules with integrated touch layering, facilitating “click‑to‑control” cockpit surfaces without interrupting visual experience. Innolux leverages its joint venture with JDI to push higher pixel density IPS panels, while InfoVision Optoelectronics focuses on optical bonding techniques that reduce glare under automotive head‑up displays. These players often collaborate with Tier‑1 suppliers to embed safety‑critical driver information, reinforcing the trend toward software‑defined interiors.
List of Key Vehicle LCD Screen Companies Profiled
- BOE Technology, TCL China Star Optoelectronics, JDI, Sharp
- Tianma Microelectronics, LG Display, Innolux, Caihong Display Devices
- InfoVision Optoelectronics, DOER, Crystal, VisionTech, Panasonic, Samsung Electronics, Sony
Segment Analysis:
| Segment Category | Sub-Segments | Key Insights |
| By Type |
|
LTPS-LCD offers superior resolution, reduced form factor, and energy efficiency, enabling lightweight, high‑definition displays in premium and commercial vehicles. Integration of thin, high‑contrast panels enhances driver engagement and safety while supporting future software‑defined interiors. Its advanced manufacturing yields higher durability under automotive conditions including vibration and temperature extremes, providing a compelling advantage in high‑end infotainment and instrument cluster applications. Adoption is growing as OEMs demand larger, sharper screens that maintain battery life. |
| By Application |
|
Center Display occupies the driver’s focal area, delivering real‑time information, navigation, and entertainment. Seamless integration with device connectivity, voice‑assistant, and over‑the‑air updates fosters a cohesive user experience. OEMs prioritize ergonomics, adaptive lighting, and intuitive touch interfaces in center displays, aligning with trends toward safer, distraction‑reduced HMI designs that meet evolving regulatory standards on driver‑distraction warnings. |
| By End User |
|
Electric Vehicle demands integrated, high‑resolution displays that manage power consumption while providing rich multimedia and battery‑fare monitoring. Large, high‑contrast panels in EV cabins aid in enhancing user comfort and safety, particularly as autonomous features rise. Manufacturers favor durable, low‑power LCD technologies that support rapid data exchange with vehicle systems, aligning with consumer expectations for seamless, digital‑centric interiors in electric fleets. |
| By Vehicle Class |
|
SUVs are leading the push for larger interior dashboards that accommodate advanced infotainment and digital instrument clusters. Increasing consumer demand for immersive, high‑definition displays in spacious cabins positions SUVs as early adopters of thinner, high‑resolution modules. OEMs enhance user experience with multi‑screen configurations, leveraging higher‑brightness and superior contrast to maintain visibility in varied lighting conditions. |
| By Display Technology |
|
Mini‑LED delivers OLED‑like contrast without the high cost and limited lifespan of OLED panels. Local dimming improves black levels, reduces glare, and enhances readability for automotive‑grade cameras and advanced driver‑assistance systems. Its robust performance in extreme temperatures and vibration aligns with regulatory safety mandates, making it a preferred choice for high‑definition cockpit displays and large dashboard integrations. |
Regional Analysis: Vehicle LCD Screen Market
Leather‑to‑budget OEMs are carving out niche segments by offering modular LCD suites that can be swapped without extensive rewiring. This modularity allows dealers to tailor infotainment solutions year‑over‑year, entrenching brand loyalty while keeping the supply chain agile and responsive to rapid design changes.
Adoption of high‑definition touch panels, gesture‑controlled displays, and integrated voice assistants is reshaping user interaction models. OEMs are bundling these capabilities behind subscription tiers, creating recurring revenue streams that reinforce long‑term engagement with vehicle owners.
Emerging safety regulations mandate display readability at zero‑gravity angles, requiring manufacturers to invest early in adaptive projection systems. Compliance with federal standards has become a differentiator for OEMs and their suppliers, influencing purchasing decisions in the wider Vehicle LCD Screen Market.
Consolidation among display panel makers has spurred vertical integration, enabling tighter quality control and faster time‑to‑market. Supplier ecosystems are now unbundling services like pre‑calibration and OTA update infrastructure to add margin and lock‑in customers.
Europe
Europe’s push toward zero‑emission vehicles is matched by sophisticated infotainment demands. Strict data‑privacy legislation is shaping screen interfaces, compelling OEMs to incorporate local data centers and end‑to‑end encryption. In Vehicle LCD Screen Market, the group has positioned high‑definition displays with integrated infotainment navigation as a key competitive advantage. The region’s robust aftermarket, driven by the European Union’s stringent renovation policies, encourages upgrades to newer, more responsive LCD systems. These upgrades often occur mid‑life, extending the lift of OEMs and increasing long‑term profitability for suppliers engaged in modular upgrade provision. Consequently, automotive buy‑back programs in Germany and France serve as prime stages for advanced display technology adoption, ensuring renewal cycles stay in line with cross‑border sustainability targets.
Asia‑Pacific
In the Asia‑Pacific Vehicle LCD Screen Market, automotive giants are leveraging their billions of connected devices to embed sophisticated touch interfaces within mainstream models. Domestic smartphone fluency has created a cultural baseline where consumers anticipate responsive, multi‑touch solutions. Major OEMs in Japan and South Korea are partnering with panel firms for in‑house design, retaining IP over proprietary screen resolution standards. Meanwhile, cost‑focus in emerging economies such as India and Vietnam pushes suppliers to deliver scalable, mid‑range LCD solutions without sacrificing safety or compliance. Import dependencies have sharpened with supply‑chain resilience efforts, forcing companies to diversify sourcing routes across North and South China, thereby mitigating regional risk. The synergy between electrification acceleration and infotech integration ensures Vehicle LCD Screen Market in Asia‑Pacific remains an engine room for new model releases and aggressive rollout timelines.
South America
South American markets are re‑shaping Vehicle LCD Screen Market through a persistent demand for cost‑effective yet modern infotainment. Local assembly plants are boosting raw material availability while concurrently offering retrofit upgrades to older fleets to align with CATI and emerging wireless connectivity. Import taxes keep domestic manufacturers in focus, driving a strategic emphasis on in‑house development of LCD systems and software suites tailored for local climate constraints. Emerging trends in fleet management software are spurring further vehicle screen solutions, while OEMs pursue partnerships with local telecom carriers to offer subscription‑based data services integrated into their display panels. These dynamics keep Vehicle LCD Screen Market in the region tightly linked to regional macroeconomic stability and automotive sector growth curves.
Middle East & Africa
Vehicle LCD Screen Market activity in the Middle East and Africa hinges on luxury vehicle penetration and infrastructure expansion. Premium brands are consumed in abundance, pushing demand for high‑definition displays with the latest UI/UX innovations. Power connectivity solutions at charging hubs allow manufacturers to embed real‑time traffic and weather feeds into central screens, enhancing consumer engagement. Supply chains in Egypt, Saudi Arabia, and South Africa rely on a mix of local production and strategic import agreements, creating a diversified risk profile. As transportation networks modernise, the region is adopting user‑friendly infotainment systems that support multilingual interfaces, aligning with multicultural market demands. These strategic moves underpin Vehicle LCD Screen Market’s prominence across the region, setting the stage for sustained growth as connectivity mandates become integral to modern road users.
Report Scope
This market research report provides a comprehensive analysis of the Vehicle LCD Screen Market , covering the forecast period 2026–2034. It offers detailed insights into market dynamics, technological advancements, competitive landscape, and key trends shaping the industry.
Key focus areas of the report include:
- Market Overview: The report begins with an overview outlining its current market scenario, key growth indicators, and industry transformation drivers. It discusses macroeconomic factors, demand–supply balance, regulatory landscape, and the strategic role of semiconductors in powering advancements across industries such as automotive, telecommunications, consumer electronics, and industrial automation.
- Market Size & Forecast: Historical data and future projections for revenue, unit shipments, and market value across major regions and segments.
- Segmentation Analysis: Detailed breakdown by product type, technology, application, and end-user industry to identify high-growth segments and investment opportunities.
- Regional Insights: Insights into market performance across North America, Europe, Asia-Pacific, Latin America, and the Middle East & Africa, including country-level analysis where relevant.
- Competitive Landscape: Profiles of leading market participants, including their product offerings, R&D focus, manufacturing capacity, pricing strategies, and recent developments such as mergers, acquisitions, and partnerships.
- Technology Trends & Innovation: Assessment of emerging technologies, integration of AI/IoT, semiconductor design trends, fabrication techniques, and evolving industry standards.
- Market Drivers & Restraints: Evaluation of factors driving market growth along with challenges, supply chain constraints, regulatory issues, and market-entry barriers.
- Stakeholder Insights: Insights for component suppliers, OEMs, system integrators, investors, and policymakers regarding the evolving ecosystem and strategic opportunities.
Primary and secondary research methods are employed, including interviews with industry experts, data from verified sources, and real-time market intelligence to ensure the accuracy and reliability of the insights presented.
FREQUENTLY ASKED QUESTIONS:
What is the current market size of Vehicle LCD Screen Market?
-> Vehicle LCD Screen market size will reach USD 7927 million by 2034, implying a CAGR of 5.7% over the period.
Which key companies operate in Vehicle LCD Screen Market?
-> Key players include Boe Technology, TCL China Star Optoelectronics Technology, JDI, Sharp, Tianma Microelectronics, LG Display, Innolux, Caihong Display Devices, and InfoVision Optoelectronics, as well as automotive OEMs and Tier‑1 suppliers such as Continental, Denso, Bosch, and Visteon.
What are the key growth drivers?
-> Key growth drivers include automotive electrification, rising demand for high‑resolution infotainment and advanced driver assistance systems, EU safety regulations requiring driver‑distraction warning systems, and the transition to automotive‑grade LTPS TFT LCD and Mini‑LED local dimming technologies.
Which region dominates the market?
-> The Asia‑Pacific region is the largest and fastest‑growing market for Vehicle LCD Screens, driven by strong automotive production in China, Japan, and South Korea.
What are the emerging trends?
-> Emerging trends include the adoption of Mini‑LED local dimming with quantum dot enhancement, automotive‑grade LTPS TFT LCD integration into carpet‑to‑pillar cockpit surfaces, simplified HMI designs to reduce eye‑off‑road time, and the expansion of touch and optical bonding technologies.

Get Sample Report PDF for Exclusive Insights
Report Sample Includes
- Table of Contents
- List of Tables & Figures
- Charts, Research Methodology, and more...
 Download Sample Report PDF


