The Report Covers :
This report provides a comprehensive analysis of the market, covering key aspects such as market size, growth trends, regional insights, and segmentation by type and application. It also highlights the competitive landscape, profiling key players, and offers valuable insights to help businesses make informed decisions.
Quantum Dot (QD) Display Market Overview
Quantum dots (QDS), also known as semiconductor nanocrystals, are made up of a finite number of atoms with three dimensions on the nanometer scale. Quantum dots is spherical or spherical, commonly made of semiconductor materials (usually by ~ ? A IIB or IIIA ~ VA elements) made of 2 ~ 20 nm in diameter, stability of the nanoparticles. Quantum dots are an aggregation of atoms and molecules on the nanometer scale, which can be composed of either one kind of semiconductor material, such as IiB.Via group elements (such as CdS, CdSe, CdTe, ZnSe, etc.) or IIIa.VA group elements (such as InP, InAs, etc.), or two or more kinds of semiconductor materials.
As a novel semiconductor nanomaterial, quantum dots have many unique nano properties. Due to the special small size structure of quantum dots, the quasi-continuous energy band evolves into a separate energy level structure similar to that of molecules, which leads to the special small size effect, quantum size effect, macroscopic quantum tunneling effect, electron confining effect and unique surface effect which are not available in bulk materials and molecular materials. Quantum dots also have good optical stability, wide excitation spectrum, narrow emission, large Stokes shift, good biocompatibility and long fluorescence lifetime. In addition, the most important feature of quantum dots is that they can change the wavelength of light emitted by changing their size and chemical composition. The special physical and chemical properties of quantum dots make them widely used in the fields of life science, quality detection, optoelectronics, solar cells and environmental science.
Quantum Dot (QD) Display Market Analysis:
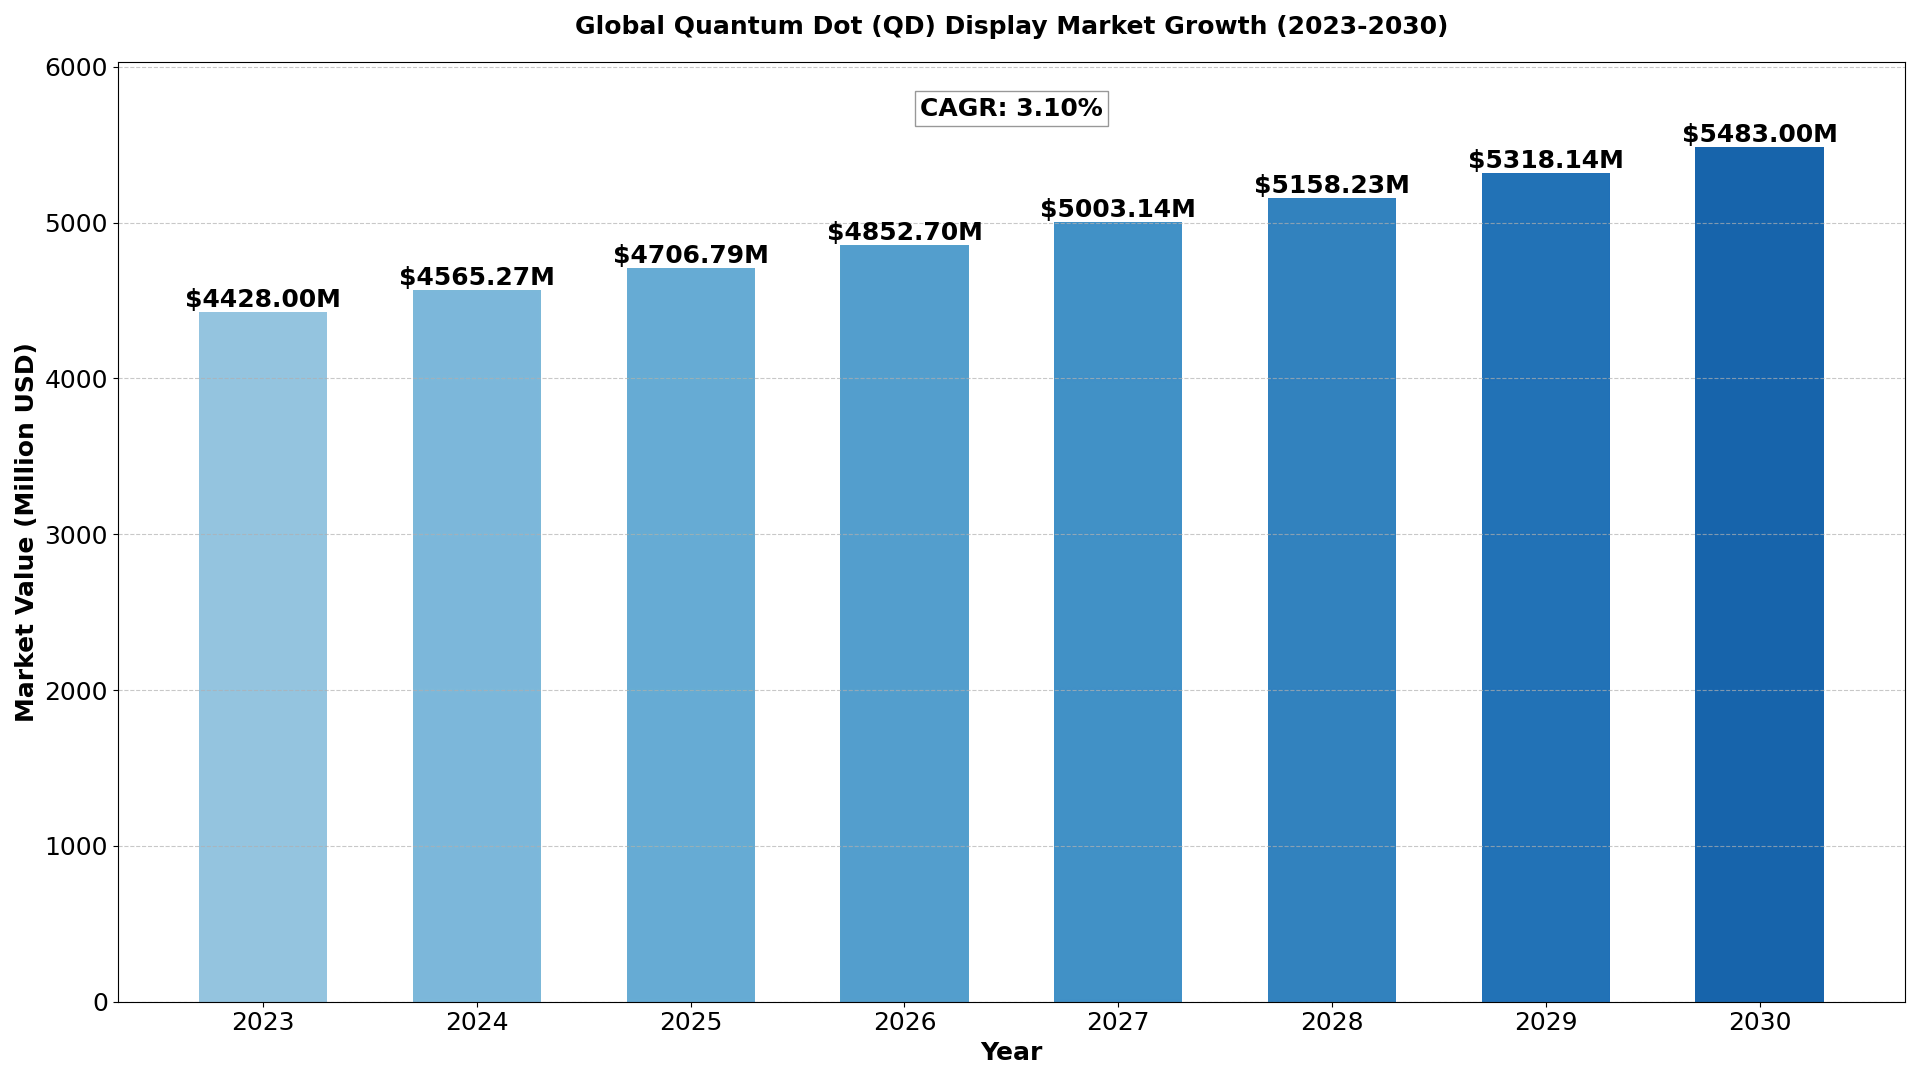
The Global Quantum Dot (QD) Display Market size was estimated at USD 4428 million in 2023 and is projected to reach USD 5483.00 million by 2030, exhibiting a CAGR of 3.10% during the forecast period.
North America Quantum Dot (QD) Display market size was USD 1153.81 million in 2023, at a CAGR of 2.66% during the forecast period of 2024 through 2030.
Access Your Free Sample Report Now
Quantum Dot (QD) Display Key Market Trends :
1. Increasing Adoption in Consumer Electronics
- Quantum Dot technology is gaining traction in TVs, monitors, and smartphones due to its ability to deliver superior color accuracy, brightness, and energy efficiency compared to traditional LCDs.
- Demand for high-end displays in gaming, home entertainment, and professional applications is driving growth.
2. Expansion into Automotive and Wearable Displays
- QD displays are being increasingly explored for in-vehicle infotainment systems and heads-up displays (HUDs) due to their wide color gamut and excellent visibility in varying lighting conditions.
- The wearable tech market is also leveraging QD technology for smartwatches and fitness trackers, emphasizing vibrant and energy-efficient displays.
3. Shift Toward Cadmium-Free Quantum Dots
- Environmental concerns and stringent regulations, such as the EU’s RoHS directive, are driving the development and adoption of cadmium-free QD materials.
- Manufacturers are investing in sustainable alternatives like indium phosphide-based QDs to maintain compliance and appeal to eco-conscious consumers.
4. Emergence of QD-OLED and Hybrid Technologies
- Quantum Dot OLED (QD-OLED) technology is emerging as a breakthrough innovation, combining the benefits of OLED (self-emissive pixels) with QD’s color performance and brightness.
- Hybrid QD technologies, like micro-LED with QD enhancement, are also gaining momentum for applications requiring ultra-high brightness and durability.
5. Growth in Display Miniaturization and Flexible Applications
- Quantum Dots are enabling advancements in flexible and foldable displays, opening up new possibilities for innovative form factors in smartphones and other devices.
- Miniaturized QD displays are also being explored for augmented reality (AR) and virtual reality (VR) devices, where compact and high-resolution displays are critical.
Quantum Dot (QD) Display Market Regional Analysis :

Get Free Sample Report of This Report
1. North America (USA, Canada, Mexico)
- USA: The largest market in the region due to advanced infrastructure, high disposable income, and technological advancements. Key industries include technology, healthcare, and manufacturing.
- Canada: Strong market potential driven by resource exports, a stable economy, and government initiatives supporting innovation.
- Mexico: A growing economy with strengths in automotive manufacturing, agriculture, and tourism, benefitting from trade agreements like the USMCA.
2. Europe (Germany, UK, France, Russia, Italy, Rest of Europe)
- Germany: The region’s industrial powerhouse with a focus on engineering, automotive, and machinery.
- UK: A hub for financial services, fintech, and pharmaceuticals, though Brexit has altered trade patterns.
- France: Strong in luxury goods, agriculture, and aerospace with significant innovation in renewable energy.
- Russia: Resource-driven economy with strengths in oil, gas, and minerals but geopolitical tensions affect growth.
- Italy: Known for fashion, design, and manufacturing, especially in luxury segments.
- Rest of Europe: Includes smaller yet significant economies like Spain, Netherlands, and Switzerland with strengths in finance, agriculture, and manufacturing.
3. Asia-Pacific (China, Japan, South Korea, India, Southeast Asia, Rest of Asia-Pacific)
- China: The largest market in the region with a focus on technology, manufacturing, and e-commerce. Rapid urbanization and middle-class growth fuel consumption.
- Japan: Technological innovation, particularly in robotics and electronics, drives the economy.
- South Korea: Known for technology, especially in semiconductors and consumer electronics.
- India: Rapidly growing economy with strengths in IT services, agriculture, and pharmaceuticals.
- Southeast Asia: Key markets like Indonesia, Thailand, and Vietnam show growth in manufacturing and tourism.
- Rest of Asia-Pacific: Emerging markets with growing investment in infrastructure and services.
4. South America (Brazil, Argentina, Colombia, Rest of South America)
- Brazil: Largest economy in the region, driven by agriculture, mining, and energy.
- Argentina: Known for agriculture exports and natural resources but faces economic instability.
- Colombia: Growing economy with strengths in oil, coffee, and flowers.
- Rest of South America: Includes Chile and Peru, which have strong mining sectors.
5. The Middle East and Africa (Saudi Arabia, UAE, Egypt, Nigeria, South Africa, Rest of MEA)
- Saudi Arabia: Oil-driven economy undergoing diversification with Vision 2030 initiatives.
- UAE: Financial hub with strengths in tourism, real estate, and trade.
- Egypt: Growing infrastructure development and tourism.
- Nigeria: Largest economy in Africa with strengths in oil and agriculture.
- South Africa: Industrialized economy with strengths in mining and finance.
- Rest of MEA: Includes smaller yet resource-rich markets like Qatar and Kenya with growing infrastructure investments.
Quantum Dot (QD) Display Market Segmentation :
The research report includes specific segments by region (country), manufacturers, Type, and Application. Market segmentation creates subsets of a market based on product type, end-user or application, Geographic, and other factors. By understanding the market segments, the decision-maker can leverage this targeting in the product, sales, and marketing strategies. Market segments can power your product development cycles by informing how you create product offerings for different segments.
Market Segmentation (by Type)
- QDEF
- QLED
Market Segmentation (by Application)
- TV
- Monitor
- Smartphone
Quantum Dot (QD) Display Market Competitive landscape :
- Samsung
- LG
- Sharp
- CSOT
- AUO
- BOE
Download Your Complimentary Sample Report
Drivers:
- Enhanced Display Quality: Quantum dot technology significantly improves color accuracy, brightness, and energy efficiency in displays. This results in more vivid and lifelike images, meeting the increasing consumer demand for high-quality visual experiences in devices such as televisions, smartphones, and monitors.
- Rising Adoption in Consumer Electronics: The proliferation of ultra-high-definition (UHD) content, including 4K and 8K resolutions, has led to a surge in demand for displays capable of delivering superior picture quality. Quantum dot displays are well-suited to meet these demands, making them increasingly popular in the consumer electronics sector.
- Technological Advancements: Continuous research and development efforts have led to the creation of more advanced quantum dot materials with improved optical properties, stability, and efficiency. Innovations in quantum dot synthesis techniques have enabled the production of high-quality quantum dots, enhancing color purity, brightness, and durability in displays.
Restraints:
- High Manufacturing Costs: The production of quantum dot displays involves complex processes and expensive materials, leading to higher costs compared to traditional display technologies. This price premium can be a barrier to widespread adoption, particularly in price-sensitive markets.
- Environmental Concerns: Certain quantum dots contain toxic materials, raising environmental and regulatory issues. Although cadmium-free quantum dots have been developed, they may not yet match the performance levels of cadmium-containing quantum dots, presenting a trade-off between environmental compliance and performance.
- Competition from Established Technologies: Established display technologies such as LCDs and OLEDs have long dominated the consumer electronics market. The maturity, proven performance, and widespread adoption of these technologies present a formidable barrier for quantum dot displays to overcome in terms of market acceptance and consumer preference.
Opportunities:
- Growing Demand for 8K and HDR Displays: As consumers seek higher resolution and better color performance, the demand for 8K and High Dynamic Range (HDR) displays is increasing. Quantum dot technology’s ability to deliver a wider color gamut and enhanced brightness positions it well to capitalize on this trend.
- Emerging Applications in Automotive and Healthcare: Quantum dot displays are finding applications in automotive displays and medical imaging, where high brightness and color accuracy are essential. This diversification into new sectors offers significant growth potential for the market.
- Development of Cadmium-Free Quantum Dots: Concerns over the environmental impact of cadmium-based quantum dots have spurred the development of cadmium-free alternatives. Researchers have made significant progress in developing cadmium-free quantum dots using safer materials, driving the market towards more sustainable and eco-friendly display technologies.
Challenges:
- Rapid Technological Advancements: The fast-paced development of display technologies means that quantum dot manufacturers must continuously innovate to keep up with emerging trends and competing technologies such as OLED and MicroLED. Staying ahead in terms of performance and cost-effectiveness is a persistent challenge.
- Scaling Production: While quantum dot technology offers many advantages, scaling production to meet growing global demand remains a technical and logistical challenge. Ensuring consistent quality and performance across large-scale manufacturing processes adds further complexity.
- Regulatory Issues: Some quantum dots, particularly cadmium-based ones, face regulatory restrictions due to their environmental impact. Manufacturers must navigate these regulatory landscapes while exploring more eco-friendly alternatives, which can slow product development and market entry.
Key Benefits of This Market Research:
- Industry drivers, restraints, and opportunities covered in the study
- Neutral perspective on the market performance
- Recent industry trends and developments
- Competitive landscape & strategies of key players
- Potential & niche segments and regions exhibiting promising growth covered
- Historical, current, and projected market size, in terms of value
- In-depth analysis of the Quantum Dot (QD) Display Market
- Overview of the regional outlook of the Quantum Dot (QD) Display Market:
Key Reasons to Buy this Report:
- Access to date statistics compiled by our researchers. These provide you with historical and forecast data, which is analyzed to tell you why your market is set to change
- This enables you to anticipate market changes to remain ahead of your competitors
- You will be able to copy data from the Excel spreadsheet straight into your marketing plans, business presentations, or other strategic documents
- The concise analysis, clear graph, and table format will enable you to pinpoint the information you require quickly
- Provision of market value (USD Billion) data for each segment and sub-segment
- Indicates the region and segment that is expected to witness the fastest growth as well as to dominate the market
- Analysis by geography highlighting the consumption of the product/service in the region as well as indicating the factors that are affecting the market within each region
- Competitive landscape which incorporates the market ranking of the major players, along with new service/product launches, partnerships, business expansions, and acquisitions in the past five years of companies profiled
- Extensive company profiles comprising of company overview, company insights, product benchmarking, and SWOT analysis for the major market players
- The current as well as the future market outlook of the industry concerning recent developments which involve growth opportunities and drivers as well as challenges and restraints of both emerging as well as developed regions
- Includes in-depth analysis of the market from various perspectives through Porters five forces analysis
- Provides insight into the market through Value Chain
- Market dynamics scenario, along with growth opportunities of the market in the years to come
- 6-month post-sales analyst support
Customization of the Report
In case of any queries or customization requirements, please connect with our sales team, who will ensure that your requirements are met.
Interested in related market reports? Click here to explore more!
About Semiconductor Insight:
Semiconductor Insight, founded in 2016, provides comprehensive semiconductor market data and analysis to help organizations make informed decisions in the dynamic semiconductor industry. We specialize in semiconductor industry reports, offering insights into market trends, competition analysis, technical breakthroughs, and market predictions. With nearly a decade of experience, we help clients stay ahead with strategic clarity, focusing on semiconductor market share, industry trends, and the semiconductor industry outlook 2025, ensuring they are well-equipped to navigate the semiconductor industry size and evolving landscape.
Get Sample Report PDF for Exclusive Insights
Report Sample Includes
- Table of Contents
- List of Tables & Figures
- Charts, Research Methodology, and more...