
MARKET INSIGHTS
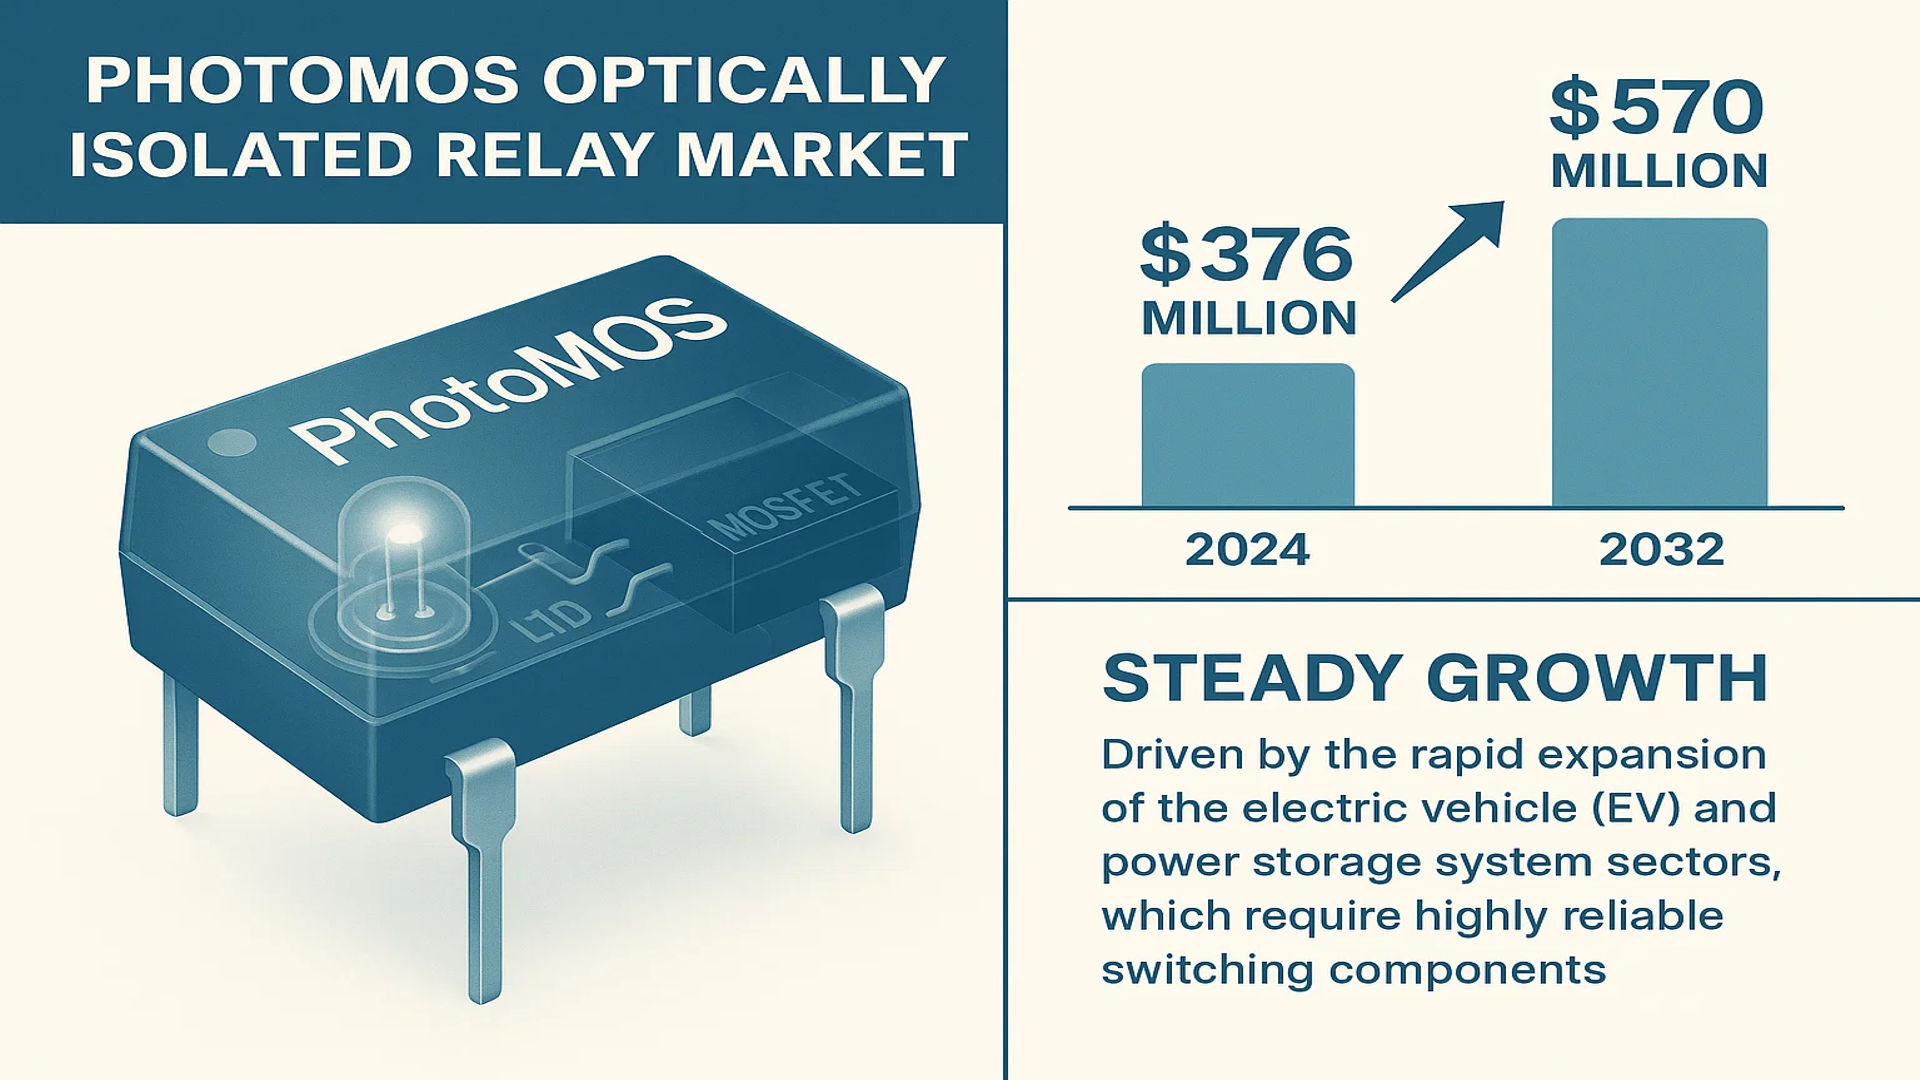
The global PhotoMOS Optically Isolated Relay Market was valued at 376 million in 2024 and is projected to reach US$ 570 million by 2032, at a CAGR of 6.3% during the forecast period.
PhotoMOS Optically Isolated Relays are semiconductor-based components that transfer electrical signals between two isolated circuits using light. These relays utilize a light-emitting diode (LED) as an input and a MOSFET as an output, providing superior reliability and a smaller footprint compared to traditional electromechanical relays. The entire unit is molded in translucent resin, ensuring robust galvanic isolation between the input and output sides, which is critical for protecting sensitive electronics from high-voltage transients and noise.
The market is experiencing steady growth driven by several key factors, including the rapid expansion of the electric vehicle (EV) and power storage system sectors, which require highly reliable switching components. Furthermore, increasing automation in industrial control systems and the growing demand for sophisticated test and measurement equipment in telecommunications are significant contributors to market expansion. The market is highly concentrated, with the top five manufacturers—Panasonic, OMRON, Toshiba, NEC, and IXYS—collectively holding approximately 70% of the global market share. Geographically, the United States, Europe, and China are the largest markets, each accounting for roughly 20% of global demand.
MARKET DYNAMICS
MARKET DRIVERS
Rising Demand for Industrial Automation and Control Systems to Drive Market Expansion
The global industrial automation market is experiencing robust growth, projected to exceed 400 billion by 2030, creating substantial demand for PhotoMOS relays due to their superior reliability and performance in harsh industrial environments. These optically isolated relays provide critical isolation solutions in programmable logic controllers (PLCs), motor drives, and process control systems where electrical noise immunity and long-term stability are paramount. The transition toward Industry 4.0 and smart manufacturing initiatives is accelerating adoption, with manufacturing sectors increasingly requiring high-voltage isolation and noise-resistant switching components. PhotoMOS relays offer significant advantages over traditional electromechanical relays, including faster switching speeds, longer operational life exceeding 100 million operations, and elimination of contact bounce issues. This reliability makes them indispensable in automated production lines where downtime minimization is critical.
Expansion of Electric Vehicle Infrastructure to Boost Market Growth
The global electric vehicle market is projected to grow at a compound annual growth rate of over 25%, driving parallel growth in charging infrastructure and power management systems that extensively utilize PhotoMOS relays. These components are essential in battery management systems (BMS), charging stations, and power conversion units where they provide reliable isolation between high-voltage and low-voltage circuits. The automotive industry’s shift toward 800V architecture systems requires components capable of handling higher voltages while maintaining compact form factors, making PhotoMOS relays particularly valuable. Their solid-state construction ensures vibration resistance and long-term reliability under automotive operating conditions, addressing critical safety requirements in electric vehicle systems. The increasing deployment of fast-charging stations, expected to number over 4 million globally by 2030, further amplifies demand for these isolation components.
Growing Medical Equipment Market to Fuel Adoption
The medical equipment sector represents a significant growth area, with the global medical devices market projected to reach approximately 800 billion by 2030. PhotoMOS relays are increasingly specified in medical equipment due to their ability to provide reliable patient isolation in diagnostic equipment, monitoring systems, and therapeutic devices. Regulatory requirements for patient safety demand high isolation voltages, typically exceeding 4000V, which PhotoMOS relays consistently deliver. The COVID-19 pandemic accelerated medical equipment production, with ventilators, patient monitors, and diagnostic equipment experiencing unprecedented demand. This trend continues as healthcare systems worldwide upgrade their infrastructure, creating sustained demand for high-reliability isolation components. The miniaturization trend in medical devices also favors PhotoMOS technology, as these relays offer high performance in compact packages suitable for portable and space-constrained medical applications.
MARKET CHALLENGES
High Component Costs Compared to Traditional Relays to Challenge Market Penetration
Despite their performance advantages, PhotoMOS relays typically command premium pricing compared to conventional electromechanical relays, creating adoption barriers in price-sensitive applications. The manufacturing process involves sophisticated semiconductor fabrication and precision optical alignment, contributing to higher production costs. In cost-driven markets such as consumer electronics and basic industrial controls, this price differential can deter widespread adoption. The global semiconductor supply chain constraints have further exacerbated cost pressures, with component prices increasing by approximately 15-20% over recent years. While the superior performance characteristics justify the premium in critical applications, many volume-driven markets remain sensitive to component costs, limiting market expansion potential.
Other Challenges
Thermal Management Limitations
PhotoMOS relays face thermal challenges in high-current applications due to their semiconductor nature. The on-resistance of MOSFET outputs generates heat during operation, limiting maximum current handling capabilities compared to electromechanical alternatives. This thermal constraint becomes particularly significant in power applications exceeding 2A, where heat dissipation requirements may necessitate additional cooling measures or derating of component specifications. The industry continues to address this through advanced packaging technologies and improved semiconductor materials, but thermal performance remains a consideration in high-power designs.
Electromagnetic Compatibility Considerations
While offering excellent noise immunity, PhotoMOS relays can generate electromagnetic interference during switching operations, particularly in high-frequency applications. This requires careful circuit design and additional filtering components in sensitive applications, adding complexity and cost to system designs. The increasing regulatory requirements for electromagnetic compatibility across various industries necessitate thorough testing and potential design modifications, creating additional development challenges for engineers implementing these components.
MARKET RESTRAINTS
Technical Complexity in High-Frequency Applications to Limit Market Growth
PhotoMOS relays face significant technical constraints in high-frequency switching applications above several hundred kilohertz. The inherent capacitance between input and output sections, typically ranging from 5-15pF, creates limitations for RF and high-speed digital applications. This capacitance can cause signal integrity issues, including rise time degradation and cross-talk between channels in multi-relay configurations. While manufacturers continue to develop low-capacitance versions, these specialized components often come with trade-offs in other performance parameters or increased costs. The proliferation of 5G infrastructure and high-speed data communication systems demands components capable of operating at increasingly higher frequencies, presenting ongoing development challenges for PhotoMOS technology.
Limited Current Handling Capacity to Restrict Application Scope
The market adoption of PhotoMOS relays is constrained by their limited current-carrying capacity compared to electromechanical alternatives. Most standard PhotoMOS relays are rated for currents between 0.1A to 2A, while many industrial and power applications require switching capabilities exceeding 10A. This limitation restricts their use in high-power applications such as industrial motor control, power distribution systems, and high-current switching circuits. The development of higher-current PhotoMOS devices faces technical hurdles related to heat dissipation and semiconductor die size, making them less economically viable for high-volume applications. While parallel connection of multiple devices can address this limitation, it increases system complexity, cost, and board space requirements.
Supply Chain Vulnerabilities to Impact Market Stability
The PhotoMOS relay market faces constraints from semiconductor supply chain vulnerabilities, particularly affecting the availability of specialized optoelectronic components and high-voltage MOSFETs. The global semiconductor shortage that began in 2020 highlighted the industry’s dependence on limited manufacturing sources and complex supply networks. Lead times for PhotoMOS relays extended to over 40 weeks during peak shortage periods, causing project delays and design changes across multiple industries. The concentration of manufacturing capabilities in specific geographic regions creates additional supply risks, particularly for applications requiring high reliability and long-term availability. These supply chain challenges encourage customers to consider alternative technologies, potentially limiting market growth during periods of component scarcity.
MARKET OPPORTUNITIES
Emerging Renewable Energy Sector to Create New Growth Avenues
The global transition toward renewable energy presents significant opportunities, with solar and wind power capacity expected to double by 2030. PhotoMOS relays are increasingly specified in solar inverters, wind turbine control systems, and energy storage applications where high-voltage isolation and reliability are critical requirements. The unique ability to provide galvanic isolation while withstanding harsh environmental conditions makes them ideal for renewable energy applications. The growing adoption of microinverters and power optimizers in solar installations, each requiring multiple isolation components, creates substantial market potential. Additionally, the development of smart grid infrastructure and distributed energy resources requires advanced protection and control systems that utilize PhotoMOS technology for safe and reliable operation.
Advancements in Telecommunications Infrastructure to Drive Demand
The ongoing global deployment of 5G networks and expansion of fiber optic infrastructure creates substantial opportunities for PhotoMOS relays in telecommunications equipment. These components are essential in base station equipment, network switches, and transmission systems where they provide reliable signal switching and circuit protection. The requirement for higher data rates and increased network density drives demand for components that can operate at higher frequencies while maintaining signal integrity. The telecommunications industry’s transition toward software-defined networking and network function virtualization requires more sophisticated switching solutions, further expanding application opportunities. The anticipated rollout of 6G technology in the coming decade will likely create additional requirements for advanced isolation components with improved high-frequency performance.
Development of Smart Home and IoT Devices to Expand Market Reach
The proliferation of smart home devices and Internet of Things (IoT) applications represents a growing market opportunity, with connected device installations projected to exceed 30 billion units by 2030. PhotoMOS relays find applications in smart thermostats, home automation systems, and appliance control where reliable switching and electrical isolation are required. The trend toward higher integration and miniaturization in consumer electronics favors PhotoMOS technology due to its compact footprint and solid-state reliability. The increasing incorporation of safety features and regulatory requirements for electrical isolation in household appliances creates additional demand. The development of voice-controlled devices, smart lighting systems, and home security products continues to expand the application landscape for these components in consumer markets.
PHOTOMOS OPTICALLY ISOLATED RELAY MARKET TRENDS
Rising Demand in Electric Vehicle and Power Storage Systems to Emerge as a Dominant Trend
The global shift towards electrification, particularly in the automotive and energy sectors, is significantly accelerating the adoption of PhotoMOS relays. These components are critical for battery management systems (BMS), onboard chargers, and power distribution units within electric vehicles (EVs), where they provide high-voltage isolation and reliable switching without the wear and tear of mechanical contacts. The global EV market is projected to grow at a CAGR of over 21% through 2030, directly correlating with increased demand for high-performance isolation components. Furthermore, the expansion of renewable energy infrastructure and the consequent need for efficient power storage systems are driving substantial growth. PhotoMOS relays are integral in managing charge/discharge cycles and ensuring safety in large-scale battery storage installations, a market itself expected to exceed 250 GWh of annual deployments by 2025. This trend is underpinned by the component’s ability to handle voltages in the Above 200 V and Below 350 V range, which is particularly suited for these high-power applications.
Other Trends
Miniaturization and Enhanced Performance in Telecommunications
The relentless drive for smaller, more powerful, and energy-efficient telecommunications equipment is a major catalyst for innovation in the PhotoMOS market. The rollout of 5G infrastructure and the ongoing expansion of fiber-optic networks require relays that can fit into densely packed PCBs while providing superior noise immunity and long-term reliability. Manufacturers are responding with increasingly compact surface-mount device (SMD) packages that offer the same high isolation ratings—typically 3750 Vrms or more—as their larger through-hole predecessors. This miniaturization allows for higher port density in network switches, routers, and base station equipment, enabling the backbone of modern digital communication. The Test Measurement & Telecommunication application segment, which already commands a significant market share, is expected to grow in lockstep with global investments in digital infrastructure, which are estimated to be in the hundreds of billions annually.
Increased Automation and Smart Manufacturing in Industrial Controls
Industry 4.0 and the proliferation of smart factories are creating robust demand for highly reliable signal switching and isolation solutions. PhotoMOS relays are increasingly favored over traditional electromechanical relays in programmable logic controllers (PLCs), sensor interfaces, and factory automation equipment because they offer silent operation, immunity to magnetic fields, and a vastly longer operational lifespan—often exceeding 1 billion operations. This reduces maintenance downtime and increases overall equipment effectiveness (OEE) in manufacturing environments. The growth in industrial robotics, with global installations rising by over 10% year-over-year, further fuels this trend, as each robotic unit utilizes numerous relays for control and safety functions. This surge in industrial automation solidifies the Industrial & Security Device segment as a key growth pillar for the PhotoMOS market, driven by the need for components that can perform flawlessly in harsh, electrically noisy environments.
COMPETITIVE LANDSCAPE
Key Industry Players
Companies Strive to Strengthen their Product Portfolio to Sustain Competition
The competitive landscape of the global PhotoMOS Optically Isolated Relay market is highly consolidated, dominated by a handful of major electronics conglomerates that leverage their extensive manufacturing capabilities and global distribution networks. The top five manufacturers collectively hold approximately 70% of the global market share, creating significant barriers to entry for smaller players. This concentration is primarily due to the specialized semiconductor manufacturing processes and substantial R&D investments required to develop advanced PhotoMOS relay technologies.
Panasonic Corporation stands as a dominant force in this market, owing to its comprehensive product portfolio that spans multiple voltage ranges and its entrenched position across key end-use industries including industrial automation, telecommunications, and automotive electronics. The company’s global manufacturing footprint, particularly strong in Asia and North America, allows it to maintain cost efficiencies and responsive supply chains.
OMRON Corporation and Toshiba Electronic Devices & Storage Corporation also command significant market shares, each holding approximately 15-18% of the global market. These Japanese giants have built their competitive advantage through decades of expertise in optoelectronics and power semiconductor technologies. Their growth is particularly driven by innovative product developments in high-voltage relays (above 200V) which are increasingly demanded in electric vehicle power systems and renewable energy applications.
Meanwhile, NEC Corporation and IXYS Integrated Circuits Division (acquired by Littelfuse in 2017) are strengthening their market positions through strategic focus on niche applications. NEC has made significant inroads in the telecommunications sector, particularly with relays optimized for 5G infrastructure, while IXYS (Littelfuse) has capitalized on the growing demand for high-reliability components in medical and military applications through enhanced product durability and miniaturization.
These industry leaders are actively pursuing growth through continuous product innovation, with recent developments focusing on higher switching speeds, lower power consumption, and enhanced isolation capabilities. Additionally, strategic expansions into emerging markets, particularly in Southeast Asia and Eastern Europe, are expected to further consolidate their market positions throughout the forecast period.
Smaller specialized manufacturers including BRIGHT TOWARD (Taiwan), COSMO Electronics (China), and Okita Works (Japan) compete primarily through cost leadership and specialization in specific voltage ranges or application segments. These companies typically focus on regional markets and specific industry verticals where they can deliver customized solutions without challenging the global giants across their entire product spectrum.
List of Key PhotoMOS Optically Isolated Relay Companies Profiled
- Panasonic Corporation (Japan)
- OMRON Corporation (Japan)
- Toshiba Electronic Devices & Storage Corporation (Japan)
- NEC Corporation (Japan)
- IXYS Integrated Circuits Division (Littelfuse Inc.) (USA)
- BRIGHT TOWARD CORPORATION (Taiwan)
- COSMO Electronics Co., Ltd. (China)
- Okita Works Ltd. (Japan)
Segment Analysis:
By Type
Above 20 V and Below 80 V Segment Dominates the Market Due to Broad Compatibility and Cost-Effectiveness
The market is segmented based on voltage rating into:
- Above 20 V and Below 80 V
- Above 100 V and Below 200 V
- Above 200 V and Below 350 V
- Above 350 V
By Application
Test Measurement & Telecommunication Segment Leads Due to Critical Need for Signal Isolation and Noise Reduction
The market is segmented based on application into:
- EV & Power Storage System
- Test Measurement & Telecommunication
- Medical & Military
- Industrial & Security Device
- Others
By End User
Industrial Automation Sector Represents a Key End User Segment Driven by Demand for Reliable Control Systems
The market is segmented based on end user into:
- Industrial Automation
- Telecommunications
- Healthcare & Medical Equipment
- Energy & Power Storage
- Others
Regional Analysis: PhotoMOS Optically Isolated Relay Market
Asia-Pacific
The Asia-Pacific region is the largest and fastest-growing market for PhotoMOS relays, accounting for approximately 40% of global consumption by volume. This dominance is driven by massive manufacturing hubs in China, Japan, and South Korea, which are home to leading producers like Panasonic, OMRON, Toshiba, and NEC. The relentless expansion of the EV & Power Storage System sector, particularly in China, which commands over 60% of global EV battery production, creates substantial demand for high-voltage relays (Above 200 V and Below 350 V). Furthermore, the region’s robust telecommunications infrastructure rollout, including 5G networks, fuels consumption in the Test Measurement & Telecommunication segment. While cost-competitiveness remains a key driver, there is a noticeable shift towards higher-reliability components for advanced medical and industrial automation applications, supporting value growth alongside volume.
North America
North America represents a significant, high-value market characterized by stringent regulatory standards and a strong focus on innovation. The United States holds the largest share within the region, driven by advanced manufacturing, a thriving medical device industry, and military applications that require components with high reliability and isolation properties. The market is notably advanced in its adoption of relays for the Above 350 V segment, crucial for industrial motor drives and renewable energy systems. Recent investments in semiconductor infrastructure, such as the CHIPS and Science Act, are expected to bolster local supply chains. Demand is further supported by the need for robust components in data centers and telecommunications infrastructure, with manufacturers emphasizing products that meet rigorous safety and performance certifications.
Europe
Europe is a mature market with a strong emphasis on quality, precision, and compliance with international standards like IEC and CE marking. Germany, as the industrial heartland of the region, is a major consumer, particularly for relays used in industrial automation, automotive electronics, and high-end instrumentation. The region’s push towards Industry 4.0 and smart manufacturing is a key growth driver, increasing the need for reliable signal isolation in control systems. Additionally, the expanding renewable energy sector, especially in wind and solar power applications, creates sustained demand for high-voltage PhotoMOS relays. While the market growth is steady, it is tempered by high competition and the presence of well-established, technically advanced end-users who demand proven performance and long-term reliability from components.
South America
The market in South America is emerging, with growth primarily concentrated in industrial and telecommunications applications in countries like Brazil and Argentina. Economic volatility and fluctuating currency values often impact capital investment in new equipment, which can slow the adoption rate of advanced components like PhotoMOS relays. However, gradual modernization in manufacturing sectors and infrastructure projects presents opportunities. The market is currently dominated by more cost-effective relay solutions, but there is a growing recognition of the benefits of optical isolation for improving system longevity and reducing maintenance, particularly in harsh industrial environments. Growth is expected to be incremental, closely tied to regional economic stability and industrial development.
Middle East & Africa
This region represents a developing market with potential driven by infrastructure development, particularly in the Gulf Cooperation Council (GCC) nations and South Africa. Investment in telecommunications, oil and gas automation, and power generation is creating nascent demand for PhotoMOS relays. The market is characterized by a preference for durability and performance in extreme environmental conditions, such as high temperatures. However, the overall adoption rate is limited by a less mature electronics manufacturing base and a stronger reliance on imported finished equipment rather than local component sourcing. Long-term growth is anticipated as industrial diversification and technological adoption increase, but it remains a smaller segment of the global market.
Report Scope
This market research report provides a comprehensive analysis of the global and regional PhotoMOS Optically Isolated Relay markets, covering the forecast period 2025–2032. It offers detailed insights into market dynamics, technological advancements, competitive landscape, and key trends shaping the industry.
Key focus areas of the report include:
- Market Size & Forecast: Historical data and future projections for revenue, unit shipments, and market value across major regions and segments.
- Segmentation Analysis: Detailed breakdown by product type, technology, application, and end-user industry to identify high-growth segments and investment opportunities.
- Regional Outlook: Insights into market performance across North America, Europe, Asia-Pacific, Latin America, and the Middle East & Africa, including country-level analysis where relevant.
- Competitive Landscape: Profiles of leading market participants, including their product offerings, R&D focus, manufacturing capacity, pricing strategies, and recent developments such as mergers, acquisitions, and partnerships.
- Technology Trends & Innovation: Assessment of emerging technologies, integration of AI/IoT, semiconductor design trends, fabrication techniques, and evolving industry standards.
- Market Drivers & Restraints: Evaluation of factors driving market growth along with challenges, supply chain constraints, regulatory issues, and market-entry barriers.
- Stakeholder Analysis: Insights for component suppliers, OEMs, system integrators, investors, and policymakers regarding the evolving ecosystem and strategic opportunities.
Primary and secondary research methods are employed, including interviews with industry experts, data from verified sources, and real-time market intelligence to ensure the accuracy and reliability of the insights presented.
FREQUENTLY ASKED QUESTIONS:
What is the current market size of Global PhotoMOS Optically Isolated Relay Market?
-> PhotoMOS Optically Isolated Relay Market was valued at 376 million in 2024 and is projected to reach US$ 570 million by 2032, at a CAGR of 6.3% during the forecast period.
Which key companies operate in Global PhotoMOS Optically Isolated Relay Market?
-> Key players include Panasonic, OMRON, Toshiba, NEC, IXYS, BRIGHT TOWARD, COSMO Electronics, and Okita Works, among others.
What are the key growth drivers?
-> Key growth drivers include rising demand for reliable isolation in EV power storage systems, expansion of telecommunications infrastructure, and increasing automation in industrial controls.
Which region dominates the market?
-> Asia-Pacific is the fastest-growing region, while North America, Europe, and China each hold approximately 20% market share.
What are the emerging trends?
-> Emerging trends include miniaturization of components, higher voltage handling capabilities, integration with IoT systems, and adoption in medical and military applications.
Get Sample Report PDF for Exclusive Insights
Report Sample Includes
- Table of Contents
- List of Tables & Figures
- Charts, Research Methodology, and more...
 Download Sample Report PDF

