Phosphine Gas (PH3) Market Overview
Phosphine (PH?) in the electronic industries is offered at high purity by the supplier. Purities offered range from low 99.99% to 99.9999+%. Phosphine Gas is a p-type implant material used in semiconductors. Diluted PH?/H? mix is used in PECVD deposition of TFT for flat panel display and epi nMOS Si:P:C Source/Drain (S/D) in logic/DRAM. It is also a plasma / ion immersion doping source in FPD.
This report provides a deep insight into the global Phosphine Gas (PH3) market covering all its essential aspects. This ranges from a macro overview of the market to micro details of the market size, competitive landscape, development trend, niche market, key market drivers and challenges, SWOT analysis, value chain analysis, etc.
The analysis helps the reader to shape the competition within the industries and strategies for the competitive environment to enhance the potential profit. Furthermore, it provides a simple framework for evaluating and accessing the position of the business organization. The report structure also focuses on the competitive landscape of the Global Phosphine Gas (PH3) Market, this report introduces in detail the market share, market performance, product situation, operation situation, etc. of the main players, which helps the readers in the industry to identify the main competitors and deeply understand the competition pattern of the market.
In a word, this report is a must-read for industry players, investors, researchers, consultants, business strategists, and all those who have any kind of stake or are planning to foray into the Phosphine Gas (PH3) market in any manner.
Phosphine Gas (PH3) Market Analysis:
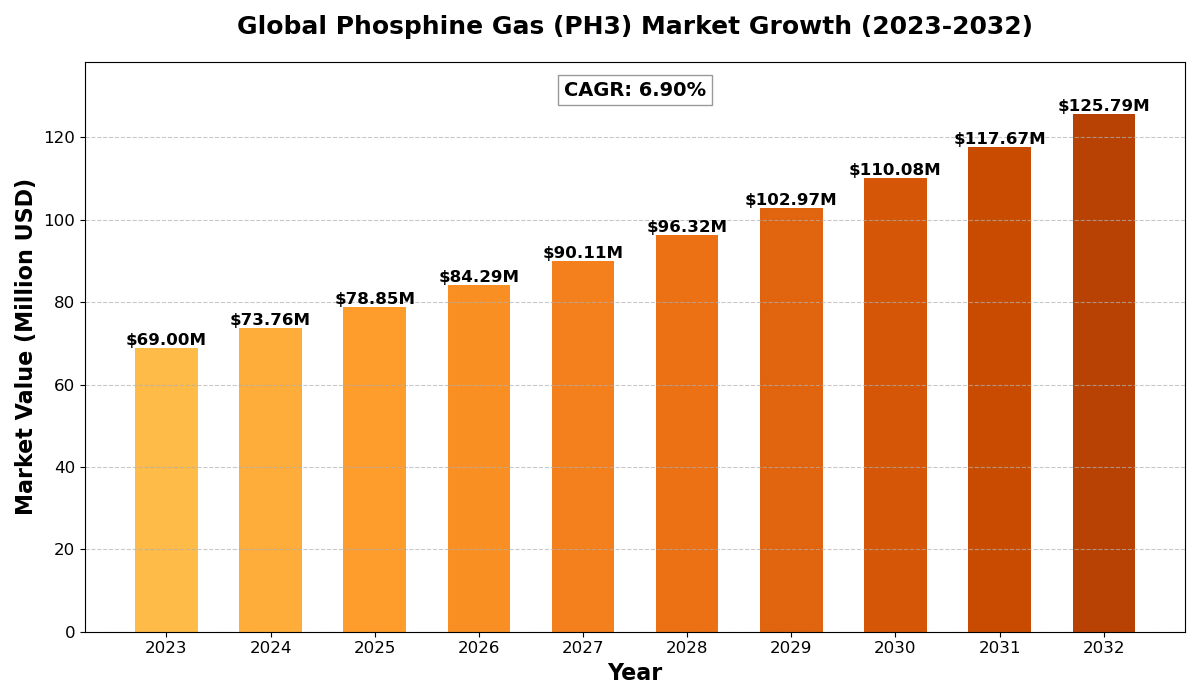
The Global Phosphine Gas (PH3) Market size was estimated at USD 69 million in 2023 and is projected to reach USD 125.79 million by 2032, exhibiting a CAGR of 6.90% during the forecast period.
North America Phosphine Gas (PH3) market size was estimated at USD 20.17 million in 2023, at a CAGR of 5.91% during the forecast period of 2025 through 2032.
Phosphine Gas (PH3) Key Market Trends :
Rising Demand in Semiconductor Industry
- The increasing use of phosphine gas in semiconductor manufacturing, particularly for doping processes, is driving market growth.
Growing Adoption in Fumigation Applications
- PH3 is widely used as a fumigant in agriculture and food storage, leading to higher demand, especially in emerging economies.
Technological Advancements in Gas Purification
- Improved gas purification techniques are enabling the production of ultra-high-purity phosphine gas for advanced applications.
Expansion in the Asia-Pacific Region
- The rapid industrialization in China, Japan, and South Korea is significantly boosting the demand for phosphine gas in electronics and chemical industries.
Stringent Safety and Environmental Regulations
- Governments worldwide are enforcing strict regulations on the handling and transportation of phosphine gas, impacting market dynamics.
Phosphine Gas (PH3) Market Regional Analysis :

North America:
Strong demand driven by EVs, 5G infrastructure, and renewable energy, with the U.S. leading the market.
Europe:
Growth fueled by automotive electrification, renewable energy, and strong regulatory support, with Germany as a key player.
Asia-Pacific:
Dominates the market due to large-scale manufacturing in China and Japan, with growing demand from EVs, 5G, and semiconductors.
South America:
Emerging market, driven by renewable energy and EV adoption, with Brazil leading growth.
Middle East & Africa:
Gradual growth, mainly due to investments in renewable energy and EV infrastructure, with Saudi Arabia and UAE as key contributors.
Phosphine Gas (PH3) Market Segmentation :
The research report includes specific segments by region (country), manufacturers, Type, and Application. Market segmentation creates subsets of a market based on product type, end-user or application, Geographic, and other factors. By understanding the market segments, the decision-maker can leverage this targeting in the product, sales, and marketing strategies. Market segments can power your product development cycles by informing how you create product offerings for different segments.
Key Company
- CYTEC SOLVAY GROUP
- Nippon Chemical Industrial
- Air Products
- Pentagon Chemicals
- Bhagwati Chemicals
- BASF Intermediates
- GASCO
Market Segmentation (by Type)
- Electronic Grade Phosphine Gas (PH3)
- Technical Grade Phosphine Gas (PH3)
Market Segmentation (by Application)
- Organophosphorus Chemistry
- Microelectronics
- Fumigant
Market Drivers
Rising Demand from Semiconductor Industry
- The need for high-purity phosphine gas in semiconductor production is fueling market growth.
Expanding Use in Fumigation
- The agriculture sector relies on phosphine gas as an effective fumigant, increasing its demand globally.
Advancements in Chemical Processing
- Improvements in chemical processing technologies are enhancing the efficiency and applications of phosphine gas.
Market Restraints
Stringent Safety Regulations
- Phosphine gas is highly toxic and flammable, leading to strict government regulations that may hinder market expansion.
High Production and Handling Costs
- The complex purification and handling processes contribute to increased operational expenses.
Limited Awareness in Emerging Markets
- Many developing regions still lack awareness and infrastructure for safe phosphine gas utilization.
Market Opportunities
Growth in Electronics Manufacturing
- The rise in demand for high-performance semiconductors and electronics presents a major opportunity.
Expansion in Developing Regions
- Emerging markets in Asia-Pacific and South America are seeing increased industrial and agricultural use.
Eco-Friendly Alternatives to Traditional Chemicals
- Phosphine gas serves as a greener alternative to some conventional fumigants, driving market preference.
Market Challenges
Health and Safety Risks
- The toxic nature of phosphine gas necessitates stringent safety measures, adding to operational challenges.
Supply Chain Disruptions
- Geopolitical issues and raw material shortages can impact production and distribution.
High Competition Among Key Players
- Established players dominate the market, making it difficult for new entrants to gain traction.
Key Benefits of This Market Research:
- Industry drivers, restraints, and opportunities covered in the study
- Neutral perspective on the market performance
- Recent industry trends and developments
- Competitive landscape & strategies of key players
- Potential & niche segments and regions exhibiting promising growth covered
- Historical, current, and projected market size, in terms of value
- In-depth analysis of the Phosphine Gas (PH3) Market
- Overview of the regional outlook of the Phosphine Gas (PH3) Market:
Key Reasons to Buy this Report:
- Access to date statistics compiled by our researchers. These provide you with historical and forecast data, which is analyzed to tell you why your market is set to change
- This enables you to anticipate market changes to remain ahead of your competitors
- You will be able to copy data from the Excel spreadsheet straight into your marketing plans, business presentations, or other strategic documents
- The concise analysis, clear graph, and table format will enable you to pinpoint the information you require quickly
- Provision of market value data for each segment and sub-segment
- Indicates the region and segment that is expected to witness the fastest growth as well as to dominate the market
- Provides insight into the market through Value Chain
- Market dynamics scenario, along with growth opportunities of the market in the years to come
- 6-month post-sales analyst support
Customization of the Report
In case of any queries or customization requirements, please connect with our sales team, who will ensure that your requirements are met.
FAQs
Q: What are the key driving factors and opportunities in the Phosphine Gas (PH3) market?
A: The primary drivers include the growing demand in the semiconductor and agricultural industries. Opportunities lie in high-purity gas production and increased investments in electronics manufacturing.
Q: Which region is projected to have the largest market share?
A: Asia-Pacific is expected to dominate the market due to its strong semiconductor and electronics industry growth, especially in China, Japan, and South Korea.
Q: Who are the top players in the global Phosphine Gas (PH3) market?
A: Leading companies include CYTEC SOLVAY GROUP, Nippon Chemical Industrial, Air Products, Pentagon Chemicals, Bhagwati Chemicals, BASF Intermediates, and GASCO.
Q: What are the latest technological advancements in the industry?
A: Innovations in gas purification and ultra-high-purity phosphine gas production are key technological advancements shaping the industry.
Q: What is the current size of the global Phosphine Gas (PH3) market?
A: The market was valued at USD 69 million in 2023 and is projected to reach USD 125.79 million by 2032, with a CAGR of 6.90%.
Get Sample Report PDF for Exclusive Insights
Report Sample Includes
- Table of Contents
- List of Tables & Figures
- Charts, Research Methodology, and more...