Global Personal Service Robots Market, Trends, Business Strategies 2025-2032

Global Personal Service Robots market size was estimated at USD 15960 million in 2023 and is projected to reach USD 29589.53 million by 2032, exhibiting a CAGR of 7.10% during the forecast period.

PDF Icon Download Sample Report PDF
  • Quick Dispatch

    All Orders

  • Secure Payment

    100% Secure Payment

Compare

$1,500.00$4,250.00

Clear

Personal Service Robots Market Overview

Personal service robots are those robots that are used for personal use mainly. These robots are mainly brought for self-assistance and for performing non-commercial tasks only. Some of the commonly used Personal Service Robots includes Robots as a domestic servant, automated wheelchair, personal mobility assist robot, and pet exercising robot.

This report provides a deep insight into the global Personal Service Robots market covering all its essential aspects. This ranges from a macro overview of the market to micro details of the market size, competitive landscape, development trend, niche market, key market drivers and challenges, SWOT analysis, value chain analysis, etc.

The analysis helps the reader to shape the competition within the industries and strategies for the competitive environment to enhance the potential profit. Furthermore, it provides a simple framework for evaluating and accessing the position of the business organization. The report structure also focuses on the competitive landscape of the Global Personal Service Robots Market, this report introduces in detail the market share, market performance, product situation, operation situation, etc. of the main players, which helps the readers in the industry to identify the main competitors and deeply understand the competition pattern of the market.
In a word, this report is a must-read for industry players, investors, researchers, consultants, business strategists, and all those who have any kind of stake or are planning to foray into the Personal Service Robots market in any manner.

Personal Service Robots Market Analysis:

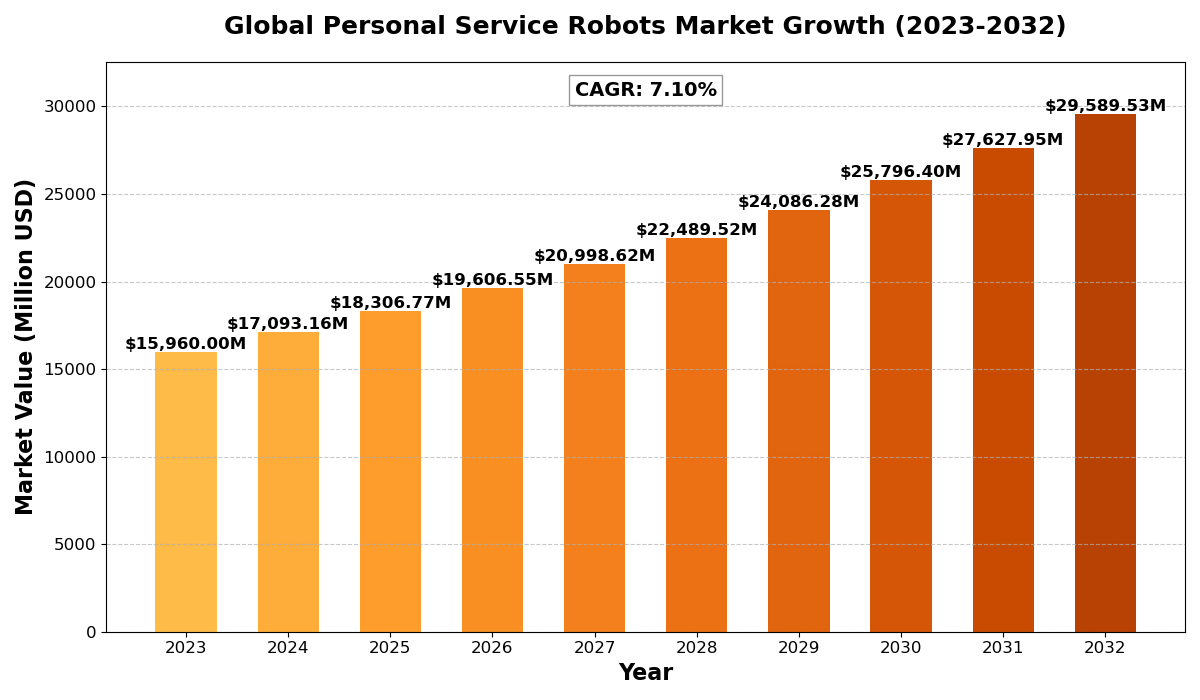
The global Personal Service Robots market size was estimated at USD 15960 million in 2023 and is projected to reach USD 29589.53 million by 2032, exhibiting a CAGR of 7.10% during the forecast period.

North America Personal Service Robots market size was estimated at USD 4680.30 million in 2023, at a CAGR of 6.09% during the forecast period of 2025 through 2032.

Personal Service Robots  Key Market Trends  :

  1. Rising Adoption in Household Applications
    Increasing use of personal service robots for cleaning, cooking, and other household tasks is driving market growth.
  2. Advancements in AI and Machine Learning
    Integration of AI and machine learning is enhancing robot capabilities, making them more efficient and user-friendly.
  3. Growing Demand in Elderly Care
    The aging population is fueling demand for personal robots that assist with healthcare and daily living activities.
  4. Increasing Popularity of Companion Robots
    Emotional support and companionship provided by robots are becoming popular, especially among the elderly and children.
  5. Expansion in Educational Applications
    The use of personal service robots in education for interactive learning and skill development is on the rise.

Personal Service Robots Market Regional Analysis :

semi insight

  • North America:Strong demand driven by EVs, 5G infrastructure, and renewable energy, with the U.S. leading the market.
  • Europe:Growth fueled by automotive electrification, renewable energy, and strong regulatory support, with Germany as a key player.
  • Asia-Pacific:Dominates the market due to large-scale manufacturing in China and Japan, with growing demand from EVs, 5G, and semiconductors.
  • South America:Emerging market, driven by renewable energy and EV adoption, with Brazil leading growth.
  • Middle East & Africa:Gradual growth, mainly due to investments in renewable energy and EV infrastructure, with Saudi Arabia and UAE as key contributors.

Personal Service Robots Market Segmentation :

The research report includes specific segments by region (country), manufacturers, Type, and Application. Market segmentation creates subsets of a market based on product type, end-user or application, Geographic, and other factors. By understanding the market segments, the decision-maker can leverage this targeting in the product, sales, and marketing strategies. Market segments can power your product development cycles by informing how you create product offerings for different segments.
Key Company

  • KUKA AG
  • LELY
  • ECA GROUP
  • Accumen Inc
  • STRYKER
  • Harvest CROO Robotics LLC
  • STARSHIP TECHNOLOGIES
  • Parrot Drone SAS
  • GENERAL ELECTRIC
  • AMAZON ROBOTICS
  • DILIGENT Corporation
  • AMP
  • UVD ROBOTS
  • XAG Co.
  • Ltd.
  • Exyn Technologies

Market Segmentation (by Type)

  • Hardware
  • Software

Market Segmentation (by Application)

  • Personal Cleaning Robots
  • Personal Entertainment and Toy Robots
  • Personal Education Robots
  • Personal Disability Assistive Robots
  • Personal Companion Robots
  • Personal Transportation Robots
  • Personal Safety Robots
  • Others

Drivers

  • Advancements in Robotics and AI Technologies
    Continuous improvements in AI, machine learning, and robotics are propelling the capabilities of personal service robots.
  • Growing Need for Elderly Care Solutions
    The rising aging population is increasing demand for personal robots to assist with healthcare and daily activities.
  • Increased Consumer Interest in Smart Home Devices
    The integration of personal robots with smart home ecosystems is boosting their adoption in households.

Restraints

  • High Initial Costs
    The significant upfront investment required for personal service robots can hinder market growth.
  • Technical Limitations
    Challenges in robot autonomy, battery life, and multi-tasking abilities limit their functionality.
  • Privacy and Security Concerns
    Data privacy and security issues related to connected personal robots can deter potential users.

Opportunities

  • Expansion in Healthcare Applications
    Growing opportunities in healthcare, especially for elderly care and rehabilitation, are driving market potential.
  • Increasing Demand for Educational Robots
    Rising use of robots for interactive learning and skill development presents new growth avenues.
  • Emerging Markets Adoption
    Developing regions are witnessing increased adoption due to growing awareness and affordability.

Challenges

  • Regulatory and Safety Standards
    Navigating complex regulations and ensuring safety standards remain major hurdles for manufacturers.
  • Consumer Acceptance and Trust
    Building trust and ensuring user-friendliness are challenges in promoting widespread adoption.
  • Technical Integration with Smart Devices
    Ensuring seamless integration with other smart devices and systems poses technical challenges.

Key Benefits of This Market Research:

  • Industry drivers, restraints, and opportunities covered in the study
  • Neutral perspective on the market performance
  • Recent industry trends and developments
  • Competitive landscape & strategies of key players
  • Potential & niche segments and regions exhibiting promising growth covered
  • Historical, current, and projected market size, in terms of value
  • In-depth analysis of the Personal Service Robots Market
  • Overview of the regional outlook of the Personal Service Robots Market:

Key Reasons to Buy this Report:

  • Access to date statistics compiled by our researchers. These provide you with historical and forecast data, which is analyzed to tell you why your market is set to change
  • This enables you to anticipate market changes to remain ahead of your competitors
  • You will be able to copy data from the Excel spreadsheet straight into your marketing plans, business presentations, or other strategic documents
  • The concise analysis, clear graph, and table format will enable you to pinpoint the information you require quickly
  • Provision of market value data for each segment and sub-segment
  • Indicates the region and segment that is expected to witness the fastest growth as well as to dominate the market
  • Provides insight into the market through Value Chain
  • Market dynamics scenario, along with growth opportunities of the market in the years to come
  • 6-month post-sales analyst support

Customization of the Report
In case of any queries or customization requirements, please connect with our sales team, who will ensure that your requirements are met.

FAQs

Q: What are the key driving factors and opportunities in the Personal Service Robots market?
A: Key drivers include advancements in AI and robotics, growing demand for elderly care, and increased consumer interest in smart home devices. Opportunities lie in healthcare, education, and emerging markets.


Q: Which region is projected to have the largest market share?
A: Asia-Pacific is expected to dominate the market due to rapid technological advancements, increased adoption in households, and strong government support for robotics.


Q: Who are the top players in the global Personal Service Robots market?
A: Leading companies include iRobot Corporation, SoftBank Robotics, LG Electronics, and Ecovacs Robotics.


Q: What are the latest technological advancements in the industry?
A: Innovations include enhanced AI algorithms, improved battery life, advanced sensors for navigation, and voice recognition capabilities.


Q: What is the current size of the global Personal Service Robots market?
A: The global Personal Service Robots market was valued at approximately USD 5.2 billion in 2023 and is projected to grow at a CAGR of 15.7% from 2025 to 2032.


Global Personal Service Robots Market, Trends, Business Strategies 2025-2032

Get Sample Report PDF for Exclusive Insights

Report Sample Includes

  • Table of Contents
  • List of Tables & Figures
  • Charts, Research Methodology, and more...
PDF Icon Download Sample Report PDF

Download Sample Report

Table of Content

Table of Contents
1 Research Methodology and Statistical Scope
1.1 Market Definition and Statistical Scope of Personal Service Robots
1.2 Key Market Segments
1.2.1 Personal Service Robots Segment by Type
1.2.2 Personal Service Robots Segment by Application
1.3 Methodology & Sources of Information
1.3.1 Research Methodology
1.3.2 Research Process
1.3.3 Market Breakdown and Data Triangulation
1.3.4 Base Year
1.3.5 Report Assumptions & Caveats
2 Personal Service Robots Market Overview
2.1 Global Market Overview
2.1.1 Global Personal Service Robots Market Size (M USD) Estimates and Forecasts (2019-2032)
2.1.2 Global Personal Service Robots Sales Estimates and Forecasts (2019-2032)
2.2 Market Segment Executive Summary
2.3 Global Market Size by Region
3 Personal Service Robots Market Competitive Landscape
3.1 Global Personal Service Robots Sales by Manufacturers (2019-2025)
3.2 Global Personal Service Robots Revenue Market Share by Manufacturers (2019-2025)
3.3 Personal Service Robots Market Share by Company Type (Tier 1, Tier 2, and Tier 3)
3.4 Global Personal Service Robots Average Price by Manufacturers (2019-2025)
3.5 Manufacturers Personal Service Robots Sales Sites, Area Served, Product Type
3.6 Personal Service Robots Market Competitive Situation and Trends
3.6.1 Personal Service Robots Market Concentration Rate
3.6.2 Global 5 and 10 Largest Personal Service Robots Players Market Share by Revenue
3.6.3 Mergers & Acquisitions, Expansion
4 Personal Service Robots Industry Chain Analysis
4.1 Personal Service Robots Industry Chain Analysis
4.2 Market Overview of Key Raw Materials
4.3 Midstream Market Analysis
4.4 Downstream Customer Analysis
5 The Development and Dynamics of Personal Service Robots Market
5.1 Key Development Trends
5.2 Driving Factors
5.3 Market Challenges
5.4 Market Restraints
5.5 Industry News
5.5.1 New Product Developments
5.5.2 Mergers & Acquisitions
5.5.3 Expansions
5.5.4 Collaboration/Supply Contracts
5.6 Industry Policies
6 Personal Service Robots Market Segmentation by Type
6.1 Evaluation Matrix of Segment Market Development Potential (Type)
6.2 Global Personal Service Robots Sales Market Share by Type (2019-2025)
6.3 Global Personal Service Robots Market Size Market Share by Type (2019-2025)
6.4 Global Personal Service Robots Price by Type (2019-2025)
7 Personal Service Robots Market Segmentation by Application
7.1 Evaluation Matrix of Segment Market Development Potential (Application)
7.2 Global Personal Service Robots Market Sales by Application (2019-2025)
7.3 Global Personal Service Robots Market Size (M USD) by Application (2019-2025)
7.4 Global Personal Service Robots Sales Growth Rate by Application (2019-2025)
8 Personal Service Robots Market Consumption by Region
8.1 Global Personal Service Robots Sales by Region
8.1.1 Global Personal Service Robots Sales by Region
8.1.2 Global Personal Service Robots Sales Market Share by Region
8.2 North America
8.2.1 North America Personal Service Robots Sales by Country
8.2.2 U.S.
8.2.3 Canada
8.2.4 Mexico
8.3 Europe
8.3.1 Europe Personal Service Robots Sales by Country
8.3.2 Germany
8.3.3 France
8.3.4 U.K.
8.3.5 Italy
8.3.6 Russia
8.4 Asia Pacific
8.4.1 Asia Pacific Personal Service Robots Sales by Region
8.4.2 China
8.4.3 Japan
8.4.4 South Korea
8.4.5 India
8.4.6 Southeast Asia
8.5 South America
8.5.1 South America Personal Service Robots Sales by Country
8.5.2 Brazil
8.5.3 Argentina
8.5.4 Columbia
8.6 Middle East and Africa
8.6.1 Middle East and Africa Personal Service Robots Sales by Region
8.6.2 Saudi Arabia
8.6.3 UAE
8.6.4 Egypt
8.6.5 Nigeria
8.6.6 South Africa
9 Personal Service Robots Market Production by Region
9.1 Global Production of Personal Service Robots by Region (2019-2025)
9.2 Global Personal Service Robots Revenue Market Share by Region (2019-2025)
9.3 Global Personal Service Robots Production, Revenue, Price and Gross Margin (2019-2025)
9.4 North America Personal Service Robots Production
9.4.1 North America Personal Service Robots Production Growth Rate (2019-2025)
9.4.2 North America Personal Service Robots Production, Revenue, Price and Gross Margin (2019-2025)
9.5 Europe Personal Service Robots Production
9.5.1 Europe Personal Service Robots Production Growth Rate (2019-2025)
9.5.2 Europe Personal Service Robots Production, Revenue, Price and Gross Margin (2019-2025)
9.6 Japan Personal Service Robots Production (2019-2025)
9.6.1 Japan Personal Service Robots Production Growth Rate (2019-2025)
9.6.2 Japan Personal Service Robots Production, Revenue, Price and Gross Margin (2019-2025)
9.7 China Personal Service Robots Production (2019-2025)
9.7.1 China Personal Service Robots Production Growth Rate (2019-2025)
9.7.2 China Personal Service Robots Production, Revenue, Price and Gross Margin (2019-2025)
10 Key Companies Profile
10.1 KUKA AG
10.1.1 KUKA AG Personal Service Robots Basic Information
10.1.2 KUKA AG Personal Service Robots Product Overview
10.1.3 KUKA AG Personal Service Robots Product Market Performance
10.1.4 KUKA AG Business Overview
10.1.5 KUKA AG Personal Service Robots SWOT Analysis
10.1.6 KUKA AG Recent Developments
10.2 LELY
10.2.1 LELY Personal Service Robots Basic Information
10.2.2 LELY Personal Service Robots Product Overview
10.2.3 LELY Personal Service Robots Product Market Performance
10.2.4 LELY Business Overview
10.2.5 LELY Personal Service Robots SWOT Analysis
10.2.6 LELY Recent Developments
10.3 ECA GROUP
10.3.1 ECA GROUP Personal Service Robots Basic Information
10.3.2 ECA GROUP Personal Service Robots Product Overview
10.3.3 ECA GROUP Personal Service Robots Product Market Performance
10.3.4 ECA GROUP Personal Service Robots SWOT Analysis
10.3.5 ECA GROUP Business Overview
10.3.6 ECA GROUP Recent Developments
10.4 Accumen Inc
10.4.1 Accumen Inc Personal Service Robots Basic Information
10.4.2 Accumen Inc Personal Service Robots Product Overview
10.4.3 Accumen Inc Personal Service Robots Product Market Performance
10.4.4 Accumen Inc Business Overview
10.4.5 Accumen Inc Recent Developments
10.5 STRYKER
10.5.1 STRYKER Personal Service Robots Basic Information
10.5.2 STRYKER Personal Service Robots Product Overview
10.5.3 STRYKER Personal Service Robots Product Market Performance
10.5.4 STRYKER Business Overview
10.5.5 STRYKER Recent Developments
10.6 Harvest CROO Robotics LLC
10.6.1 Harvest CROO Robotics LLC Personal Service Robots Basic Information
10.6.2 Harvest CROO Robotics LLC Personal Service Robots Product Overview
10.6.3 Harvest CROO Robotics LLC Personal Service Robots Product Market Performance
10.6.4 Harvest CROO Robotics LLC Business Overview
10.6.5 Harvest CROO Robotics LLC Recent Developments
10.7 STARSHIP TECHNOLOGIES
10.7.1 STARSHIP TECHNOLOGIES Personal Service Robots Basic Information
10.7.2 STARSHIP TECHNOLOGIES Personal Service Robots Product Overview
10.7.3 STARSHIP TECHNOLOGIES Personal Service Robots Product Market Performance
10.7.4 STARSHIP TECHNOLOGIES Business Overview
10.7.5 STARSHIP TECHNOLOGIES Recent Developments
10.8 Parrot Drone SAS
10.8.1 Parrot Drone SAS Personal Service Robots Basic Information
10.8.2 Parrot Drone SAS Personal Service Robots Product Overview
10.8.3 Parrot Drone SAS Personal Service Robots Product Market Performance
10.8.4 Parrot Drone SAS Business Overview
10.8.5 Parrot Drone SAS Recent Developments
10.9 GENERAL ELECTRIC
10.9.1 GENERAL ELECTRIC Personal Service Robots Basic Information
10.9.2 GENERAL ELECTRIC Personal Service Robots Product Overview
10.9.3 GENERAL ELECTRIC Personal Service Robots Product Market Performance
10.9.4 GENERAL ELECTRIC Business Overview
10.9.5 GENERAL ELECTRIC Recent Developments
10.10 AMAZON ROBOTICS
10.10.1 AMAZON ROBOTICS Personal Service Robots Basic Information
10.10.2 AMAZON ROBOTICS Personal Service Robots Product Overview
10.10.3 AMAZON ROBOTICS Personal Service Robots Product Market Performance
10.10.4 AMAZON ROBOTICS Business Overview
10.10.5 AMAZON ROBOTICS Recent Developments
10.11 DILIGENT Corporation
10.11.1 DILIGENT Corporation Personal Service Robots Basic Information
10.11.2 DILIGENT Corporation Personal Service Robots Product Overview
10.11.3 DILIGENT Corporation Personal Service Robots Product Market Performance
10.11.4 DILIGENT Corporation Business Overview
10.11.5 DILIGENT Corporation Recent Developments
10.12 AMP
10.12.1 AMP Personal Service Robots Basic Information
10.12.2 AMP Personal Service Robots Product Overview
10.12.3 AMP Personal Service Robots Product Market Performance
10.12.4 AMP Business Overview
10.12.5 AMP Recent Developments
10.13 UVD ROBOTS
10.13.1 UVD ROBOTS Personal Service Robots Basic Information
10.13.2 UVD ROBOTS Personal Service Robots Product Overview
10.13.3 UVD ROBOTS Personal Service Robots Product Market Performance
10.13.4 UVD ROBOTS Business Overview
10.13.5 UVD ROBOTS Recent Developments
10.14 XAG Co.
10.14.1 XAG Co. Personal Service Robots Basic Information
10.14.2 XAG Co. Personal Service Robots Product Overview
10.14.3 XAG Co. Personal Service Robots Product Market Performance
10.14.4 XAG Co. Business Overview
10.14.5 XAG Co. Recent Developments
10.15 Ltd.
10.15.1 Ltd. Personal Service Robots Basic Information
10.15.2 Ltd. Personal Service Robots Product Overview
10.15.3 Ltd. Personal Service Robots Product Market Performance
10.15.4 Ltd. Business Overview
10.15.5 Ltd. Recent Developments
10.16 Exyn Technologies
10.16.1 Exyn Technologies Personal Service Robots Basic Information
10.16.2 Exyn Technologies Personal Service Robots Product Overview
10.16.3 Exyn Technologies Personal Service Robots Product Market Performance
10.16.4 Exyn Technologies Business Overview
10.16.5 Exyn Technologies Recent Developments
11 Personal Service Robots Market Forecast by Region
11.1 Global Personal Service Robots Market Size Forecast
11.2 Global Personal Service Robots Market Forecast by Region
11.2.1 North America Market Size Forecast by Country
11.2.2 Europe Personal Service Robots Market Size Forecast by Country
11.2.3 Asia Pacific Personal Service Robots Market Size Forecast by Region
11.2.4 South America Personal Service Robots Market Size Forecast by Country
11.2.5 Middle East and Africa Forecasted Consumption of Personal Service Robots by Country
12 Forecast Market by Type and by Application (2025-2032)
12.1 Global Personal Service Robots Market Forecast by Type (2025-2032)
12.1.1 Global Forecasted Sales of Personal Service Robots by Type (2025-2032)
12.1.2 Global Personal Service Robots Market Size Forecast by Type (2025-2032)
12.1.3 Global Forecasted Price of Personal Service Robots by Type (2025-2032)
12.2 Global Personal Service Robots Market Forecast by Application (2025-2032)
12.2.1 Global Personal Service Robots Sales (K Units) Forecast by Application
12.2.2 Global Personal Service Robots Market Size (M USD) Forecast by Application (2025-2032)
13 Conclusion and Key FindingsList of Tables
Table 1. Introduction of the Type
Table 2. Introduction of the Application
Table 3. Market Size (M USD) Segment Executive Summary
Table 4. Personal Service Robots Market Size Comparison by Region (M USD)
Table 5. Global Personal Service Robots Sales (K Units) by Manufacturers (2019-2025)
Table 6. Global Personal Service Robots Sales Market Share by Manufacturers (2019-2025)
Table 7. Global Personal Service Robots Revenue (M USD) by Manufacturers (2019-2025)
Table 8. Global Personal Service Robots Revenue Share by Manufacturers (2019-2025)
Table 9. Company Type (Tier 1, Tier 2, and Tier 3) & (based on the Revenue in Personal Service Robots as of 2022)
Table 10. Global Market Personal Service Robots Average Price (USD/Unit) of Key Manufacturers (2019-2025)
Table 11. Manufacturers Personal Service Robots Sales Sites and Area Served
Table 12. Manufacturers Personal Service Robots Product Type
Table 13. Global Personal Service Robots Manufacturers Market Concentration Ratio (CR5 and HHI)
Table 14. Mergers & Acquisitions, Expansion Plans
Table 15. Industry Chain Map of Personal Service Robots
Table 16. Market Overview of Key Raw Materials
Table 17. Midstream Market Analysis
Table 18. Downstream Customer Analysis
Table 19. Key Development Trends
Table 20. Driving Factors
Table 21. Personal Service Robots Market Challenges
Table 22. Global Personal Service Robots Sales by Type (K Units)
Table 23. Global Personal Service Robots Market Size by Type (M USD)
Table 24. Global Personal Service Robots Sales (K Units) by Type (2019-2025)
Table 25. Global Personal Service Robots Sales Market Share by Type (2019-2025)
Table 26. Global Personal Service Robots Market Size (M USD) by Type (2019-2025)
Table 27. Global Personal Service Robots Market Size Share by Type (2019-2025)
Table 28. Global Personal Service Robots Price (USD/Unit) by Type (2019-2025)
Table 29. Global Personal Service Robots Sales (K Units) by Application
Table 30. Global Personal Service Robots Market Size by Application
Table 31. Global Personal Service Robots Sales by Application (2019-2025) & (K Units)
Table 32. Global Personal Service Robots Sales Market Share by Application (2019-2025)
Table 33. Global Personal Service Robots Sales by Application (2019-2025) & (M USD)
Table 34. Global Personal Service Robots Market Share by Application (2019-2025)
Table 35. Global Personal Service Robots Sales Growth Rate by Application (2019-2025)
Table 36. Global Personal Service Robots Sales by Region (2019-2025) & (K Units)
Table 37. Global Personal Service Robots Sales Market Share by Region (2019-2025)
Table 38. North America Personal Service Robots Sales by Country (2019-2025) & (K Units)
Table 39. Europe Personal Service Robots Sales by Country (2019-2025) & (K Units)
Table 40. Asia Pacific Personal Service Robots Sales by Region (2019-2025) & (K Units)
Table 41. South America Personal Service Robots Sales by Country (2019-2025) & (K Units)
Table 42. Middle East and Africa Personal Service Robots Sales by Region (2019-2025) & (K Units)
Table 43. Global Personal Service Robots Production (K Units) by Region (2019-2025)
Table 44. Global Personal Service Robots Revenue (US$ Million) by Region (2019-2025)
Table 45. Global Personal Service Robots Revenue Market Share by Region (2019-2025)
Table 46. Global Personal Service Robots Production (K Units), Revenue (US$ Million), Price (USD/Unit) and Gross Margin (2019-2025)
Table 47. North America Personal Service Robots Production (K Units), Revenue (US$ Million), Price (USD/Unit) and Gross Margin (2019-2025)
Table 48. Europe Personal Service Robots Production (K Units), Revenue (US$ Million), Price (USD/Unit) and Gross Margin (2019-2025)
Table 49. Japan Personal Service Robots Production (K Units), Revenue (US$ Million), Price (USD/Unit) and Gross Margin (2019-2025)
Table 50. China Personal Service Robots Production (K Units), Revenue (US$ Million), Price (USD/Unit) and Gross Margin (2019-2025)
Table 51. KUKA AG Personal Service Robots Basic Information
Table 52. KUKA AG Personal Service Robots Product Overview
Table 53. KUKA AG Personal Service Robots Sales (K Units), Revenue (M USD), Price (USD/Unit) and Gross Margin (2019-2025)
Table 54. KUKA AG Business Overview
Table 55. KUKA AG Personal Service Robots SWOT Analysis
Table 56. KUKA AG Recent Developments
Table 57. LELY Personal Service Robots Basic Information
Table 58. LELY Personal Service Robots Product Overview
Table 59. LELY Personal Service Robots Sales (K Units), Revenue (M USD), Price (USD/Unit) and Gross Margin (2019-2025)
Table 60. LELY Business Overview
Table 61. LELY Personal Service Robots SWOT Analysis
Table 62. LELY Recent Developments
Table 63. ECA GROUP Personal Service Robots Basic Information
Table 64. ECA GROUP Personal Service Robots Product Overview
Table 65. ECA GROUP Personal Service Robots Sales (K Units), Revenue (M USD), Price (USD/Unit) and Gross Margin (2019-2025)
Table 66. ECA GROUP Personal Service Robots SWOT Analysis
Table 67. ECA GROUP Business Overview
Table 68. ECA GROUP Recent Developments
Table 69. Accumen Inc Personal Service Robots Basic Information
Table 70. Accumen Inc Personal Service Robots Product Overview
Table 71. Accumen Inc Personal Service Robots Sales (K Units), Revenue (M USD), Price (USD/Unit) and Gross Margin (2019-2025)
Table 72. Accumen Inc Business Overview
Table 73. Accumen Inc Recent Developments
Table 74. STRYKER Personal Service Robots Basic Information
Table 75. STRYKER Personal Service Robots Product Overview
Table 76. STRYKER Personal Service Robots Sales (K Units), Revenue (M USD), Price (USD/Unit) and Gross Margin (2019-2025)
Table 77. STRYKER Business Overview
Table 78. STRYKER Recent Developments
Table 79. Harvest CROO Robotics LLC Personal Service Robots Basic Information
Table 80. Harvest CROO Robotics LLC Personal Service Robots Product Overview
Table 81. Harvest CROO Robotics LLC Personal Service Robots Sales (K Units), Revenue (M USD), Price (USD/Unit) and Gross Margin (2019-2025)
Table 82. Harvest CROO Robotics LLC Business Overview
Table 83. Harvest CROO Robotics LLC Recent Developments
Table 84. STARSHIP TECHNOLOGIES Personal Service Robots Basic Information
Table 85. STARSHIP TECHNOLOGIES Personal Service Robots Product Overview
Table 86. STARSHIP TECHNOLOGIES Personal Service Robots Sales (K Units), Revenue (M USD), Price (USD/Unit) and Gross Margin (2019-2025)
Table 87. STARSHIP TECHNOLOGIES Business Overview
Table 88. STARSHIP TECHNOLOGIES Recent Developments
Table 89. Parrot Drone SAS Personal Service Robots Basic Information
Table 90. Parrot Drone SAS Personal Service Robots Product Overview
Table 91. Parrot Drone SAS Personal Service Robots Sales (K Units), Revenue (M USD), Price (USD/Unit) and Gross Margin (2019-2025)
Table 92. Parrot Drone SAS Business Overview
Table 93. Parrot Drone SAS Recent Developments
Table 94. GENERAL ELECTRIC Personal Service Robots Basic Information
Table 95. GENERAL ELECTRIC Personal Service Robots Product Overview
Table 96. GENERAL ELECTRIC Personal Service Robots Sales (K Units), Revenue (M USD), Price (USD/Unit) and Gross Margin (2019-2025)
Table 97. GENERAL ELECTRIC Business Overview
Table 98. GENERAL ELECTRIC Recent Developments
Table 99. AMAZON ROBOTICS Personal Service Robots Basic Information
Table 100. AMAZON ROBOTICS Personal Service Robots Product Overview
Table 101. AMAZON ROBOTICS Personal Service Robots Sales (K Units), Revenue (M USD), Price (USD/Unit) and Gross Margin (2019-2025)
Table 102. AMAZON ROBOTICS Business Overview
Table 103. AMAZON ROBOTICS Recent Developments
Table 104. DILIGENT Corporation Personal Service Robots Basic Information
Table 105. DILIGENT Corporation Personal Service Robots Product Overview
Table 106. DILIGENT Corporation Personal Service Robots Sales (K Units), Revenue (M USD), Price (USD/Unit) and Gross Margin (2019-2025)
Table 107. DILIGENT Corporation Business Overview
Table 108. DILIGENT Corporation Recent Developments
Table 109. AMP Personal Service Robots Basic Information
Table 110. AMP Personal Service Robots Product Overview
Table 111. AMP Personal Service Robots Sales (K Units), Revenue (M USD), Price (USD/Unit) and Gross Margin (2019-2025)
Table 112. AMP Business Overview
Table 113. AMP Recent Developments
Table 114. UVD ROBOTS Personal Service Robots Basic Information
Table 115. UVD ROBOTS Personal Service Robots Product Overview
Table 116. UVD ROBOTS Personal Service Robots Sales (K Units), Revenue (M USD), Price (USD/Unit) and Gross Margin (2019-2025)
Table 117. UVD ROBOTS Business Overview
Table 118. UVD ROBOTS Recent Developments
Table 119. XAG Co. Personal Service Robots Basic Information
Table 120. XAG Co. Personal Service Robots Product Overview
Table 121. XAG Co. Personal Service Robots Sales (K Units), Revenue (M USD), Price (USD/Unit) and Gross Margin (2019-2025)
Table 122. XAG Co. Business Overview
Table 123. XAG Co. Recent Developments
Table 124. Ltd. Personal Service Robots Basic Information
Table 125. Ltd. Personal Service Robots Product Overview
Table 126. Ltd. Personal Service Robots Sales (K Units), Revenue (M USD), Price (USD/Unit) and Gross Margin (2019-2025)
Table 127. Ltd. Business Overview
Table 128. Ltd. Recent Developments
Table 129. Exyn Technologies Personal Service Robots Basic Information
Table 130. Exyn Technologies Personal Service Robots Product Overview
Table 131. Exyn Technologies Personal Service Robots Sales (K Units), Revenue (M USD), Price (USD/Unit) and Gross Margin (2019-2025)
Table 132. Exyn Technologies Business Overview
Table 133. Exyn Technologies Recent Developments
Table 134. Global Personal Service Robots Sales Forecast by Region (2025-2032) & (K Units)
Table 135. Global Personal Service Robots Market Size Forecast by Region (2025-2032) & (M USD)
Table 136. North America Personal Service Robots Sales Forecast by Country (2025-2032) & (K Units)
Table 137. North America Personal Service Robots Market Size Forecast by Country (2025-2032) & (M USD)
Table 138. Europe Personal Service Robots Sales Forecast by Country (2025-2032) & (K Units)
Table 139. Europe Personal Service Robots Market Size Forecast by Country (2025-2032) & (M USD)
Table 140. Asia Pacific Personal Service Robots Sales Forecast by Region (2025-2032) & (K Units)
Table 141. Asia Pacific Personal Service Robots Market Size Forecast by Region (2025-2032) & (M USD)
Table 142. South America Personal Service Robots Sales Forecast by Country (2025-2032) & (K Units)
Table 143. South America Personal Service Robots Market Size Forecast by Country (2025-2032) & (M USD)
Table 144. Middle East and Africa Personal Service Robots Consumption Forecast by Country (2025-2032) & (Units)
Table 145. Middle East and Africa Personal Service Robots Market Size Forecast by Country (2025-2032) & (M USD)
Table 146. Global Personal Service Robots Sales Forecast by Type (2025-2032) & (K Units)
Table 147. Global Personal Service Robots Market Size Forecast by Type (2025-2032) & (M USD)
Table 148. Global Personal Service Robots Price Forecast by Type (2025-2032) & (USD/Unit)
Table 149. Global Personal Service Robots Sales (K Units) Forecast by Application (2025-2032)
Table 150. Global Personal Service Robots Market Size Forecast by Application (2025-2032) & (M USD)
List of Figures
Figure 1. Product Picture of Personal Service Robots
Figure 2. Data Triangulation
Figure 3. Key Caveats
Figure 4. Global Personal Service Robots Market Size (M USD), 2019-2032
Figure 5. Global Personal Service Robots Market Size (M USD) (2019-2032)
Figure 6. Global Personal Service Robots Sales (K Units) & (2019-2032)
Figure 7. Evaluation Matrix of Segment Market Development Potential (Type)
Figure 8. Evaluation Matrix of Segment Market Development Potential (Application)
Figure 9. Evaluation Matrix of Regional Market Development Potential
Figure 10. Personal Service Robots Market Size by Country (M USD)
Figure 11. Personal Service Robots Sales Share by Manufacturers in 2023
Figure 12. Global Personal Service Robots Revenue Share by Manufacturers in 2023
Figure 13. Personal Service Robots Market Share by Company Type (Tier 1, Tier 2 and Tier 3): 2023
Figure 14. Global Market Personal Service Robots Average Price (USD/Unit) of Key Manufacturers in 2023
Figure 15. The Global 5 and 10 Largest Players: Market Share by Personal Service Robots Revenue in 2023
Figure 16. Evaluation Matrix of Segment Market Development Potential (Type)
Figure 17. Global Personal Service Robots Market Share by Type
Figure 18. Sales Market Share of Personal Service Robots by Type (2019-2025)
Figure 19. Sales Market Share of Personal Service Robots by Type in 2023
Figure 20. Market Size Share of Personal Service Robots by Type (2019-2025)
Figure 21. Market Size Market Share of Personal Service Robots by Type in 2023
Figure 22. Evaluation Matrix of Segment Market Development Potential (Application)
Figure 23. Global Personal Service Robots Market Share by Application
Figure 24. Global Personal Service Robots Sales Market Share by Application (2019-2025)
Figure 25. Global Personal Service Robots Sales Market Share by Application in 2023
Figure 26. Global Personal Service Robots Market Share by Application (2019-2025)
Figure 27. Global Personal Service Robots Market Share by Application in 2023
Figure 28. Global Personal Service Robots Sales Growth Rate by Application (2019-2025)
Figure 29. Global Personal Service Robots Sales Market Share by Region (2019-2025)
Figure 30. North America Personal Service Robots Sales and Growth Rate (2019-2025) & (K Units)
Figure 31. North America Personal Service Robots Sales Market Share by Country in 2023
Figure 32. U.S. Personal Service Robots Sales and Growth Rate (2019-2025) & (K Units)
Figure 33. Canada Personal Service Robots Sales (K Units) and Growth Rate (2019-2025)
Figure 34. Mexico Personal Service Robots Sales (Units) and Growth Rate (2019-2025)
Figure 35. Europe Personal Service Robots Sales and Growth Rate (2019-2025) & (K Units)
Figure 36. Europe Personal Service Robots Sales Market Share by Country in 2023
Figure 37. Germany Personal Service Robots Sales and Growth Rate (2019-2025) & (K Units)
Figure 38. France Personal Service Robots Sales and Growth Rate (2019-2025) & (K Units)
Figure 39. U.K. Personal Service Robots Sales and Growth Rate (2019-2025) & (K Units)
Figure 40. Italy Personal Service Robots Sales and Growth Rate (2019-2025) & (K Units)
Figure 41. Russia Personal Service Robots Sales and Growth Rate (2019-2025) & (K Units)
Figure 42. Asia Pacific Personal Service Robots Sales and Growth Rate (K Units)
Figure 43. Asia Pacific Personal Service Robots Sales Market Share by Region in 2023
Figure 44. China Personal Service Robots Sales and Growth Rate (2019-2025) & (K Units)
Figure 45. Japan Personal Service Robots Sales and Growth Rate (2019-2025) & (K Units)
Figure 46. South Korea Personal Service Robots Sales and Growth Rate (2019-2025) & (K Units)
Figure 47. India Personal Service Robots Sales and Growth Rate (2019-2025) & (K Units)
Figure 48. Southeast Asia Personal Service Robots Sales and Growth Rate (2019-2025) & (K Units)
Figure 49. South America Personal Service Robots Sales and Growth Rate (K Units)
Figure 50. South America Personal Service Robots Sales Market Share by Country in 2023
Figure 51. Brazil Personal Service Robots Sales and Growth Rate (2019-2025) & (K Units)
Figure 52. Argentina Personal Service Robots Sales and Growth Rate (2019-2025) & (K Units)
Figure 53. Columbia Personal Service Robots Sales and Growth Rate (2019-2025) & (K Units)
Figure 54. Middle East and Africa Personal Service Robots Sales and Growth Rate (K Units)
Figure 55. Middle East and Africa Personal Service Robots Sales Market Share by Region in 2023
Figure 56. Saudi Arabia Personal Service Robots Sales and Growth Rate (2019-2025) & (K Units)
Figure 57. UAE Personal Service Robots Sales and Growth Rate (2019-2025) & (K Units)
Figure 58. Egypt Personal Service Robots Sales and Growth Rate (2019-2025) & (K Units)
Figure 59. Nigeria Personal Service Robots Sales and Growth Rate (2019-2025) & (K Units)
Figure 60. South Africa Personal Service Robots Sales and Growth Rate (2019-2025) & (K Units)
Figure 61. Global Personal Service Robots Production Market Share by Region (2019-2025)
Figure 62. North America Personal Service Robots Production (K Units) Growth Rate (2019-2025)
Figure 63. Europe Personal Service Robots Production (K Units) Growth Rate (2019-2025)
Figure 64. Japan Personal Service Robots Production (K Units) Growth Rate (2019-2025)
Figure 65. China Personal Service Robots Production (K Units) Growth Rate (2019-2025)
Figure 66. Global Personal Service Robots Sales Forecast by Volume (2019-2032) & (K Units)
Figure 67. Global Personal Service Robots Market Size Forecast by Value (2019-2032) & (M USD)
Figure 68. Global Personal Service Robots Sales Market Share Forecast by Type (2025-2032)
Figure 69. Global Personal Service Robots Market Share Forecast by Type (2025-2032)
Figure 70. Global Personal Service Robots Sales Forecast by Application (2025-2032)
Figure 71. Global Personal Service Robots Market Share Forecast by Application (2025-2032)