Global Personal Computer (PC) Monitor Market Research Report 2025(Status and Outlook)

Personal Computer (PC) Monitor Market size was valued at US$ 13,740 million in 2024 and is projected to reach US$ 18,940 million by 2032, at a CAGR of 4.7% during the forecast period 2025-2032

PDF Icon Download Sample Report PDF
  • Quick Dispatch

    All Orders

  • Secure Payment

    100% Secure Payment

Compare

$1,500.00$4,250.00

Clear

MARKET INSIGHTS

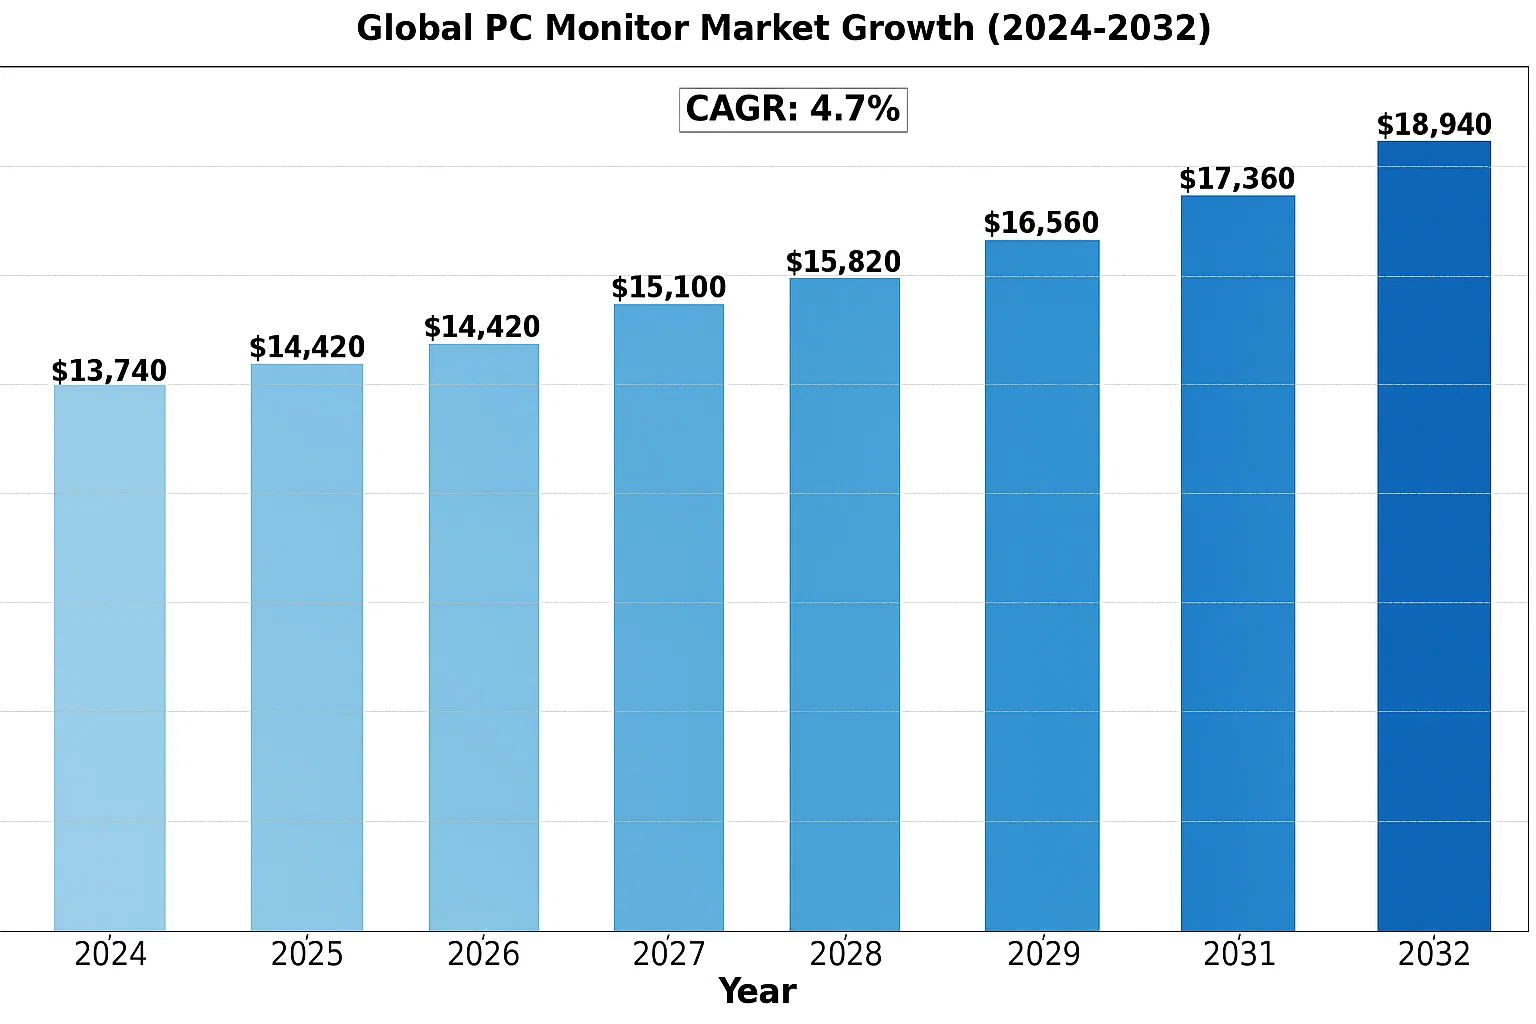
The Global Personal Computer (PC) Monitor Market size was valued at US$ 13,740 million in 2024 and is projected to reach US$ 18,940 million by 2032, at a CAGR of 4.7% during the forecast period 2025-2032.

PC monitors are display devices that connect to computer systems to provide visual output. These devices range from traditional LCD/LED panels to advanced gaming monitors with high refresh rates (144Hz-360Hz) and cutting-edge OLED displays offering superior color accuracy. Key specifications include resolution (HD, Full HD, 4K, 8K), panel type (IPS, TN, VA), screen size (ranging from 15″ to 49″ ultrawide formats), and specialized features like HDR and adaptive sync technologies.

The market growth is driven by increasing demand for high-resolution displays in professional and gaming applications, along with the rising adoption of multi-monitor setups in corporate environments. However, the segment faces challenges from the growing popularity of all-in-one PCs and laptop-first work cultures. Recent technological advancements like mini-LED backlighting and quantum dot enhancement films are creating new opportunities, particularly in the premium monitor segment where companies like Dell and Samsung are introducing innovative products with improved energy efficiency and slim bezel designs.

MARKET DYNAMICS

MARKET DRIVERS

Global Rise in Remote Work and Hybrid Offices Fueling PC Monitor Demand

The shift to remote work culture has become a permanent fixture across industries, driving sustained demand for PC monitors. With over 58% of American workers now operating in hybrid arrangements, home office setups require multiple displays for productivity. This trend accelerated during the pandemic and shows no signs of reversing, as companies realize the cost savings from reduced office footprints. High-resolution monitors between 24-27 inches have seen particular growth, becoming the new standard for professional use cases.

Esports Boom and Gaming Monitor Innovations Accelerating Market Growth

The global esports industry, valued at nearly $1.38 billion, continues to push monitor technology boundaries. Competitive gaming requires ultra-fast refresh rates (now reaching 500Hz) and near-instant response times under 1ms. Major manufacturers are responding with curved OLED panels featuring adaptive sync technologies. The gaming monitor segment grew by approximately 19% last year alone, representing one of the fastest-growing categories in the display market. New innovations like mini-LED backlighting further enhance contrast ratios for immersive gameplay experiences.

Moreover, content creators are driving adoption of 4K and 8K professional monitors. Photographers, video editors and 3D artists require perfect color accuracy (covering 99% Adobe RGB) and high pixel density for detailed work.

For instance, LG’s 32-inch 8K monitor with 10-bit color depth and 1000-nit brightness has become an industry benchmark for creative professionals.

These high-end segments command premium pricing while pushing technological advancements that eventually trickle down to mainstream models.

MARKET RESTRAINTS

Smartphone and Tablet Cannibalization Impacting Entry-Level Monitor Sales

While premium monitor segments thrive, basic 1080p models face declining demand due to mobile device substitution. Many casual users now rely solely on smartphones and tablets for everyday computing tasks, delaying monitor purchases. This trend particularly affects emerging markets where mobile penetration exceeds computer ownership. Industry data suggests entry-level monitor shipments decreased by approximately 8% last year as consumers prioritize mobile upgrades over secondary displays.

Other Restraints

Supply Chain Volatility
Panel production remains concentrated in Asia, making the industry susceptible to geopolitical tensions and logistics disruptions. Display driver IC shortages continue impacting manufacturing schedules despite improving from pandemic-era crisis levels.

Environmental Regulations
Stricter energy efficiency requirements across regions compel redesigns that increase production costs. The EU’s latest EcoDesign regulations demand power consumption cuts up to 40% for certain monitor categories.

MARKET CHALLENGES

Panel Overcapacity Creating Pricing Pressures Across Market Segments

The display industry faces cyclical oversupply conditions as Chinese panel makers aggressively expand production capacity. This has led to dramatic price erosion – some 27-inch IPS panels now wholesale for 22% less than two years ago. While benefiting consumers, these conditions squeeze manufacturer margins and discourage R&D investment. Panel makers attempt to differentiate through features rather than competing solely on price, but the market remains extremely competitive.

Other Challenges

Technology Transition Costs
Shifting from LCD to next-gen technologies like microLED requires massive capital expenditures exceeding $5 billion per fabrication plant, creating financial barriers.

Channel Inventory Management
Retailers maintain leaner inventories post-pandemic, forcing manufacturers to implement just-in-time production strategies and sophisticated demand forecasting.

MARKET OPPORTUNITIES

Healthcare Sector Digital Transformation Creates New Monitor Applications

Hospital digitization initiatives worldwide are driving demand for specialized medical monitors. These displays must meet stringent regulatory requirements for brightness consistency (≤10% deviation), grayscale performance, and antimicrobial coatings. The medical monitor market grows approximately 9% annually as facilities upgrade diagnostic imaging systems and digital patient records infrastructure. New surgical monitors with 4K 3D visualization capabilities enable minimally invasive procedures with enhanced precision.

Emerging Markets Present Untapped Growth Potential

While mature markets approach saturation, developing regions in Southeast Asia, Latin America and Africa show strong monitor adoption curves. Improving internet infrastructure and growing IT sectors create demand for productivity displays. Government digital education programs also contribute – India’s edtech initiatives alone deployed over 2 million monitors to schools last year. Localization strategies including regional distribution partnerships and affordable installment payment options help manufacturers capitalize on these growth frontiers.

GLOBAL PERSONAL COMPUTER (PC) MONITOR MARKET TRENDS

Rising Demand for High Refresh Rate and Low Response Time Monitors

The increasing popularity of competitive gaming and esports has fueled significant demand for high-performance monitors with refresh rates exceeding 144Hz and response times below 1ms. Currently, gaming monitors account for over 30% of total PC monitor shipments, with this segment growing at nearly 15% annually. Consumers are prioritizing monitors with technologies like NVIDIA G-SYNC and AMD FreeSync to eliminate screen tearing during fast-paced gameplay. Major manufacturers have responded by introducing ultra-wide curved monitors with refresh rates up to 360Hz, catering specifically to professional gamers who require split-second response advantages.

Other Trends

4K/UHD Adoption Accelerates

The shift towards higher resolution displays continues gaining momentum, with 4K/UHD monitors now representing about 25% of total market revenues. This growth is driven by professionals in creative industries such as video editing, graphic design, and CAD engineering who require precise pixel-perfect displays. Declining panel production costs have made 4K monitors more affordable, with average selling prices dropping by approximately 35% over the past three years. Furthermore, the increasing availability of HDMI 2.1 and DisplayPort 2.0 compatible monitors ensures these high-resolution displays can fully leverage next-generation graphics hardware.

Remote Work Expansion Stimulates Monitor Market

The global shift towards hybrid and remote work arrangements has created sustained demand for home office setups featuring multi-monitor configurations. Recent surveys indicate that over 60% of knowledge workers now use two or more monitors, compared to just 35% pre-pandemic. This trend has particularly benefited the market for mid-range business monitors featuring eye-care technologies like flicker-free backlighting and low blue light emission. Manufacturers have responded by developing productivity-focused monitors with USB-C docking capabilities, built-in webcams, and adjustable ergonomic stands to accommodate extended work sessions.

COMPETITIVE LANDSCAPE

Key Industry Players

Innovation and Market Expansion Drive Competition in the PC Monitor Landscape

The global PC monitor market exhibits a highly competitive environment dominated by multinational electronics corporations and specialized display manufacturers. According to recent industry analyses, the market remains largely consolidated among top-tier players, though mid-size manufacturers continue to gain traction through strategic differentiation in gaming, professional, and budget segments.

Dell Technologies maintains leadership with approximately 22% market share in Q1 2023, credited to its commercial segment dominance and Alienware gaming monitor innovations. Close competitor HP Inc. follows with 18% share, benefiting from strong enterprise partnerships and its Omen gaming monitor lineup. Both companies leverage vertical integration advantages through their existing PC ecosystems.

Korean giants Samsung Electronics and LG Display collectively control nearly 30% of the premium monitor segment through OLED and quantum-dot display technologies. Their 2024 product refreshes emphasize 240Hz+ refresh rates and 8K resolution adoption, catering to professional creators and esports enthusiasts.

Meanwhile, TPV Technology (AOC/Philips monitors) and Lenovo have intensified competition through aggressive pricing strategies for mainstream 1080p and 1440p models. TPV reportedly shipped 12 million units in 2023 alone, primarily to Asian and European markets.

List of Key PC Monitor Manufacturers Profiled

Segment Analysis:

By Type

High-Resolution Monitors Segment Dominates Due to Growing Demand for Enhanced Visual Experience

The market is segmented based on type into:

  • Esports Monitors
    • Subtypes: Ultra-wide, Curved, and others
  • High-Resolution Monitors
  • Surface Monitors
  • Standard Monitors
  • Others

By Application

Gaming Series Leads Market Adoption Driven by Rising Esports and High-Performance Computing Needs

The market is segmented based on application into:

  • Gaming Series
  • Business Series
  • Home Entertainment
  • Professional Design
  • Others

By Display Technology

LED Backlit LCDs Maintain Market Dominance Due to Cost-Effectiveness and Energy Efficiency

The market is segmented based on display technology into:

  • LCD
    • Subtypes: LED-backlit, CCFL-backlit
  • OLED
  • QLED
  • Others

By Screen Size

27-32 Inches Segment Gains Traction as the Optimal Balance Between Workspace and Viewing Comfort

The market is segmented based on screen size into:

  • Below 24 inches
  • 24-27 inches
  • 27-32 inches
  • Above 32 inches

Regional Analysis: Global Personal Computer (PC) Monitor Market

North America
The North American PC monitor market is characterized by high adoption rates of premium displays, driven by robust gaming, corporate, and creative professional sectors. With major brands like Dell, HP, and LG dominating the landscape, the region sees strong demand for high-resolution (4K/8K) and ultrawide monitors, particularly in the U.S. and Canada. The work-from-home trend post-pandemic continues to influence purchasing patterns, with hybrid work models sustaining steady demand for ergonomic and productivity-focused monitors. However, market saturation in some segments has led manufacturers to focus on innovation in OLED and mini-LED technologies to stimulate upgrades. Environmental regulations, such as ENERGY STAR certification requirements, are shaping product development toward energy-efficient designs.

Europe
Europe’s mature market prioritizes sustainability and performance, with stringent EU energy efficiency directives pushing manufacturers toward eco-friendly monitors. Germany and the UK lead in adoption of business-class monitors, while Southern Europe shows growing interest in budget-friendly models. The gaming segment is expanding rapidly, fueled by increasing esports participation and demand for high-refresh-rate displays. Brands like AOC and Samsung are gaining traction with competitively priced curved and gaming-focused monitors. However, inflationary pressures and energy crises in some countries have temporarily slowed replacement cycles, particularly in price-sensitive consumer segments.

Asia-Pacific
As the largest and fastest-growing regional market, Asia-Pacific benefits from strong OEM presence and massive consumer bases in China, India, and Southeast Asia. China dominates both production and consumption, with local brands like TPV and HUIKE competing aggressively on price. The region shows divergent trends – while mature markets like Japan and South Korea demand cutting-edge technology, emerging economies prioritize affordability, driving sales of entry-level Full HD monitors. India’s expanding IT sector and gaming culture are creating new growth pockets. Manufacturing advantages in Taiwan and China keep production costs low, though supply chain diversification is underway due to geopolitical tensions.

South America
The South American market operates with distinct pricing sensitivities, where economic volatility often dictates purchasing power. Brazil and Argentina represent the largest markets, with consumers favoring value-oriented brands and smaller screen sizes (21-24 inches) for cost efficiency. Corporate purchases are gradually increasing as businesses modernize infrastructure, though adoption of advanced features like HDR and high refresh rates remains limited outside major metropolitan areas. Import dependencies and currency fluctuations create pricing challenges, leading some manufacturers to establish local assembly operations to improve affordability.

Middle East & Africa
This emerging market demonstrates two-tiered growth patterns. Gulf Cooperation Council (GCC) countries show appetite for premium gaming and professional monitors, driven by high disposable incomes and developing tech ecosystems. In contrast, African markets focus on affordable, durable displays for educational and entry-level business use. Infrastructure limitations like inconsistent power supply in some areas influence product specifications, with energy-efficient LED backlit models gaining preference. The region sees increasing competition from Chinese brands offering competitive warranties and localized support.

Report Scope

This market research report provides a comprehensive analysis of the Global and regional Personal Computer (PC) Monitor markets, covering the forecast period 2025–2032. It offers detailed insights into market dynamics, technological advancements, competitive landscape, and key trends shaping the industry.

Key focus areas of the report include:

  • Market Size & Forecast: Historical data and future projections for revenue, unit shipments, and market value across major regions and segments. The Global PC Monitor market was valued at USD 38.2 billion in 2024 and is projected to reach USD 48.5 billion by 2032.
  • Segmentation Analysis: Detailed breakdown by product type (Esports Monitors, High Resolution Monitors, Surface Monitors), technology (LCD, OLED, QLED), application (Gaming, Business, Others), and end-user industry to identify high-growth segments and investment opportunities.
  • Regional Outlook: Insights into market performance across North America, Europe, Asia-Pacific, Latin America, and the Middle East & Africa, including country-level analysis where relevant. Asia-Pacific dominates with over 40% market share.
  • Competitive Landscape: Profiles of leading market participants including Dell, HP, LG, Samsung, Lenovo, AOC, TPV, and HUIKE ELECTRONICS, including their product portfolios, R&D focus, manufacturing strategies, and recent developments.
  • Technology Trends & Innovation: Assessment of emerging technologies including mini-LED, micro-LED, high refresh rates (up to 360Hz), and HDR advancements.
  • Market Drivers & Restraints: Evaluation of factors driving market growth (remote work trends, esports popularity) along with challenges (supply chain constraints, component shortages).
  • Stakeholder Analysis: Insights for panel manufacturers, OEMs, distributors, retailers, and investors regarding strategic opportunities in the evolving display ecosystem.

Primary and secondary research methods are employed, including interviews with industry experts, data from verified sources, and real-time market intelligence to ensure the accuracy and reliability of the insights presented.

FREQUENTLY ASKED QUESTIONS:

What is the current market size of Global PC Monitor Market?

-> Personal Computer (PC) Monitor Market size was valued at US$ 13,740 million in 2024 and is projected to reach US$ 18,940 million by 2032, at a CAGR of 4.7% during the forecast period 2025-2032.

Which key companies operate in Global PC Monitor Market?

-> Key players include Dell, HP, LG, Samsung, Lenovo, AOC, TPV, and HUIKE ELECTRONICS.

What are the key growth drivers?

-> Key growth drivers include hybrid work models, gaming industry expansion, and demand for high-resolution displays.

Which region dominates the market?

-> Asia-Pacific holds the largest market share (over 40%), driven by manufacturing hubs in China and growing demand in India.

What are the emerging trends?

-> Emerging trends include ultra-wide curved displays, 8K resolution adoption, and integration with IoT ecosystems.

Global Personal Computer (PC) Monitor Market Research Report 2025(Status and Outlook)

Get Sample Report PDF for Exclusive Insights

Report Sample Includes

  • Table of Contents
  • List of Tables & Figures
  • Charts, Research Methodology, and more...
PDF Icon Download Sample Report PDF

Download Sample Report

Table of Content

Table of Contents
1 Research Methodology and Statistical Scope
1.1 Market Definition and Statistical Scope of Personal Computer (PC) Monitor
1.2 Key Market Segments
1.2.1 Personal Computer (PC) Monitor Segment by Type
1.2.2 Personal Computer (PC) Monitor Segment by Application
1.3 Methodology & Sources of Information
1.3.1 Research Methodology
1.3.2 Research Process
1.3.3 Market Breakdown and Data Triangulation
1.3.4 Base Year
1.3.5 Report Assumptions & Caveats
2 Personal Computer (PC) Monitor Market Overview
2.1 Global Market Overview
2.1.1 Global Personal Computer (PC) Monitor Market Size (M USD) Estimates and Forecasts (2019-2032)
2.1.2 Global Personal Computer (PC) Monitor Sales Estimates and Forecasts (2019-2032)
2.2 Market Segment Executive Summary
2.3 Global Market Size by Region
3 Personal Computer (PC) Monitor Market Competitive Landscape
3.1 Global Personal Computer (PC) Monitor Sales by Manufacturers (2019-2025)
3.2 Global Personal Computer (PC) Monitor Revenue Market Share by Manufacturers (2019-2025)
3.3 Personal Computer (PC) Monitor Market Share by Company Type (Tier 1, Tier 2, and Tier 3)
3.4 Global Personal Computer (PC) Monitor Average Price by Manufacturers (2019-2025)
3.5 Manufacturers Personal Computer (PC) Monitor Sales Sites, Area Served, Product Type
3.6 Personal Computer (PC) Monitor Market Competitive Situation and Trends
3.6.1 Personal Computer (PC) Monitor Market Concentration Rate
3.6.2 Global 5 and 10 Largest Personal Computer (PC) Monitor Players Market Share by Revenue
3.6.3 Mergers & Acquisitions, Expansion
4 Personal Computer (PC) Monitor Industry Chain Analysis
4.1 Personal Computer (PC) Monitor Industry Chain Analysis
4.2 Market Overview of Key Raw Materials
4.3 Midstream Market Analysis
4.4 Downstream Customer Analysis
5 The Development and Dynamics of Personal Computer (PC) Monitor Market
5.1 Key Development Trends
5.2 Driving Factors
5.3 Market Challenges
5.4 Market Restraints
5.5 Industry News
5.5.1 New Product Developments
5.5.2 Mergers & Acquisitions
5.5.3 Expansions
5.5.4 Collaboration/Supply Contracts
5.6 Industry Policies
6 Personal Computer (PC) Monitor Market Segmentation by Type
6.1 Evaluation Matrix of Segment Market Development Potential (Type)
6.2 Global Personal Computer (PC) Monitor Sales Market Share by Type (2019-2025)
6.3 Global Personal Computer (PC) Monitor Market Size Market Share by Type (2019-2025)
6.4 Global Personal Computer (PC) Monitor Price by Type (2019-2025)
7 Personal Computer (PC) Monitor Market Segmentation by Application
7.1 Evaluation Matrix of Segment Market Development Potential (Application)
7.2 Global Personal Computer (PC) Monitor Market Sales by Application (2019-2025)
7.3 Global Personal Computer (PC) Monitor Market Size (M USD) by Application (2019-2025)
7.4 Global Personal Computer (PC) Monitor Sales Growth Rate by Application (2019-2025)
8 Personal Computer (PC) Monitor Market Segmentation by Region
8.1 Global Personal Computer (PC) Monitor Sales by Region
8.1.1 Global Personal Computer (PC) Monitor Sales by Region
8.1.2 Global Personal Computer (PC) Monitor Sales Market Share by Region
8.2 North America
8.2.1 North America Personal Computer (PC) Monitor Sales by Country
8.2.2 U.S.
8.2.3 Canada
8.2.4 Mexico
8.3 Europe
8.3.1 Europe Personal Computer (PC) Monitor Sales by Country
8.3.2 Germany
8.3.3 France
8.3.4 U.K.
8.3.5 Italy
8.3.6 Russia
8.4 Asia Pacific
8.4.1 Asia Pacific Personal Computer (PC) Monitor Sales by Region
8.4.2 China
8.4.3 Japan
8.4.4 South Korea
8.4.5 India
8.4.6 Southeast Asia
8.5 South America
8.5.1 South America Personal Computer (PC) Monitor Sales by Country
8.5.2 Brazil
8.5.3 Argentina
8.5.4 Columbia
8.6 Middle East and Africa
8.6.1 Middle East and Africa Personal Computer (PC) Monitor Sales by Region
8.6.2 Saudi Arabia
8.6.3 UAE
8.6.4 Egypt
8.6.5 Nigeria
8.6.6 South Africa
9 Key Companies Profile
9.1 Dell
9.1.1 Dell Personal Computer (PC) Monitor Basic Information
9.1.2 Dell Personal Computer (PC) Monitor Product Overview
9.1.3 Dell Personal Computer (PC) Monitor Product Market Performance
9.1.4 Dell Business Overview
9.1.5 Dell Personal Computer (PC) Monitor SWOT Analysis
9.1.6 Dell Recent Developments
9.2 HP
9.2.1 HP Personal Computer (PC) Monitor Basic Information
9.2.2 HP Personal Computer (PC) Monitor Product Overview
9.2.3 HP Personal Computer (PC) Monitor Product Market Performance
9.2.4 HP Business Overview
9.2.5 HP Personal Computer (PC) Monitor SWOT Analysis
9.2.6 HP Recent Developments
9.3 TPV
9.3.1 TPV Personal Computer (PC) Monitor Basic Information
9.3.2 TPV Personal Computer (PC) Monitor Product Overview
9.3.3 TPV Personal Computer (PC) Monitor Product Market Performance
9.3.4 TPV Personal Computer (PC) Monitor SWOT Analysis
9.3.5 TPV Business Overview
9.3.6 TPV Recent Developments
9.4 Lenovo
9.4.1 Lenovo Personal Computer (PC) Monitor Basic Information
9.4.2 Lenovo Personal Computer (PC) Monitor Product Overview
9.4.3 Lenovo Personal Computer (PC) Monitor Product Market Performance
9.4.4 Lenovo Business Overview
9.4.5 Lenovo Recent Developments
9.5 LG
9.5.1 LG Personal Computer (PC) Monitor Basic Information
9.5.2 LG Personal Computer (PC) Monitor Product Overview
9.5.3 LG Personal Computer (PC) Monitor Product Market Performance
9.5.4 LG Business Overview
9.5.5 LG Recent Developments
9.6 Samsung
9.6.1 Samsung Personal Computer (PC) Monitor Basic Information
9.6.2 Samsung Personal Computer (PC) Monitor Product Overview
9.6.3 Samsung Personal Computer (PC) Monitor Product Market Performance
9.6.4 Samsung Business Overview
9.6.5 Samsung Recent Developments
9.7 AOC
9.7.1 AOC Personal Computer (PC) Monitor Basic Information
9.7.2 AOC Personal Computer (PC) Monitor Product Overview
9.7.3 AOC Personal Computer (PC) Monitor Product Market Performance
9.7.4 AOC Business Overview
9.7.5 AOC Recent Developments
9.8 HUIKE ELECTRONICS
9.8.1 HUIKE ELECTRONICS Personal Computer (PC) Monitor Basic Information
9.8.2 HUIKE ELECTRONICS Personal Computer (PC) Monitor Product Overview
9.8.3 HUIKE ELECTRONICS Personal Computer (PC) Monitor Product Market Performance
9.8.4 HUIKE ELECTRONICS Business Overview
9.8.5 HUIKE ELECTRONICS Recent Developments
10 Personal Computer (PC) Monitor Market Forecast by Region
10.1 Global Personal Computer (PC) Monitor Market Size Forecast
10.2 Global Personal Computer (PC) Monitor Market Forecast by Region
10.2.1 North America Market Size Forecast by Country
10.2.2 Europe Personal Computer (PC) Monitor Market Size Forecast by Country
10.2.3 Asia Pacific Personal Computer (PC) Monitor Market Size Forecast by Region
10.2.4 South America Personal Computer (PC) Monitor Market Size Forecast by Country
10.2.5 Middle East and Africa Forecasted Consumption of Personal Computer (PC) Monitor by Country
11 Forecast Market by Type and by Application (2025-2032)
11.1 Global Personal Computer (PC) Monitor Market Forecast by Type (2025-2032)
11.1.1 Global Forecasted Sales of Personal Computer (PC) Monitor by Type (2025-2032)
11.1.2 Global Personal Computer (PC) Monitor Market Size Forecast by Type (2025-2032)
11.1.3 Global Forecasted Price of Personal Computer (PC) Monitor by Type (2025-2032)
11.2 Global Personal Computer (PC) Monitor Market Forecast by Application (2025-2032)
11.2.1 Global Personal Computer (PC) Monitor Sales (K Units) Forecast by Application
11.2.2 Global Personal Computer (PC) Monitor Market Size (M USD) Forecast by Application (2025-2032)
12 Conclusion and Key FindingsList of Tables
Table 1. Introduction of the Type
Table 2. Introduction of the Application
Table 3. Market Size (M USD) Segment Executive Summary
Table 4. Personal Computer (PC) Monitor Market Size Comparison by Region (M USD)
Table 5. Global Personal Computer (PC) Monitor Sales (K Units) by Manufacturers (2019-2025)
Table 6. Global Personal Computer (PC) Monitor Sales Market Share by Manufacturers (2019-2025)
Table 7. Global Personal Computer (PC) Monitor Revenue (M USD) by Manufacturers (2019-2025)
Table 8. Global Personal Computer (PC) Monitor Revenue Share by Manufacturers (2019-2025)
Table 9. Company Type (Tier 1, Tier 2, and Tier 3) & (based on the Revenue in Personal Computer (PC) Monitor as of 2022)
Table 10. Global Market Personal Computer (PC) Monitor Average Price (USD/Unit) of Key Manufacturers (2019-2025)
Table 11. Manufacturers Personal Computer (PC) Monitor Sales Sites and Area Served
Table 12. Manufacturers Personal Computer (PC) Monitor Product Type
Table 13. Global Personal Computer (PC) Monitor Manufacturers Market Concentration Ratio (CR5 and HHI)
Table 14. Mergers & Acquisitions, Expansion Plans
Table 15. Industry Chain Map of Personal Computer (PC) Monitor
Table 16. Market Overview of Key Raw Materials
Table 17. Midstream Market Analysis
Table 18. Downstream Customer Analysis
Table 19. Key Development Trends
Table 20. Driving Factors
Table 21. Personal Computer (PC) Monitor Market Challenges
Table 22. Global Personal Computer (PC) Monitor Sales by Type (K Units)
Table 23. Global Personal Computer (PC) Monitor Market Size by Type (M USD)
Table 24. Global Personal Computer (PC) Monitor Sales (K Units) by Type (2019-2025)
Table 25. Global Personal Computer (PC) Monitor Sales Market Share by Type (2019-2025)
Table 26. Global Personal Computer (PC) Monitor Market Size (M USD) by Type (2019-2025)
Table 27. Global Personal Computer (PC) Monitor Market Size Share by Type (2019-2025)
Table 28. Global Personal Computer (PC) Monitor Price (USD/Unit) by Type (2019-2025)
Table 29. Global Personal Computer (PC) Monitor Sales (K Units) by Application
Table 30. Global Personal Computer (PC) Monitor Market Size by Application
Table 31. Global Personal Computer (PC) Monitor Sales by Application (2019-2025) & (K Units)
Table 32. Global Personal Computer (PC) Monitor Sales Market Share by Application (2019-2025)
Table 33. Global Personal Computer (PC) Monitor Sales by Application (2019-2025) & (M USD)
Table 34. Global Personal Computer (PC) Monitor Market Share by Application (2019-2025)
Table 35. Global Personal Computer (PC) Monitor Sales Growth Rate by Application (2019-2025)
Table 36. Global Personal Computer (PC) Monitor Sales by Region (2019-2025) & (K Units)
Table 37. Global Personal Computer (PC) Monitor Sales Market Share by Region (2019-2025)
Table 38. North America Personal Computer (PC) Monitor Sales by Country (2019-2025) & (K Units)
Table 39. Europe Personal Computer (PC) Monitor Sales by Country (2019-2025) & (K Units)
Table 40. Asia Pacific Personal Computer (PC) Monitor Sales by Region (2019-2025) & (K Units)
Table 41. South America Personal Computer (PC) Monitor Sales by Country (2019-2025) & (K Units)
Table 42. Middle East and Africa Personal Computer (PC) Monitor Sales by Region (2019-2025) & (K Units)
Table 43. Dell Personal Computer (PC) Monitor Basic Information
Table 44. Dell Personal Computer (PC) Monitor Product Overview
Table 45. Dell Personal Computer (PC) Monitor Sales (K Units), Revenue (M USD), Price (USD/Unit) and Gross Margin (2019-2025)
Table 46. Dell Business Overview
Table 47. Dell Personal Computer (PC) Monitor SWOT Analysis
Table 48. Dell Recent Developments
Table 49. HP Personal Computer (PC) Monitor Basic Information
Table 50. HP Personal Computer (PC) Monitor Product Overview
Table 51. HP Personal Computer (PC) Monitor Sales (K Units), Revenue (M USD), Price (USD/Unit) and Gross Margin (2019-2025)
Table 52. HP Business Overview
Table 53. HP Personal Computer (PC) Monitor SWOT Analysis
Table 54. HP Recent Developments
Table 55. TPV Personal Computer (PC) Monitor Basic Information
Table 56. TPV Personal Computer (PC) Monitor Product Overview
Table 57. TPV Personal Computer (PC) Monitor Sales (K Units), Revenue (M USD), Price (USD/Unit) and Gross Margin (2019-2025)
Table 58. TPV Personal Computer (PC) Monitor SWOT Analysis
Table 59. TPV Business Overview
Table 60. TPV Recent Developments
Table 61. Lenovo Personal Computer (PC) Monitor Basic Information
Table 62. Lenovo Personal Computer (PC) Monitor Product Overview
Table 63. Lenovo Personal Computer (PC) Monitor Sales (K Units), Revenue (M USD), Price (USD/Unit) and Gross Margin (2019-2025)
Table 64. Lenovo Business Overview
Table 65. Lenovo Recent Developments
Table 66. LG Personal Computer (PC) Monitor Basic Information
Table 67. LG Personal Computer (PC) Monitor Product Overview
Table 68. LG Personal Computer (PC) Monitor Sales (K Units), Revenue (M USD), Price (USD/Unit) and Gross Margin (2019-2025)
Table 69. LG Business Overview
Table 70. LG Recent Developments
Table 71. Samsung Personal Computer (PC) Monitor Basic Information
Table 72. Samsung Personal Computer (PC) Monitor Product Overview
Table 73. Samsung Personal Computer (PC) Monitor Sales (K Units), Revenue (M USD), Price (USD/Unit) and Gross Margin (2019-2025)
Table 74. Samsung Business Overview
Table 75. Samsung Recent Developments
Table 76. AOC Personal Computer (PC) Monitor Basic Information
Table 77. AOC Personal Computer (PC) Monitor Product Overview
Table 78. AOC Personal Computer (PC) Monitor Sales (K Units), Revenue (M USD), Price (USD/Unit) and Gross Margin (2019-2025)
Table 79. AOC Business Overview
Table 80. AOC Recent Developments
Table 81. HUIKE ELECTRONICS Personal Computer (PC) Monitor Basic Information
Table 82. HUIKE ELECTRONICS Personal Computer (PC) Monitor Product Overview
Table 83. HUIKE ELECTRONICS Personal Computer (PC) Monitor Sales (K Units), Revenue (M USD), Price (USD/Unit) and Gross Margin (2019-2025)
Table 84. HUIKE ELECTRONICS Business Overview
Table 85. HUIKE ELECTRONICS Recent Developments
Table 86. Global Personal Computer (PC) Monitor Sales Forecast by Region (2025-2032) & (K Units)
Table 87. Global Personal Computer (PC) Monitor Market Size Forecast by Region (2025-2032) & (M USD)
Table 88. North America Personal Computer (PC) Monitor Sales Forecast by Country (2025-2032) & (K Units)
Table 89. North America Personal Computer (PC) Monitor Market Size Forecast by Country (2025-2032) & (M USD)
Table 90. Europe Personal Computer (PC) Monitor Sales Forecast by Country (2025-2032) & (K Units)
Table 91. Europe Personal Computer (PC) Monitor Market Size Forecast by Country (2025-2032) & (M USD)
Table 92. Asia Pacific Personal Computer (PC) Monitor Sales Forecast by Region (2025-2032) & (K Units)
Table 93. Asia Pacific Personal Computer (PC) Monitor Market Size Forecast by Region (2025-2032) & (M USD)
Table 94. South America Personal Computer (PC) Monitor Sales Forecast by Country (2025-2032) & (K Units)
Table 95. South America Personal Computer (PC) Monitor Market Size Forecast by Country (2025-2032) & (M USD)
Table 96. Middle East and Africa Personal Computer (PC) Monitor Consumption Forecast by Country (2025-2032) & (Units)
Table 97. Middle East and Africa Personal Computer (PC) Monitor Market Size Forecast by Country (2025-2032) & (M USD)
Table 98. Global Personal Computer (PC) Monitor Sales Forecast by Type (2025-2032) & (K Units)
Table 99. Global Personal Computer (PC) Monitor Market Size Forecast by Type (2025-2032) & (M USD)
Table 100. Global Personal Computer (PC) Monitor Price Forecast by Type (2025-2032) & (USD/Unit)
Table 101. Global Personal Computer (PC) Monitor Sales (K Units) Forecast by Application (2025-2032)
Table 102. Global Personal Computer (PC) Monitor Market Size Forecast by Application (2025-2032) & (M USD)
List of Figures
Figure 1. Product Picture of Personal Computer (PC) Monitor
Figure 2. Data Triangulation
Figure 3. Key Caveats
Figure 4. Global Personal Computer (PC) Monitor Market Size (M USD), 2019-2032
Figure 5. Global Personal Computer (PC) Monitor Market Size (M USD) (2019-2032)
Figure 6. Global Personal Computer (PC) Monitor Sales (K Units) & (2019-2032)
Figure 7. Evaluation Matrix of Segment Market Development Potential (Type)
Figure 8. Evaluation Matrix of Segment Market Development Potential (Application)
Figure 9. Evaluation Matrix of Regional Market Development Potential
Figure 10. Personal Computer (PC) Monitor Market Size by Country (M USD)
Figure 11. Personal Computer (PC) Monitor Sales Share by Manufacturers in 2023
Figure 12. Global Personal Computer (PC) Monitor Revenue Share by Manufacturers in 2023
Figure 13. Personal Computer (PC) Monitor Market Share by Company Type (Tier 1, Tier 2 and Tier 3): 2023
Figure 14. Global Market Personal Computer (PC) Monitor Average Price (USD/Unit) of Key Manufacturers in 2023
Figure 15. The Global 5 and 10 Largest Players: Market Share by Personal Computer (PC) Monitor Revenue in 2023
Figure 16. Evaluation Matrix of Segment Market Development Potential (Type)
Figure 17. Global Personal Computer (PC) Monitor Market Share by Type
Figure 18. Sales Market Share of Personal Computer (PC) Monitor by Type (2019-2025)
Figure 19. Sales Market Share of Personal Computer (PC) Monitor by Type in 2023
Figure 20. Market Size Share of Personal Computer (PC) Monitor by Type (2019-2025)
Figure 21. Market Size Market Share of Personal Computer (PC) Monitor by Type in 2023
Figure 22. Evaluation Matrix of Segment Market Development Potential (Application)
Figure 23. Global Personal Computer (PC) Monitor Market Share by Application
Figure 24. Global Personal Computer (PC) Monitor Sales Market Share by Application (2019-2025)
Figure 25. Global Personal Computer (PC) Monitor Sales Market Share by Application in 2023
Figure 26. Global Personal Computer (PC) Monitor Market Share by Application (2019-2025)
Figure 27. Global Personal Computer (PC) Monitor Market Share by Application in 2023
Figure 28. Global Personal Computer (PC) Monitor Sales Growth Rate by Application (2019-2025)
Figure 29. Global Personal Computer (PC) Monitor Sales Market Share by Region (2019-2025)
Figure 30. North America Personal Computer (PC) Monitor Sales and Growth Rate (2019-2025) & (K Units)
Figure 31. North America Personal Computer (PC) Monitor Sales Market Share by Country in 2023
Figure 32. U.S. Personal Computer (PC) Monitor Sales and Growth Rate (2019-2025) & (K Units)
Figure 33. Canada Personal Computer (PC) Monitor Sales (K Units) and Growth Rate (2019-2025)
Figure 34. Mexico Personal Computer (PC) Monitor Sales (Units) and Growth Rate (2019-2025)
Figure 35. Europe Personal Computer (PC) Monitor Sales and Growth Rate (2019-2025) & (K Units)
Figure 36. Europe Personal Computer (PC) Monitor Sales Market Share by Country in 2023
Figure 37. Germany Personal Computer (PC) Monitor Sales and Growth Rate (2019-2025) & (K Units)
Figure 38. France Personal Computer (PC) Monitor Sales and Growth Rate (2019-2025) & (K Units)
Figure 39. U.K. Personal Computer (PC) Monitor Sales and Growth Rate (2019-2025) & (K Units)
Figure 40. Italy Personal Computer (PC) Monitor Sales and Growth Rate (2019-2025) & (K Units)
Figure 41. Russia Personal Computer (PC) Monitor Sales and Growth Rate (2019-2025) & (K Units)
Figure 42. Asia Pacific Personal Computer (PC) Monitor Sales and Growth Rate (K Units)
Figure 43. Asia Pacific Personal Computer (PC) Monitor Sales Market Share by Region in 2023
Figure 44. China Personal Computer (PC) Monitor Sales and Growth Rate (2019-2025) & (K Units)
Figure 45. Japan Personal Computer (PC) Monitor Sales and Growth Rate (2019-2025) & (K Units)
Figure 46. South Korea Personal Computer (PC) Monitor Sales and Growth Rate (2019-2025) & (K Units)
Figure 47. India Personal Computer (PC) Monitor Sales and Growth Rate (2019-2025) & (K Units)
Figure 48. Southeast Asia Personal Computer (PC) Monitor Sales and Growth Rate (2019-2025) & (K Units)
Figure 49. South America Personal Computer (PC) Monitor Sales and Growth Rate (K Units)
Figure 50. South America Personal Computer (PC) Monitor Sales Market Share by Country in 2023
Figure 51. Brazil Personal Computer (PC) Monitor Sales and Growth Rate (2019-2025) & (K Units)
Figure 52. Argentina Personal Computer (PC) Monitor Sales and Growth Rate (2019-2025) & (K Units)
Figure 53. Columbia Personal Computer (PC) Monitor Sales and Growth Rate (2019-2025) & (K Units)
Figure 54. Middle East and Africa Personal Computer (PC) Monitor Sales and Growth Rate (K Units)
Figure 55. Middle East and Africa Personal Computer (PC) Monitor Sales Market Share by Region in 2023
Figure 56. Saudi Arabia Personal Computer (PC) Monitor Sales and Growth Rate (2019-2025) & (K Units)
Figure 57. UAE Personal Computer (PC) Monitor Sales and Growth Rate (2019-2025) & (K Units)
Figure 58. Egypt Personal Computer (PC) Monitor Sales and Growth Rate (2019-2025) & (K Units)
Figure 59. Nigeria Personal Computer (PC) Monitor Sales and Growth Rate (2019-2025) & (K Units)
Figure 60. South Africa Personal Computer (PC) Monitor Sales and Growth Rate (2019-2025) & (K Units)
Figure 61. Global Personal Computer (PC) Monitor Sales Forecast by Volume (2019-2032) & (K Units)
Figure 62. Global Personal Computer (PC) Monitor Market Size Forecast by Value (2019-2032) & (M USD)
Figure 63. Global Personal Computer (PC) Monitor Sales Market Share Forecast by Type (2025-2032)
Figure 64. Global Personal Computer (PC) Monitor Market Share Forecast by Type (2025-2032)
Figure 65. Global Personal Computer (PC) Monitor Sales Forecast by Application (2025-2032)
Figure 66. Global Personal Computer (PC) Monitor Market Share Forecast by Application (2025-2032)