SEMICONDUCTOR INSIGHT
MARKET RESEARCH REPORT

Global Molded Interconnect Substrate (MIS) Market

2026 to 2034
MARKET INTELLIGENCE
ACROSS KEY REGIONS
2026 EDITION
ELECTRONIC COMPONENTS Semiconductor Market Research

Global Molded Interconnect Substrate (MIS) Market

Size, Trends, Business Strategies 2026-2034

◷
UPDATED 24 September 2026
▤
REPORT LENGTH Detailed Report
▣
REPORT CODE 635c96f0d993
▯
FORMATS PDF

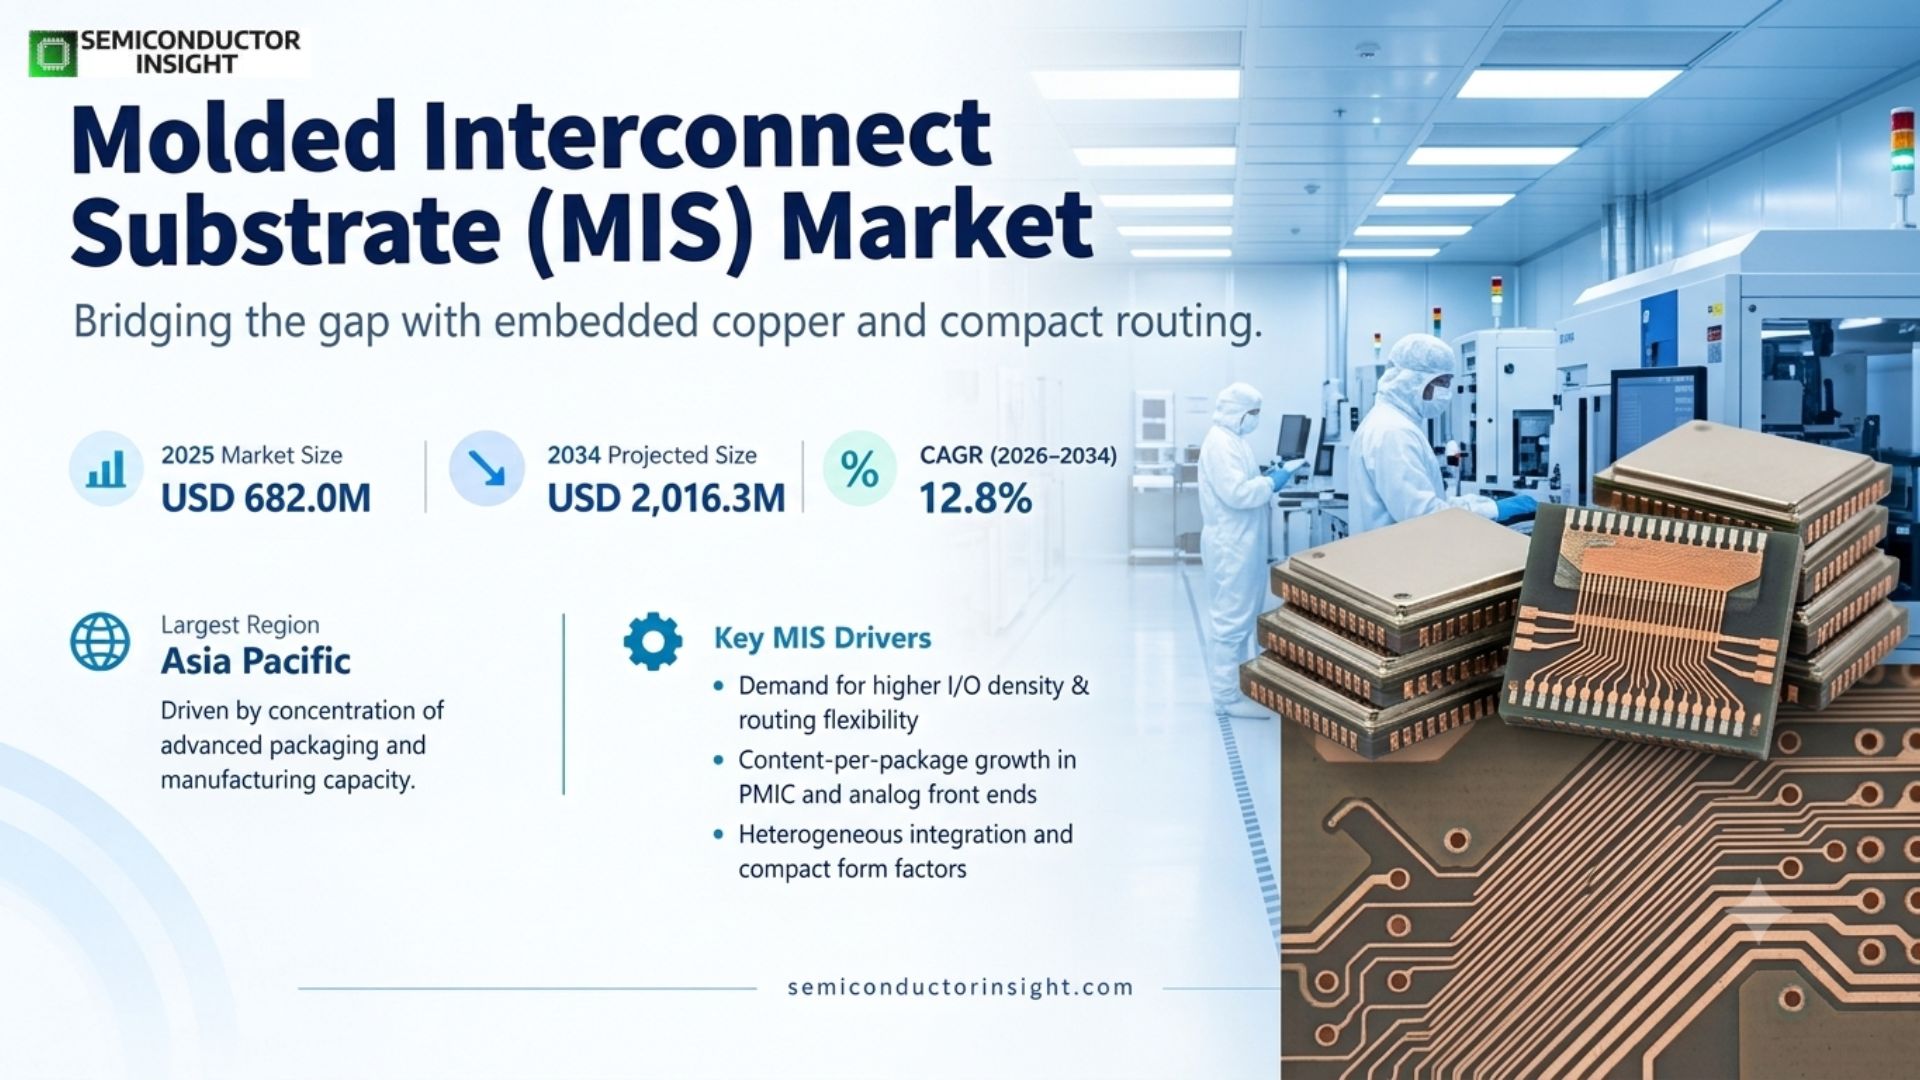
Molded Interconnect Substrate (MIS) market is projected to reach USD 2,016.3 million by 2034, representing a 12.8% CAGR during 2026–2034. Asia Pacific is the largest market, reflecting the geographic concentration of advanced packaging, substrate processing, assembly and electronics manufacturing capacity.

Get the sample PDF with study scope, segmentation and methodology details.

Key Statistics

2025 Market Size
USD 682.0 million
2034 Projected Size
USD 2,016.3 million
CAGR (2026–2034)
12.8%
Largest Market in 2025
Asia Pacific

Key Takeaways

  • Multilayer MIS is positioned for faster value growth because finer routing, more complex redistribution and higher I/O density increase substrate content per package as mobile, power and heterogeneous-integration designs become harder to route on conventional leadframe structures.
  • Power IC and analog packaging provide a durable application base, while the substrate architecture also addresses compact high-frequency and high-I/O packages where copper-filled vias, thermal paths and reduced package thickness influence system performance.
  • Asia Pacific remains the largest market because substrate fabrication, assembly and test capacity is concentrated around Taiwan, China, Malaysia, Singapore, South Korea and Japan; the same region also captures much of the incremental advanced-packaging investment.
  • Advanced packaging investment is the principal growth engine. Global semiconductor sales reached USD 791.7 billion in 2025, while industry capacity and packaging investment are moving toward denser interconnect architectures that expand the addressable need for substrate innovation.
  • Yield and manufacturing complexity are the main restraints. Fine-line copper routing, molding control, via quality and warpage management become progressively more demanding as package dimensions shrink and layer counts rise, raising qualification cost and making scale economics important.

Molded Interconnect Substrate (MIS) Market Overview

Molded Interconnect Substrate (MIS) market is rebased to USD 682.0 million in 2025 and is projected to reach USD 2,016.3 million by 2034, representing a 12.8% CAGR during 2026–2034. Asia Pacific is the largest market, reflecting the geographic concentration of advanced packaging, substrate processing, assembly and electronics manufacturing capacity.

Base year: 2025 · Estimated year: 2026 · Forecast period: 2026–2034 · Historical source anchors retained for deterministic rebasing · Values in USD million unless otherwise stated

Molded Interconnect Substrate combines a pre-molded structure with embedded copper interconnect to bridge the functional space between a conventional leadframe and a more complex organic package substrate. The architecture supports fine line and space, copper-filled vias and pads, compact routing and improved thermal paths. Those attributes are commercially relevant where package designers need more I/O density or routing flexibility without accepting the thickness, cost or process stack associated with larger multilayer substrate formats.

The demand mechanism is therefore tied less to finished-device unit growth alone and more to packaging complexity per semiconductor. A power-management IC, analog front end or compact communication device can create higher substrate value when it moves from a simple interconnect structure to a denser multilayer MIS design. This content-per-package effect explains why MIS can grow faster than broad semiconductor unit shipments when heterogeneous integration, power density and form-factor constraints tighten.

The market is changing as front-end scaling and back-end packaging become increasingly interdependent. Semiconductor Industry Association data show worldwide semiconductor sales reached USD 791.7 billion in 2025, up 25.6% from 2024. At the same time, public and private investment is expanding advanced packaging and substrate capability. For MIS suppliers, this creates a larger qualification funnel but also raises the performance threshold for yield, trace geometry, molding consistency, thermal management and high-volume traceability.

Segment Analysis: By Type

By type, the market is segmented into Single Layer and Multilayer MIS. Single-layer structures retain an important role where routing is modest and cost sensitivity is high, while multilayer designs are the stronger value-growth path because higher I/O counts, finer routing and more complex power and signal distribution increase the need for additional interconnect density.

Type Technical role Market position and purchasing logic
Single Layer A single routing layer minimizes process steps and keeps the architecture closest to the economics of a leadframe while still providing molded-substrate advantages. It is suited to packages where compact form factor and copper routing are needed but signal escape and power distribution remain relatively straightforward. Single-layer MIS competes on cost, yield and reliable high-volume execution. It is attractive for established analog, power and consumer packages where the customer wants a smaller footprint or improved interconnect geometry without paying for routing complexity that the device does not require. Volume stability and qualified manufacturing history matter more than maximum design-rule capability.
Multilayer Multiple routing layers provide more freedom for signal escape, power distribution, ground structure and fine-pitch connections. The architecture can support denser package integration and more difficult electrical or thermal requirements, which makes process control and layer-to-layer alignment increasingly important. Multilayer MIS is the stronger growth opportunity because advanced packaging is increasing I/O density and functional integration. It commands higher value per package but also has a steeper qualification burden. Suppliers that can maintain yield across fine features, copper-filled structures and molding processes are positioned to capture programs where packaging becomes a performance-enabling element rather than a commodity enclosure.

Value progression by routing complexity

MIS pricing is shaped by layer count, line/space requirements, substrate dimensions, copper thickness, via density, molding tolerances and the qualification regime of the target device. The commercial transition from single-layer to multilayer therefore does not simply add one manufacturing step; it changes inspection intensity, yield sensitivity and engineering content. Suppliers increasingly compete on the ability to support design-for-manufacturability early in package development, because routing choices made before qualification have direct consequences for scrap, cycle time and long-run package cost.

Segment Analysis: By Application

By application, the report scope covers Analog Chip, Power IC, Digital Currency and Others. Analog and power devices provide a broad industrial and consumer base, while specialized compact electronics can create higher-value opportunities where package thickness, thermal dissipation and high-density routing are central design constraints.

Application Demand characteristics and commercial implication
Analog Chip Analog devices span power management, sensing, connectivity and signal conditioning, creating a large diversity of package footprints and qualification needs. MIS is relevant when designers require compact routing, short electrical paths or a package format that can accommodate increasing pin count without migrating directly to a larger substrate. Purchasing decisions are dominated by electrical performance, long-term reliability, package cost and the supplier’s ability to sustain identical process control over long product lifecycles.
Power IC Power IC packaging places strong emphasis on current carrying capability, thermal extraction and reliability under repeated temperature cycling. Copper-rich MIS structures can address these requirements while enabling smaller footprints and more flexible routing. The commercial opportunity rises as power density increases in automotive, industrial, computing and consumer systems, but qualification is demanding because package failures can carry high system-level cost and customers expect stable process capability over extended production runs.
Digital Currency Digital-currency hardware represents a narrower and more cyclical application pool than mainstream analog or power electronics, but it can require compact, thermally capable packaging around high-throughput electronics. MIS demand in this segment is therefore opportunity-led rather than a stable base-load market. Suppliers must be cautious about capacity allocation because demand can move rapidly with hardware generations, economics and regulation, making flexible production and disciplined customer qualification more valuable than dedicated speculative capacity.
Others Other applications include compact communication, wearable, industrial and specialized electronics where fine routing, package miniaturization or thermal behavior justify MIS adoption. This category is commercially important because new programs often begin as low-volume engineering qualifications before scaling. Suppliers that offer rapid prototyping, design support and transferable high-volume processes can convert these fragmented opportunities into longer production runs without depending on a single end-market cycle.

Molded Interconnect Substrate (MIS) Market Share

Regional Analysis

Asia Pacific leads the Molded Interconnect Substrate market because it combines substrate manufacturing, outsourced semiconductor assembly and test, foundry output and electronics-system production in one dense supply network. North America is strategically important through design demand and public advanced-packaging investment, while Europe is driven by automotive and industrial electronics qualification. South America and Middle East & Africa remain primarily downstream, import-oriented markets.

How does regional demand differ across the Molded Interconnect Substrate market?

Regional demand should be read through the location of package design, qualification and production rather than final electronics consumption alone. In 2025, SIA reported semiconductor sales growth of 45.0% for Asia Pacific and all other regions, 30.5% in the Americas, 17.3% in China and 6.3% in Europe. These figures are broader semiconductor indicators rather than MIS market shares, but they show where the semiconductor demand environment is expanding and where packaging suppliers face the strongest program flow.

Region Market position Growth outlook Demand profile Key evidence / access factor
Asia Pacific Largest Highest structural opportunity Manufacturing and packaging led Taiwan, China, Malaysia and Singapore concentrate assembly, substrate and electronics supply chains; ASE is adding advanced packaging capacity in Kaohsiung.
North America Strategic demand hub Strong investment-led growth Design, AI/HPC and policy led U.S. CHIPS advanced-packaging awards total USD 1.4 billion, including USD 300 million for advanced substrates and materials research.
Europe High-value specialized market Moderate Automotive and industrial qualification led European semiconductor sales rose 6.3% in 2025; customers emphasize automotive reliability, industrial longevity and traceability.
South America Smaller import market Selective Downstream electronics led Demand is linked to imported semiconductors and regional automotive/industrial electronics rather than local substrate manufacturing.
Middle East & Africa Early-stage Project dependent Imported electronics and new technology investment Local advanced-packaging capacity is limited; commercial entry relies on global supply networks and customer-specific programs.
Asia Pacific LARGEST & FASTEST-GROWING

Why does Asia Pacific lead the MIS market?

Asia Pacific leads because the region contains the highest concentration of OSAT, substrate, foundry and electronics manufacturing capacity. MIS qualification benefits from proximity between package engineering and volume assembly, and that ecosystem is strongest across Taiwan, China, Malaysia, Singapore, South Korea and Japan. The region therefore captures both new-design activity and the manufacturing scale needed to convert qualification wins into high-volume substrate shipments.

Market positionLargest region
2025 semiconductor signalAPAC/All Others sales +45.0%
Demand profilePackaging and manufacturing led
Access gateYield, qualification and local OSAT relationships
Country / hub Position Evidence and demand mechanism
Taiwan Advanced-packaging hub Taiwan combines foundry, OSAT and substrate ecosystems. ASE announced an NT$17.8 billion Kaohsiung expansion in March 2026, scheduled for completion in the second quarter of 2028, and separately announced a 310 mm × 310 mm automated panel-level packaging line targeted for production in the first half of 2027. These investments signal continued back-end density and scale requirements that support substrate innovation.
China Large electronics base China remains a major semiconductor and electronics demand center. SIA reported Chinese semiconductor sales increased 17.3% in 2025. For MIS suppliers, the important implication is the breadth of analog, power, connectivity and consumer-device programs combined with domestic packaging capacity, creating a large qualification pool while also intensifying local price competition and the need for responsive technical support.
Malaysia & Singapore Assembly and test cluster Malaysia and Singapore are established back-end semiconductor locations with multinational assembly, test and packaging operations. Their role in MIS is less about final-device consumption than process transfer, qualification and manufacturing continuity. Suppliers with regional logistics, consistent material quality and rapid engineering response can benefit as customers diversify packaging footprints and seek redundancy across Asian manufacturing locations.

Market instances and commercial signals

ASE’s March 2026 Kaohsiung expansion commits NT$17.8 billion to two new buildings expected to be completed in Q2 2028 and to create 1,470 jobs. The direct market implication is additional high-end packaging capacity and a larger regional engineering base, which increases the number of programs evaluating finer-pitch and more integrated substrate architectures.

ASE’s May 2026 announcement of a 310 mm × 310 mm automated panel-level packaging line, with production planned for the first half of 2027, shows the industry moving toward larger-format and higher-throughput packaging. MIS is not identical to panel-level fan-out, but both trends increase competitive pressure on substrate solutions to deliver density, manufacturability and lower cost per packaged function.

SIA reported Asia Pacific and all other regions recorded 45.0% semiconductor sales growth in 2025. This is not an MIS share statistic, but it is a strong demand-side indicator because substrate consumption ultimately follows semiconductor package output, particularly when growth is concentrated in logic, power, connectivity and high-performance devices.

Country-level revenue, shipment, supplier and application detail for Asia Pacific is covered in the full Molded Interconnect Substrate (MIS) report.
North America INVESTMENT-LED

What shapes MIS demand in North America?

North America is a design- and investment-led market. The region has substantial semiconductor architecture, AI, high-performance computing, automotive and industrial design activity, while U.S. policy is explicitly funding advanced packaging and substrate research. MIS suppliers therefore compete less on local commodity volume and more on early design engagement, intellectual-property protection, qualification discipline and the ability to support programs that may later scale through Asian or domestic packaging facilities.

Market positionStrategic high-value region
CHIPS packaging awardsUSD 1.4 billion finalized
Substrate/material R&DUSD 300 million awards
Demand profileDesign and qualification led
Country Position Evidence and demand mechanism
United States Design and policy center The U.S. Department of Commerce finalized USD 1.4 billion of CHIPS National Advanced Packaging Manufacturing Program awards in January 2025. Within that total, USD 300 million was designated for advanced substrates and materials research involving Absolics, Applied Materials and Arizona State University. The funding strengthens local development infrastructure and creates more opportunities for substrate technologies to be evaluated against demanding performance and manufacturability targets.
Canada Specialized design market Canada contributes semiconductor design, communications, aerospace and research activity but has a smaller back-end manufacturing footprint. MIS opportunity is therefore tied to specific device programs rather than broad local substrate volume. Suppliers typically access this demand through North American design relationships and global OSAT partners, making engineering support and reliable cross-border qualification more important than local production scale.

Market instances and commercial signals

The January 2025 NIST announcement of USD 1.4 billion in final advanced-packaging awards is a concrete signal that the United States is treating back-end technology as a strategic manufacturing capability rather than an outsourced afterthought. This expands the research and pilot ecosystem in which MIS can compete for programs requiring fine interconnect, thermal management and compact package dimensions.

USD 300 million of the NAPMP awards were specifically allocated to advanced substrates and materials research. That focus matters commercially because substrate choice is increasingly connected to package performance, and it increases the value of suppliers that can provide characterization data, design collaboration and scalable manufacturing routes rather than only a finished substrate specification.

SIA reported Americas semiconductor sales rose 30.5% in 2025. The figure covers the broader semiconductor market, not MIS specifically, but it supports a strong design and demand environment for packaging technologies serving AI, networking, automotive and industrial devices.

Country-level revenue, shipment, supplier and application detail for North America is covered in the full Molded Interconnect Substrate (MIS) report.
Europe AUTOMOTIVE & INDUSTRIAL

What drives MIS adoption in Europe?

Europe’s MIS opportunity is shaped by automotive, industrial, power-management and communications electronics, where reliability and product-lifecycle requirements are demanding. The region has less high-volume substrate manufacturing than Asia Pacific, so demand often originates with European chip or system designers and is fulfilled through global packaging partners. Suppliers win by demonstrating process stability, traceability and the ability to hold package performance over long qualification and production cycles.

Market positionHigh-value specialized
2025 semiconductor signalEurope sales +6.3%
Demand profileAutomotive/industrial led
Access gateQualification, traceability, lifecycle support
Country Position Evidence and demand mechanism
Germany Automotive and industrial anchor Germany’s semiconductor demand is closely linked to automotive electronics, factory automation and power conversion. These applications reward compact, thermally capable and highly reliable packaging, but qualification cycles are long. MIS suppliers need robust process-control documentation and supply assurance because a substrate change inside an automotive or industrial package can trigger system-level revalidation and significant customer risk.
France Design and industrial electronics hub France contributes semiconductor design, aerospace, industrial and communications demand. MIS programs are likely to be selected where package integration can improve form factor or electrical behavior without creating unacceptable qualification complexity. Commercial success depends on collaboration with European device makers and OSAT partners rather than a purely distributor-led sales model.
Italy & Central Europe Industrial electronics base Industrial controls, power electronics and automotive supply chains across Italy and Central Europe provide a broad downstream base. Volumes can be fragmented by application, which favors suppliers capable of managing multiple qualified variants while preserving common process platforms and disciplined change control.

Market instances and commercial signals

SIA recorded 6.3% semiconductor sales growth in Europe during 2025. Although this broader figure does not quantify MIS directly, it indicates a growing semiconductor demand pool in a region where automotive, industrial and power-device packaging frequently places high value on reliability, thermal performance and long product lifecycles.

European package qualifications often emphasize production change control, traceability and long-term availability. This gives established substrate suppliers an advantage when they can document process capability across multiple production lots and support customers through automotive or industrial requalification requirements.

The region’s packaging opportunity is increasingly connected to power electronics and electrification. As current density and thermal loads rise, package architecture becomes part of device performance, supporting evaluation of copper-rich and compact interconnect structures where MIS can offer a differentiated balance of routing and form factor.

Country-level revenue, shipment, supplier and application detail for Europe is covered in the full Molded Interconnect Substrate (MIS) report.
South America IMPORT-LED

How does South America participate in the MIS market?

South America is principally a downstream electronics and automotive demand market rather than a center of MIS fabrication. Substrates are normally embedded in imported semiconductor packages, so regional demand is transmitted through global device suppliers and packaging networks. Brazil provides the largest industrial and automotive base, while Argentina and other markets create smaller program-specific demand. Commercial exposure therefore depends more on global customer wins than on building a local substrate sales channel.

Market positionSmaller downstream market
Demand profileImport led
Primary demand baseAutomotive and industrial electronics
Access gateGlobal customer and distributor channels
Country Position Evidence and demand mechanism
Brazil Largest regional electronics/automotive base Brazil is the most relevant South American demand center because of its automotive, industrial and consumer-electronics activity. MIS demand generally arrives inside packaged semiconductors rather than as locally purchased substrate material. Suppliers therefore benefit when their global analog and power IC customers win Brazilian vehicle, industrial-control or electronics programs, making worldwide qualification status more important than direct regional marketing.
Argentina Smaller application market Argentina represents a smaller electronics and vehicle-production base with greater sensitivity to import conditions and macroeconomic cycles. The market can support specialized industrial and automotive device demand, but it is unlikely to justify dedicated MIS capacity. Suppliers should treat it as part of global account coverage and focus on continuity of supply through customers’ existing package channels.

Market instances and commercial signals

South American MIS exposure is structurally tied to imported semiconductor content. This means changes in vehicle production, industrial investment and electronics imports affect package demand, but they do not translate into a local substrate-manufacturing cycle. The commercial route remains through device makers and OSATs whose packages are qualified globally.

Brazil’s scale makes it the region’s most important downstream market for analog and power electronics. A supplier that has already qualified MIS with global automotive or industrial semiconductor customers can participate in Brazilian demand without establishing separate local substrate processing, reducing market-entry cost but increasing dependence on a small set of global accounts.

Regional currency and import volatility can shift procurement timing even when end-demand is stable. For MIS suppliers, this reinforces the importance of diversified customer exposure and avoiding dedicated capacity commitments based solely on South American demand forecasts.

Country-level revenue, shipment, supplier and application detail for South America is covered in the full Molded Interconnect Substrate (MIS) report.
Middle East & Africa EMERGING

Where are MIS opportunities emerging in Middle East & Africa?

Middle East & Africa is an emerging end-market for MIS-containing semiconductor packages rather than a mature substrate manufacturing region. Opportunities are linked to data infrastructure, industrial automation, energy systems, telecommunications and selective semiconductor investment. The market is project-driven, and substrate suppliers typically participate indirectly through global chipmakers, electronics OEMs and packaging partners rather than selling MIS as a standalone material into local channels.

Market positionEarly-stage
Demand profileProject and infrastructure led
Supply structureHighly import dependent
Access gateGlobal OEM/package qualifications
Country / hub Position Evidence and demand mechanism
Gulf states Technology investment hubs Saudi Arabia and the United Arab Emirates are investing in digital infrastructure, data centers and advanced technology ecosystems. This creates growing downstream demand for semiconductors and high-performance electronics, but local MIS manufacturing remains limited. Suppliers participate primarily when globally qualified packages are incorporated into regional systems, making indirect exposure through major semiconductor and equipment customers the practical route to market.
South Africa Industrial electronics market South Africa has a diversified industrial, automotive and telecommunications base that consumes analog and power semiconductor packages. The scale is smaller than Asia, North America or Europe, and substrate sourcing is embedded upstream. Supplier opportunity is therefore linked to global device portfolios and reliable distribution rather than local package-substrate production.

Market instances and commercial signals

The region’s semiconductor demand is increasingly associated with data infrastructure, telecom modernization and energy-system electronics. These applications can use advanced packages, but the local value capture sits mainly in systems integration and end equipment rather than substrate fabrication, so MIS suppliers need global account strategies instead of region-specific factory investment.

High import dependence makes supply continuity and logistics more important than local substrate customization. A qualified MIS design used by a global power, analog or communications semiconductor vendor can serve Middle Eastern and African projects through standard device channels, lowering direct commercial complexity but making the supplier dependent on upstream customer design wins.

New technology investment can create high-specification pockets of demand even where semiconductor manufacturing is limited. For MIS suppliers, the opportunity is best viewed as incremental pull-through from AI infrastructure, communications, industrial control and power electronics rather than a stand-alone regional substrate market.

Country-level revenue, shipment, supplier and application detail for Middle East & Africa is covered in the full Molded Interconnect Substrate (MIS) report.

Key Molded Interconnect Substrate (MIS) Manufacturers and Competitive Landscape

Competition in MIS is based on qualified process capability rather than substrate design alone. The supplier must combine fine copper features, molding control, via integrity, surface finish, warpage management and scalable inspection, then prove that this process can hold yield over production volumes. The result is a market where engineering support and customer qualification create meaningful switching costs even when nominal substrate specifications appear similar.

The profiled supplier group includes dedicated substrate and packaging-material businesses as well as semiconductor assembly and test companies with integrated packaging capabilities. This structure matters because an OSAT can influence substrate selection through package co-design and internal manufacturing economics, while a specialist substrate supplier can compete through process depth, neutrality across assembly partners and faster design iteration. Customers often evaluate both technology performance and the resilience of the manufacturing route.

Price competition is strongest in mature single-layer products. In multilayer and fine-feature designs, yield and qualification cost can outweigh nominal substrate price because a package failure or process excursion can disrupt an entire semiconductor program. Suppliers that demonstrate stable electrical performance, controlled warpage and predictable lot-to-lot geometry can therefore defend margin by reducing the customer’s total qualification and production risk.

Capacity strategy is becoming more important as advanced packaging investment accelerates. MIS suppliers must decide whether to add equipment ahead of demand, share capacity across package families or work closely with anchor customers. The strongest position is created by flexible lines that can support engineering builds and then scale to production without a disruptive process transfer, because package customers increasingly value time-to-volume alongside unit cost.

Tier structure

Competitive tier Representative companies How they compete
Integrated packaging leaders ASE Material, JCET Group, Unisem These companies can connect substrate decisions directly with assembly and test execution. Their advantage is package-level integration, large customer relationships and the ability to optimize material, interconnect and assembly together. The trade-off for customers is that the substrate may be embedded within a broader packaging service rather than sourced as a fully independent component.
Specialist MIS/material suppliers ASM Advanced Packaging Materials, Advanpack Specialists compete through proprietary process capability, fine-feature routing, engineering responsiveness and the ability to serve multiple packaging partners. Their commercial leverage rises where customers want substrate innovation without being locked into one assembly provider, but they must prove scale, quality systems and supply continuity against larger integrated competitors.
Assembly-focused competitors Carsem and other qualified OSAT networks Assembly specialists influence substrate adoption through package qualification and customer program ownership. Even when they do not manufacture every substrate internally, their process windows and approved-material lists shape which MIS suppliers can access volume production. Winning these relationships can create durable demand because semiconductor customers resist changing package materials after qualification.

Key companies profiled

ASM Advanced Packaging Materials, Unisem, Advanpack, ASE Material, Carsem, JCET Group.

Molded Interconnect Substrate (MIS) Production Capacity Analysis

MIS capacity is concentrated in Asia Pacific and is constrained by more than nominal square-meter output. The commercially usable capacity is the subset of lines capable of meeting a customer’s exact line/space, via, molding, warpage, surface-finish and reliability requirements at acceptable yield. As designs become denser, engineering capacity, inspection capability and process-control maturity can become tighter constraints than equipment count.

Capacity expansion must therefore be evaluated on qualified output rather than installed tools. A new molding or copper-processing line does not contribute meaningful market supply until it has passed customer qualification and demonstrated stable yield. For multilayer MIS, process interactions compound: tighter routing can reduce defect tolerance, additional layers increase alignment requirements, and thinner structures can raise warpage sensitivity. This makes ramp execution a central competitive capability.

Asia Pacific’s advantage is ecosystem density. Foundries, OSATs, substrate and chemical suppliers, equipment service organizations and electronics customers are geographically close, shortening engineering cycles and making failure analysis faster. ASE’s current advanced-packaging investments in Taiwan illustrate the scale of continued back-end capital deployment. Even where those lines are not MIS-specific, they increase regional demand for skilled packaging engineers, inspection technology and higher-density interconnect solutions.

North American public investment is aimed at reducing strategic packaging gaps. The NAPMP awards for advanced substrates and materials expand U.S. development capacity, but a research or pilot line does not immediately displace Asia’s manufacturing scale. The medium-term effect is more likely to be dual-region qualification, technology transfer and increased pressure on suppliers to document supply-chain resilience and manufacturing portability.

Capacity factor Why it matters Commercial consequence
Fine-line / via process window MIS value rises with tighter routing and more complex copper structures, but defects that are tolerable on coarse designs can become yield-limiting as geometry tightens. Suppliers with stable high-density process capability can prioritize premium programs and shorten customer qualification, while weaker lines face rework, scrap and slower ramp.
Molding and warpage control Package flatness and dimensional stability affect downstream assembly, solder joint reliability and electrical performance. Thinner or larger structures narrow the process window. Capacity that cannot hold warpage specifications is not fungible with qualified capacity; this limits the benefit of simple tool additions.
Inspection and metrology Fine features require stronger in-line inspection, traceability and defect classification so excursions are found before expensive downstream assembly. Metrology throughput can become a bottleneck and is an important element of capital planning for high-value MIS programs.

Molded Interconnect Substrate (MIS) Market Dynamics: Drivers, Restraints and Opportunities

MIS market growth is driven by a structural increase in packaging density rather than a single end-market cycle. Miniaturization, higher I/O count, power density and heterogeneous integration support adoption, while yield sensitivity, qualification cost and competition from alternative packaging architectures restrain conversion. The strongest opportunities sit where MIS solves a measurable routing, thickness or thermal problem and can be manufactured at scale with stable yield.

MARKET DRIVERS

Drivers Impact Analysis*

Factor Direction / Intensity* Commercial transmission mechanism
Advanced packaging and heterogeneous integration High More complex packages require denser redistribution, shorter interconnect and better thermal paths, increasing the value of substrate technology.
Device miniaturization and higher I/O density High Smaller package footprints force more routing into less area and improve the economic case for embedded copper and multilayer MIS.
Power density and thermal-management requirements Medium–High Power and analog devices need current capacity and thermal extraction; copper-rich substrate structures can improve package-level performance.
Semiconductor volume and electronics content growth Medium Higher semiconductor output expands the base of packages that can migrate to MIS, though conversion depends on application-specific cost and qualification.

Advanced packaging turns interconnect into a performance variable

As front-end scaling becomes more expensive, system performance increasingly depends on how chiplets, memory, power delivery and I/O are connected inside the package. That shifts attention from the package as a protective enclosure to the package as an electrical and thermal system. MIS benefits when its fine routing, copper structures and compact form factor allow a customer to solve integration constraints without moving to a substantially more expensive substrate platform.

Miniaturization increases substrate content per package

Smartphones, wearables, communication modules and compact industrial devices continue to compress board area while adding functionality. When pin count or routing difficulty rises faster than package dimensions, simple leadframe solutions can become limiting. MIS provides additional routing freedom, which means a design migration can increase substrate value even if end-device unit volumes remain unchanged. This content effect is a key reason the market can outgrow broad unit shipments.

Power and analog electronics reward thermal and electrical efficiency

Electrification, power management and high-current electronics increase the importance of copper cross-section, parasitic control and heat flow. MIS can be selected where embedded copper traces and filled structures improve package performance or enable a smaller footprint. The commercial effect is strongest in applications where the package is part of the thermal or electrical design rather than a neutral carrier.

Packaging investment expands the qualification funnel

Public and private capital is expanding advanced packaging capacity and research infrastructure. The U.S. NAPMP awards and ASE’s Taiwan investments are two visible examples. New lines create more engineering programs, and each program creates an opportunity to benchmark substrate options. This does not guarantee MIS adoption, but it increases the number of designs in which suppliers can demonstrate a cost, density or reliability advantage.

MARKET RESTRAINTS

Restraints Impact Analysis*

Factor Direction / Intensity* Commercial transmission mechanism
Yield loss on fine features High Defects in copper routing, vias or molding raise scrap and can erase the economic benefit of a denser substrate design.
Qualification time and switching cost Medium–High Customers are reluctant to change a qualified package stack because revalidation can be expensive and can delay device launches.
Alternative advanced-packaging architectures Medium Fan-out, laminate substrates, leadframes and other structures compete for the same package-design problem, limiting universal adoption.
Capital and metrology intensity Medium High-density process and inspection capability require investment before revenue is secured, increasing utilization risk.

Yield economics tighten as routing density rises

The same fine features that create MIS value also increase sensitivity to contamination, plating defects, alignment error and dimensional variation. A nominally superior design is not commercially attractive if production yield is unstable. Customers therefore qualify the entire process window, and suppliers may need extended learning cycles before reaching target cost. This restrains rapid capacity entry and favors manufacturers with established process-control data.

Package qualification creates long but selective sales cycles

Semiconductor customers validate mechanical reliability, thermal behavior, electrical performance and assembly compatibility before moving a substrate into production. These tests can take months and are especially demanding in automotive and industrial applications. Once qualified, the position can be durable, but the upfront engineering effort makes the sales funnel slower than headline market growth and can strand development resources when a device program is canceled.

MIS competes with multiple interconnect architectures

Designers can choose refined leadframes, organic laminate substrates, fan-out structures or other advanced packaging approaches depending on I/O density, die size, thermal load and cost. MIS is therefore not a universal migration path. It must demonstrate a clear package-level advantage for each design, and rapid progress in competing technologies can shift the economic boundary between formats over the forecast period.

MARKET OPPORTUNITIES

High-density analog and power packages

Suppliers can target analog and power devices that need compact routing, thermal performance and long production lives. These customers value stable process control and often maintain a package for many years once qualified, supporting recurring revenue. The opportunity is strongest for suppliers that can combine electrical and thermal design assistance with automotive or industrial quality systems and high-volume manufacturing discipline.

Panel-level and heterogeneous-integration learning

The industry’s move toward larger packaging formats and heterogeneous integration creates transferable expertise in fine redistribution, molding and automated inspection. MIS suppliers that invest in compatible metrology and process automation can improve yield and respond to customer expectations shaped by broader advanced-packaging platforms. The commercial benefit is not that MIS becomes panel packaging, but that manufacturing capability improves across adjacent technology families.

Regional supply-chain diversification

Customers are seeking more resilient packaging networks and may qualify second sources or additional geographic footprints. MIS suppliers with portable process recipes, traceable materials and partnerships across multiple OSAT locations can capture this demand. The opportunity favors standardized production control that allows a design to move between qualified sites without changing electrical or mechanical behavior.

Rapid prototyping for emerging devices

New wearables, sensors, compact communication modules and specialized compute devices often begin with modest volumes but challenging form-factor requirements. A supplier that can provide quick design-rule feedback and engineering lots can enter early, when substrate architecture is still flexible. Converting even a small fraction of those programs into production can create attractive growth without competing only on mature, price-sensitive packages.

Molded Interconnect Substrate (MIS) Supply Chain Analysis

Stage 1
Materials & chemicals
Copper, molding compounds, surface finishes and process chemicals determine conductivity, adhesion, dimensional stability and reliability.
Stage 2
MIS substrate fabrication
Patterning, copper formation, molding, via and pad creation, layer build-up and inspection convert materials into qualified interconnect structures.
Stage 3
Assembly & test
OSATs attach die, form interconnects, encapsulate and test packages; their process windows strongly influence substrate qualification.
Stage 4
Device & system demand
Analog, power, communication and specialized electronics customers create demand through package architecture and reliability requirements.

Value capture is greatest where a supplier owns a difficult process step or a customer qualification that is costly to replicate. Raw materials can be critical, but the MIS supplier’s defensibility usually comes from integrating those materials into a stable fine-feature process. Process recipes, tooling, in-line inspection and defect learning are therefore commercial assets because they determine the yield at which a quoted design can actually be produced.

The interface with OSATs is particularly important. Assembly conditions, package thickness, die attach, thermal cycles and downstream warpage limits all affect substrate requirements. A substrate supplier that engages only after the package design is frozen may be forced into a narrow process window. Early co-design allows routing and manufacturing constraints to be balanced before qualification, reducing iteration and improving the probability that a prototype can transfer directly into volume production.

Supply-chain risk is concentrated in specialized materials, qualified manufacturing sites and engineering knowledge rather than a single generic raw material. Customers increasingly ask for second-source plans and geographic redundancy, but duplicating a qualified MIS process is not trivial. The most resilient suppliers document process control at a level that enables site transfer while maintaining identical critical dimensions, surface properties and reliability performance.

Recent Developments in the Molded Interconnect Substrate (MIS) Market

26 May 2026
ASE announced an automated 310 mm × 310 mm panel-level packaging production line

ASE said the new line is expected to enter production in the first half of 2027 and is designed to support next-generation compute workloads and heterogeneous integration. For the MIS market, the development is important because it demonstrates continued investment in higher-throughput, higher-density back-end manufacturing and raises customer expectations for automation, design-rule control and package-level cost reduction across competing substrate technologies.

11 March 2026
ASE broke ground on two new Kaohsiung advanced-packaging buildings

ASE disclosed a total investment of NT$17.8 billion, completion targeted for the second quarter of 2028 and 1,470 expected jobs. The expansion strengthens Taiwan’s packaging ecosystem and supports AI, high-performance computing and high-speed communication applications, increasing the regional engineering and capacity base in which advanced substrate technologies are qualified and produced.

16 January 2025
U.S. Commerce finalized USD 1.4 billion of advanced-packaging awards

The CHIPS National Advanced Packaging Manufacturing Program awards include USD 300 million for advanced substrates and materials research. The funding expands U.S. development and pilot capability and is directly relevant to MIS because substrate materials and interconnect structures are becoming strategic elements of package performance, domestic manufacturing resilience and technology transfer.

REPORT SCOPE & SEGMENTATION

Attribute Coverage
Market Molded Interconnect Substrate (MIS)
Base year / forecast 2025 base; 2026 estimate; 2034 forecast; 12.8% CAGR for 2026–2034
By Type Single Layer, Multilayer
By Application Analog Chip, Power IC, Digital Currency, Others
Regions North America, Europe, Asia Pacific, South America, Middle East & Africa
Companies profiled ASM Advanced Packaging Materials, Unisem, Advanpack, ASE Material, Carsem, JCET Group

Frequently Asked Questions

What is the current size of the Molded Interconnect Substrate (MIS) market?

The Molded Interconnect Substrate market is rebased to USD 682.0 million in 2025. Using the annual growth factor implied by the report page’s published 2023 and 2032 market-size anchors, the market reaches USD 2,016.3 million in 2034, corresponding to a 12.8% CAGR during 2026–2034. The growth reflects rising package routing density, continued advanced-packaging investment and increasing use of compact copper-rich interconnect structures in analog, power and other semiconductor applications.

Which region leads the MIS market?

Asia Pacific leads the MIS market because it contains the most concentrated ecosystem of substrate processing, outsourced semiconductor assembly and test, foundry manufacturing and electronics production. Taiwan, China, Malaysia and Singapore are particularly important to packaging execution. The region also captures a large share of current advanced-packaging investment, giving suppliers faster access to engineering programs, qualification infrastructure and the manufacturing scale required to ramp a new substrate design from prototype to volume.

What are the main MIS product types?

The report segments MIS by type into Single Layer and Multilayer. Single-layer structures target packages where cost, compact form factor and straightforward routing dominate the design decision. Multilayer MIS supports more complex signal escape, power distribution and higher I/O density. As package complexity rises, multilayer designs can capture more value per unit, but they also require tighter alignment, stronger inspection, better warpage control and more demanding customer qualification before high-volume production.

Which applications are covered in the MIS market?

The report scope includes Analog Chip, Power IC, Digital Currency and Others. Analog and power devices provide broad demand because they appear across automotive, industrial, communications and consumer systems. Other compact electronic applications can adopt MIS when routing density, package thickness or thermal behavior becomes difficult to achieve with simpler interconnect structures. Digital-currency hardware is more cyclical and therefore requires disciplined capacity planning even when individual device designs need high-performance packaging.

Why is MIS growing faster than broad semiconductor unit demand?

MIS growth is influenced by semiconductor output, but the stronger mechanism is rising substrate content per package. When an IC moves from a simple interconnect format to a finer or multilayer MIS architecture, substrate value can increase without a corresponding increase in device units. Higher I/O count, smaller footprints, power density and heterogeneous integration all push package complexity upward, creating a content effect that can allow MIS revenue to grow faster than general semiconductor shipments during technology transitions.

What constrains MIS market growth?

The principal constraints are manufacturing yield, qualification time, process complexity and competition from alternative packaging formats. Fine copper features, vias and thin molded structures have narrower process windows, so yield loss can quickly offset the economic advantage of a denser design. Customers also resist changing a qualified package stack because revalidation is costly. MIS must therefore prove a clear package-level advantage against advanced leadframes, laminate substrates, fan-out and other interconnect approaches.

Which companies are profiled in the MIS report?

The report profiles ASM Advanced Packaging Materials, Unisem, Advanpack, ASE Material, Carsem and JCET Group. These companies represent a mix of substrate, packaging-material and assembly capabilities. Competitive strength depends on more than nominal line/space specifications: customers evaluate engineering support, manufacturing yield, qualification history, traceability, scale, geographic resilience and the ability to move a package from development lots to stable high-volume production without a disruptive process transfer.

How does advanced-packaging investment affect MIS demand?

Advanced-packaging investment expands the number of package programs evaluating denser interconnect structures and improves the ecosystem of equipment, metrology and engineering talent. U.S. CHIPS awards include USD 300 million for advanced substrates and materials research, while ASE is expanding packaging capacity in Taiwan. These investments do not automatically convert into MIS revenue, but they enlarge the qualification funnel and raise the value of substrate technologies that deliver measurable density, thermal, reliability or manufacturing advantages.

What is the role of multilayer MIS in future growth?

Multilayer MIS is important because semiconductor packages are carrying more functions and more I/O through limited package area. Additional routing layers help designers manage signal escape, ground and power distribution, but they also increase alignment and yield sensitivity. Suppliers able to manufacture multilayer structures with stable critical dimensions and acceptable cost can capture a larger share of advanced analog, power and specialized packaging programs, making process maturity as important as the nominal number of layers offered.

What is the 2026 market estimate for MIS?

The rebased series places the Molded Interconnect Substrate market at USD 769.3 million in 2026. This figure sits between the USD 682.0 million 2025 base and the USD 2,016.3 million 2034 forecast on the same 12.8% annual growth trajectory. Commercial performance can vary around that path with semiconductor cycles and package qualification timing, but the long-run market case is anchored in higher interconnect density, miniaturization and advanced-packaging adoption.

Research Sources & Evidence Base

View research sources used for this overview.
  1. Semiconductor Industry Association. Global Annual Semiconductor Sales Increase 25.6% to $791.7 Billion in 2025, global and regional semiconductor sales context, 6 February 2026.
  2. SEMI. Global Capacity for 7nm and Below to Reach 1.4 Million Wafers Per Month by 2028, advanced-node capacity and semiconductor manufacturing expansion, 25 June 2025.
  3. NIST / U.S. Department of Commerce. U.S. Department of Commerce Announces $1.4 Billion in Final Awards to Support the Next Generation of U.S. Semiconductor Advanced Packaging, advanced-packaging and substrate/material research funding, 16 January 2025.
  4. ASE. ASE Launches Automated 310mm Panel-Level Packaging to Accelerate AI Innovation, 310 mm × 310 mm panel-level packaging line and production timing, 26 May 2026.
  5. ASE. ASE Breaks Ground on New High-Tech Facility in Kaohsiung, NT$17.8 billion investment, completion timeline and employment, 11 March 2026.
Global Molded Interconnect Substrate (MIS) Market, Size, Trends, Business Strategies 2026-2034

Get Sample Report PDF for Exclusive Insights

Report Sample Includes

  • Table of Contents
  • List of Tables & Figures
  • Charts, Research Methodology, and more...

PDF Icon Download Sample Report PDF

Download Sample Report

Table of Content

Table of Contents
1 Research Methodology and Statistical Scope
1.1 Market Definition and Statistical Scope of Molded Interconnect Substrate (MIS)
1.2 Key Market Segments
1.2.1 Molded Interconnect Substrate (MIS) Segment by Type
1.2.2 Molded Interconnect Substrate (MIS) Segment by Application
1.3 Methodology & Sources of Information
1.3.1 Research Methodology
1.3.2 Research Process
1.3.3 Market Breakdown and Data Triangulation
1.3.4 Base Year
1.3.5 Report Assumptions & Caveats
2 Molded Interconnect Substrate (MIS) Market Overview
2.1 Global Market Overview
2.1.1 Global Molded Interconnect Substrate (MIS) Market Size (M USD) Estimates and Forecasts (2019-2032)
2.1.2 Global Molded Interconnect Substrate (MIS) Sales Estimates and Forecasts (2019-2032)
2.2 Market Segment Executive Summary
2.3 Global Market Size by Region
3 Molded Interconnect Substrate (MIS) Market Competitive Landscape
3.1 Global Molded Interconnect Substrate (MIS) Sales by Manufacturers (2019-2025)
3.2 Global Molded Interconnect Substrate (MIS) Revenue Market Share by Manufacturers (2019-2025)
3.3 Molded Interconnect Substrate (MIS) Market Share by Company Type (Tier 1, Tier 2, and Tier 3)
3.4 Global Molded Interconnect Substrate (MIS) Average Price by Manufacturers (2019-2025)
3.5 Manufacturers Molded Interconnect Substrate (MIS) Sales Sites, Area Served, Product Type
3.6 Molded Interconnect Substrate (MIS) Market Competitive Situation and Trends
3.6.1 Molded Interconnect Substrate (MIS) Market Concentration Rate
3.6.2 Global 5 and 10 Largest Molded Interconnect Substrate (MIS) Players Market Share by Revenue
3.6.3 Mergers & Acquisitions, Expansion
4 Molded Interconnect Substrate (MIS) Industry Chain Analysis
4.1 Molded Interconnect Substrate (MIS) Industry Chain Analysis
4.2 Market Overview of Key Raw Materials
4.3 Midstream Market Analysis
4.4 Downstream Customer Analysis
5 The Development and Dynamics of Molded Interconnect Substrate (MIS) Market
5.1 Key Development Trends
5.2 Driving Factors
5.3 Market Challenges
5.4 Market Restraints
5.5 Industry News
5.5.1 New Product Developments
5.5.2 Mergers & Acquisitions
5.5.3 Expansions
5.5.4 Collaboration/Supply Contracts
5.6 Industry Policies
6 Molded Interconnect Substrate (MIS) Market Segmentation by Type
6.1 Evaluation Matrix of Segment Market Development Potential (Type)
6.2 Global Molded Interconnect Substrate (MIS) Sales Market Share by Type (2019-2025)
6.3 Global Molded Interconnect Substrate (MIS) Market Size Market Share by Type (2019-2025)
6.4 Global Molded Interconnect Substrate (MIS) Price by Type (2019-2025)
7 Molded Interconnect Substrate (MIS) Market Segmentation by Application
7.1 Evaluation Matrix of Segment Market Development Potential (Application)
7.2 Global Molded Interconnect Substrate (MIS) Market Sales by Application (2019-2025)
7.3 Global Molded Interconnect Substrate (MIS) Market Size (M USD) by Application (2019-2025)
7.4 Global Molded Interconnect Substrate (MIS) Sales Growth Rate by Application (2019-2025)
8 Molded Interconnect Substrate (MIS) Market Consumption by Region
8.1 Global Molded Interconnect Substrate (MIS) Sales by Region
8.1.1 Global Molded Interconnect Substrate (MIS) Sales by Region
8.1.2 Global Molded Interconnect Substrate (MIS) Sales Market Share by Region
8.2 North America
8.2.1 North America Molded Interconnect Substrate (MIS) Sales by Country
8.2.2 U.S.
8.2.3 Canada
8.2.4 Mexico
8.3 Europe
8.3.1 Europe Molded Interconnect Substrate (MIS) Sales by Country
8.3.2 Germany
8.3.3 France
8.3.4 U.K.
8.3.5 Italy
8.3.6 Russia
8.4 Asia Pacific
8.4.1 Asia Pacific Molded Interconnect Substrate (MIS) Sales by Region
8.4.2 China
8.4.3 Japan
8.4.4 South Korea
8.4.5 India
8.4.6 Southeast Asia
8.5 South America
8.5.1 South America Molded Interconnect Substrate (MIS) Sales by Country
8.5.2 Brazil
8.5.3 Argentina
8.5.4 Columbia
8.6 Middle East and Africa
8.6.1 Middle East and Africa Molded Interconnect Substrate (MIS) Sales by Region
8.6.2 Saudi Arabia
8.6.3 UAE
8.6.4 Egypt
8.6.5 Nigeria
8.6.6 South Africa
9 Molded Interconnect Substrate (MIS) Market Production by Region
9.1 Global Production of Molded Interconnect Substrate (MIS) by Region (2019-2025)
9.2 Global Molded Interconnect Substrate (MIS) Revenue Market Share by Region (2019-2025)
9.3 Global Molded Interconnect Substrate (MIS) Production, Revenue, Price and Gross Margin (2019-2025)
9.4 North America Molded Interconnect Substrate (MIS) Production
9.4.1 North America Molded Interconnect Substrate (MIS) Production Growth Rate (2019-2025)
9.4.2 North America Molded Interconnect Substrate (MIS) Production, Revenue, Price and Gross Margin (2019-2025)
9.5 Europe Molded Interconnect Substrate (MIS) Production
9.5.1 Europe Molded Interconnect Substrate (MIS) Production Growth Rate (2019-2025)
9.5.2 Europe Molded Interconnect Substrate (MIS) Production, Revenue, Price and Gross Margin (2019-2025)
9.6 Japan Molded Interconnect Substrate (MIS) Production (2019-2025)
9.6.1 Japan Molded Interconnect Substrate (MIS) Production Growth Rate (2019-2025)
9.6.2 Japan Molded Interconnect Substrate (MIS) Production, Revenue, Price and Gross Margin (2019-2025)
9.7 China Molded Interconnect Substrate (MIS) Production (2019-2025)
9.7.1 China Molded Interconnect Substrate (MIS) Production Growth Rate (2019-2025)
9.7.2 China Molded Interconnect Substrate (MIS) Production, Revenue, Price and Gross Margin (2019-2025)
10 Key Companies Profile
10.1 ASM Advanced Packaging Materials
10.1.1 ASM Advanced Packaging Materials Molded Interconnect Substrate (MIS) Basic Information
10.1.2 ASM Advanced Packaging Materials Molded Interconnect Substrate (MIS) Product Overview
10.1.3 ASM Advanced Packaging Materials Molded Interconnect Substrate (MIS) Product Market Performance
10.1.4 ASM Advanced Packaging Materials Business Overview
10.1.5 ASM Advanced Packaging Materials Molded Interconnect Substrate (MIS) SWOT Analysis
10.1.6 ASM Advanced Packaging Materials Recent Developments
10.2 Unisem
10.2.1 Unisem Molded Interconnect Substrate (MIS) Basic Information
10.2.2 Unisem Molded Interconnect Substrate (MIS) Product Overview
10.2.3 Unisem Molded Interconnect Substrate (MIS) Product Market Performance
10.2.4 Unisem Business Overview
10.2.5 Unisem Molded Interconnect Substrate (MIS) SWOT Analysis
10.2.6 Unisem Recent Developments
10.3 Advanpack
10.3.1 Advanpack Molded Interconnect Substrate (MIS) Basic Information
10.3.2 Advanpack Molded Interconnect Substrate (MIS) Product Overview
10.3.3 Advanpack Molded Interconnect Substrate (MIS) Product Market Performance
10.3.4 Advanpack Molded Interconnect Substrate (MIS) SWOT Analysis
10.3.5 Advanpack Business Overview
10.3.6 Advanpack Recent Developments
10.4 ASE Material
10.4.1 ASE Material Molded Interconnect Substrate (MIS) Basic Information
10.4.2 ASE Material Molded Interconnect Substrate (MIS) Product Overview
10.4.3 ASE Material Molded Interconnect Substrate (MIS) Product Market Performance
10.4.4 ASE Material Business Overview
10.4.5 ASE Material Recent Developments
10.5 Carsem
10.5.1 Carsem Molded Interconnect Substrate (MIS) Basic Information
10.5.2 Carsem Molded Interconnect Substrate (MIS) Product Overview
10.5.3 Carsem Molded Interconnect Substrate (MIS) Product Market Performance
10.5.4 Carsem Business Overview
10.5.5 Carsem Recent Developments
10.6 JCET Group
10.6.1 JCET Group Molded Interconnect Substrate (MIS) Basic Information
10.6.2 JCET Group Molded Interconnect Substrate (MIS) Product Overview
10.6.3 JCET Group Molded Interconnect Substrate (MIS) Product Market Performance
10.6.4 JCET Group Business Overview
10.6.5 JCET Group Recent Developments
11 Molded Interconnect Substrate (MIS) Market Forecast by Region
11.1 Global Molded Interconnect Substrate (MIS) Market Size Forecast
11.2 Global Molded Interconnect Substrate (MIS) Market Forecast by Region
11.2.1 North America Market Size Forecast by Country
11.2.2 Europe Molded Interconnect Substrate (MIS) Market Size Forecast by Country
11.2.3 Asia Pacific Molded Interconnect Substrate (MIS) Market Size Forecast by Region
11.2.4 South America Molded Interconnect Substrate (MIS) Market Size Forecast by Country
11.2.5 Middle East and Africa Forecasted Consumption of Molded Interconnect Substrate (MIS) by Country
12 Forecast Market by Type and by Application (2025-2032)
12.1 Global Molded Interconnect Substrate (MIS) Market Forecast by Type (2025-2032)
12.1.1 Global Forecasted Sales of Molded Interconnect Substrate (MIS) by Type (2025-2032)
12.1.2 Global Molded Interconnect Substrate (MIS) Market Size Forecast by Type (2025-2032)
12.1.3 Global Forecasted Price of Molded Interconnect Substrate (MIS) by Type (2025-2032)
12.2 Global Molded Interconnect Substrate (MIS) Market Forecast by Application (2025-2032)
12.2.1 Global Molded Interconnect Substrate (MIS) Sales (K Units) Forecast by Application
12.2.2 Global Molded Interconnect Substrate (MIS) Market Size (M USD) Forecast by Application (2025-2032)
13 Conclusion and Key FindingsList of Tables
Table 1. Introduction of the Type
Table 2. Introduction of the Application
Table 3. Market Size (M USD) Segment Executive Summary
Table 4. Molded Interconnect Substrate (MIS) Market Size Comparison by Region (M USD)
Table 5. Global Molded Interconnect Substrate (MIS) Sales (K Units) by Manufacturers (2019-2025)
Table 6. Global Molded Interconnect Substrate (MIS) Sales Market Share by Manufacturers (2019-2025)
Table 7. Global Molded Interconnect Substrate (MIS) Revenue (M USD) by Manufacturers (2019-2025)
Table 8. Global Molded Interconnect Substrate (MIS) Revenue Share by Manufacturers (2019-2025)
Table 9. Company Type (Tier 1, Tier 2, and Tier 3) & (based on the Revenue in Molded Interconnect Substrate (MIS) as of 2022)
Table 10. Global Market Molded Interconnect Substrate (MIS) Average Price (USD/Unit) of Key Manufacturers (2019-2025)
Table 11. Manufacturers Molded Interconnect Substrate (MIS) Sales Sites and Area Served
Table 12. Manufacturers Molded Interconnect Substrate (MIS) Product Type
Table 13. Global Molded Interconnect Substrate (MIS) Manufacturers Market Concentration Ratio (CR5 and HHI)
Table 14. Mergers & Acquisitions, Expansion Plans
Table 15. Industry Chain Map of Molded Interconnect Substrate (MIS)
Table 16. Market Overview of Key Raw Materials
Table 17. Midstream Market Analysis
Table 18. Downstream Customer Analysis
Table 19. Key Development Trends
Table 20. Driving Factors
Table 21. Molded Interconnect Substrate (MIS) Market Challenges
Table 22. Global Molded Interconnect Substrate (MIS) Sales by Type (K Units)
Table 23. Global Molded Interconnect Substrate (MIS) Market Size by Type (M USD)
Table 24. Global Molded Interconnect Substrate (MIS) Sales (K Units) by Type (2019-2025)
Table 25. Global Molded Interconnect Substrate (MIS) Sales Market Share by Type (2019-2025)
Table 26. Global Molded Interconnect Substrate (MIS) Market Size (M USD) by Type (2019-2025)
Table 27. Global Molded Interconnect Substrate (MIS) Market Size Share by Type (2019-2025)
Table 28. Global Molded Interconnect Substrate (MIS) Price (USD/Unit) by Type (2019-2025)
Table 29. Global Molded Interconnect Substrate (MIS) Sales (K Units) by Application
Table 30. Global Molded Interconnect Substrate (MIS) Market Size by Application
Table 31. Global Molded Interconnect Substrate (MIS) Sales by Application (2019-2025) & (K Units)
Table 32. Global Molded Interconnect Substrate (MIS) Sales Market Share by Application (2019-2025)
Table 33. Global Molded Interconnect Substrate (MIS) Sales by Application (2019-2025) & (M USD)
Table 34. Global Molded Interconnect Substrate (MIS) Market Share by Application (2019-2025)
Table 35. Global Molded Interconnect Substrate (MIS) Sales Growth Rate by Application (2019-2025)
Table 36. Global Molded Interconnect Substrate (MIS) Sales by Region (2019-2025) & (K Units)
Table 37. Global Molded Interconnect Substrate (MIS) Sales Market Share by Region (2019-2025)
Table 38. North America Molded Interconnect Substrate (MIS) Sales by Country (2019-2025) & (K Units)
Table 39. Europe Molded Interconnect Substrate (MIS) Sales by Country (2019-2025) & (K Units)
Table 40. Asia Pacific Molded Interconnect Substrate (MIS) Sales by Region (2019-2025) & (K Units)
Table 41. South America Molded Interconnect Substrate (MIS) Sales by Country (2019-2025) & (K Units)
Table 42. Middle East and Africa Molded Interconnect Substrate (MIS) Sales by Region (2019-2025) & (K Units)
Table 43. Global Molded Interconnect Substrate (MIS) Production (K Units) by Region (2019-2025)
Table 44. Global Molded Interconnect Substrate (MIS) Revenue (US$ Million) by Region (2019-2025)
Table 45. Global Molded Interconnect Substrate (MIS) Revenue Market Share by Region (2019-2025)
Table 46. Global Molded Interconnect Substrate (MIS) Production (K Units), Revenue (US$ Million), Price (USD/Unit) and Gross Margin (2019-2025)
Table 47. North America Molded Interconnect Substrate (MIS) Production (K Units), Revenue (US$ Million), Price (USD/Unit) and Gross Margin (2019-2025)
Table 48. Europe Molded Interconnect Substrate (MIS) Production (K Units), Revenue (US$ Million), Price (USD/Unit) and Gross Margin (2019-2025)
Table 49. Japan Molded Interconnect Substrate (MIS) Production (K Units), Revenue (US$ Million), Price (USD/Unit) and Gross Margin (2019-2025)
Table 50. China Molded Interconnect Substrate (MIS) Production (K Units), Revenue (US$ Million), Price (USD/Unit) and Gross Margin (2019-2025)
Table 51. ASM Advanced Packaging Materials Molded Interconnect Substrate (MIS) Basic Information
Table 52. ASM Advanced Packaging Materials Molded Interconnect Substrate (MIS) Product Overview
Table 53. ASM Advanced Packaging Materials Molded Interconnect Substrate (MIS) Sales (K Units), Revenue (M USD), Price (USD/Unit) and Gross Margin (2019-2025)
Table 54. ASM Advanced Packaging Materials Business Overview
Table 55. ASM Advanced Packaging Materials Molded Interconnect Substrate (MIS) SWOT Analysis
Table 56. ASM Advanced Packaging Materials Recent Developments
Table 57. Unisem Molded Interconnect Substrate (MIS) Basic Information
Table 58. Unisem Molded Interconnect Substrate (MIS) Product Overview
Table 59. Unisem Molded Interconnect Substrate (MIS) Sales (K Units), Revenue (M USD), Price (USD/Unit) and Gross Margin (2019-2025)
Table 60. Unisem Business Overview
Table 61. Unisem Molded Interconnect Substrate (MIS) SWOT Analysis
Table 62. Unisem Recent Developments
Table 63. Advanpack Molded Interconnect Substrate (MIS) Basic Information
Table 64. Advanpack Molded Interconnect Substrate (MIS) Product Overview
Table 65. Advanpack Molded Interconnect Substrate (MIS) Sales (K Units), Revenue (M USD), Price (USD/Unit) and Gross Margin (2019-2025)
Table 66. Advanpack Molded Interconnect Substrate (MIS) SWOT Analysis
Table 67. Advanpack Business Overview
Table 68. Advanpack Recent Developments
Table 69. ASE Material Molded Interconnect Substrate (MIS) Basic Information
Table 70. ASE Material Molded Interconnect Substrate (MIS) Product Overview
Table 71. ASE Material Molded Interconnect Substrate (MIS) Sales (K Units), Revenue (M USD), Price (USD/Unit) and Gross Margin (2019-2025)
Table 72. ASE Material Business Overview
Table 73. ASE Material Recent Developments
Table 74. Carsem Molded Interconnect Substrate (MIS) Basic Information
Table 75. Carsem Molded Interconnect Substrate (MIS) Product Overview
Table 76. Carsem Molded Interconnect Substrate (MIS) Sales (K Units), Revenue (M USD), Price (USD/Unit) and Gross Margin (2019-2025)
Table 77. Carsem Business Overview
Table 78. Carsem Recent Developments
Table 79. JCET Group Molded Interconnect Substrate (MIS) Basic Information
Table 80. JCET Group Molded Interconnect Substrate (MIS) Product Overview
Table 81. JCET Group Molded Interconnect Substrate (MIS) Sales (K Units), Revenue (M USD), Price (USD/Unit) and Gross Margin (2019-2025)
Table 82. JCET Group Business Overview
Table 83. JCET Group Recent Developments
Table 84. Global Molded Interconnect Substrate (MIS) Sales Forecast by Region (2025-2032) & (K Units)
Table 85. Global Molded Interconnect Substrate (MIS) Market Size Forecast by Region (2025-2032) & (M USD)
Table 86. North America Molded Interconnect Substrate (MIS) Sales Forecast by Country (2025-2032) & (K Units)
Table 87. North America Molded Interconnect Substrate (MIS) Market Size Forecast by Country (2025-2032) & (M USD)
Table 88. Europe Molded Interconnect Substrate (MIS) Sales Forecast by Country (2025-2032) & (K Units)
Table 89. Europe Molded Interconnect Substrate (MIS) Market Size Forecast by Country (2025-2032) & (M USD)
Table 90. Asia Pacific Molded Interconnect Substrate (MIS) Sales Forecast by Region (2025-2032) & (K Units)
Table 91. Asia Pacific Molded Interconnect Substrate (MIS) Market Size Forecast by Region (2025-2032) & (M USD)
Table 92. South America Molded Interconnect Substrate (MIS) Sales Forecast by Country (2025-2032) & (K Units)
Table 93. South America Molded Interconnect Substrate (MIS) Market Size Forecast by Country (2025-2032) & (M USD)
Table 94. Middle East and Africa Molded Interconnect Substrate (MIS) Consumption Forecast by Country (2025-2032) & (Units)
Table 95. Middle East and Africa Molded Interconnect Substrate (MIS) Market Size Forecast by Country (2025-2032) & (M USD)
Table 96. Global Molded Interconnect Substrate (MIS) Sales Forecast by Type (2025-2032) & (K Units)
Table 97. Global Molded Interconnect Substrate (MIS) Market Size Forecast by Type (2025-2032) & (M USD)
Table 98. Global Molded Interconnect Substrate (MIS) Price Forecast by Type (2025-2032) & (USD/Unit)
Table 99. Global Molded Interconnect Substrate (MIS) Sales (K Units) Forecast by Application (2025-2032)
Table 100. Global Molded Interconnect Substrate (MIS) Market Size Forecast by Application (2025-2032) & (M USD)
List of Figures
Figure 1. Product Picture of Molded Interconnect Substrate (MIS)
Figure 2. Data Triangulation
Figure 3. Key Caveats
Figure 4. Global Molded Interconnect Substrate (MIS) Market Size (M USD), 2019-2032
Figure 5. Global Molded Interconnect Substrate (MIS) Market Size (M USD) (2019-2032)
Figure 6. Global Molded Interconnect Substrate (MIS) Sales (K Units) & (2019-2032)
Figure 7. Evaluation Matrix of Segment Market Development Potential (Type)
Figure 8. Evaluation Matrix of Segment Market Development Potential (Application)
Figure 9. Evaluation Matrix of Regional Market Development Potential
Figure 10. Molded Interconnect Substrate (MIS) Market Size by Country (M USD)
Figure 11. Molded Interconnect Substrate (MIS) Sales Share by Manufacturers in 2023
Figure 12. Global Molded Interconnect Substrate (MIS) Revenue Share by Manufacturers in 2023
Figure 13. Molded Interconnect Substrate (MIS) Market Share by Company Type (Tier 1, Tier 2 and Tier 3): 2023
Figure 14. Global Market Molded Interconnect Substrate (MIS) Average Price (USD/Unit) of Key Manufacturers in 2023
Figure 15. The Global 5 and 10 Largest Players: Market Share by Molded Interconnect Substrate (MIS) Revenue in 2023
Figure 16. Evaluation Matrix of Segment Market Development Potential (Type)
Figure 17. Global Molded Interconnect Substrate (MIS) Market Share by Type
Figure 18. Sales Market Share of Molded Interconnect Substrate (MIS) by Type (2019-2025)
Figure 19. Sales Market Share of Molded Interconnect Substrate (MIS) by Type in 2023
Figure 20. Market Size Share of Molded Interconnect Substrate (MIS) by Type (2019-2025)
Figure 21. Market Size Market Share of Molded Interconnect Substrate (MIS) by Type in 2023
Figure 22. Evaluation Matrix of Segment Market Development Potential (Application)
Figure 23. Global Molded Interconnect Substrate (MIS) Market Share by Application
Figure 24. Global Molded Interconnect Substrate (MIS) Sales Market Share by Application (2019-2025)
Figure 25. Global Molded Interconnect Substrate (MIS) Sales Market Share by Application in 2023
Figure 26. Global Molded Interconnect Substrate (MIS) Market Share by Application (2019-2025)
Figure 27. Global Molded Interconnect Substrate (MIS) Market Share by Application in 2023
Figure 28. Global Molded Interconnect Substrate (MIS) Sales Growth Rate by Application (2019-2025)
Figure 29. Global Molded Interconnect Substrate (MIS) Sales Market Share by Region (2019-2025)
Figure 30. North America Molded Interconnect Substrate (MIS) Sales and Growth Rate (2019-2025) & (K Units)
Figure 31. North America Molded Interconnect Substrate (MIS) Sales Market Share by Country in 2023
Figure 32. U.S. Molded Interconnect Substrate (MIS) Sales and Growth Rate (2019-2025) & (K Units)
Figure 33. Canada Molded Interconnect Substrate (MIS) Sales (K Units) and Growth Rate (2019-2025)
Figure 34. Mexico Molded Interconnect Substrate (MIS) Sales (Units) and Growth Rate (2019-2025)
Figure 35. Europe Molded Interconnect Substrate (MIS) Sales and Growth Rate (2019-2025) & (K Units)
Figure 36. Europe Molded Interconnect Substrate (MIS) Sales Market Share by Country in 2023
Figure 37. Germany Molded Interconnect Substrate (MIS) Sales and Growth Rate (2019-2025) & (K Units)
Figure 38. France Molded Interconnect Substrate (MIS) Sales and Growth Rate (2019-2025) & (K Units)
Figure 39. U.K. Molded Interconnect Substrate (MIS) Sales and Growth Rate (2019-2025) & (K Units)
Figure 40. Italy Molded Interconnect Substrate (MIS) Sales and Growth Rate (2019-2025) & (K Units)
Figure 41. Russia Molded Interconnect Substrate (MIS) Sales and Growth Rate (2019-2025) & (K Units)
Figure 42. Asia Pacific Molded Interconnect Substrate (MIS) Sales and Growth Rate (K Units)
Figure 43. Asia Pacific Molded Interconnect Substrate (MIS) Sales Market Share by Region in 2023
Figure 44. China Molded Interconnect Substrate (MIS) Sales and Growth Rate (2019-2025) & (K Units)
Figure 45. Japan Molded Interconnect Substrate (MIS) Sales and Growth Rate (2019-2025) & (K Units)
Figure 46. South Korea Molded Interconnect Substrate (MIS) Sales and Growth Rate (2019-2025) & (K Units)
Figure 47. India Molded Interconnect Substrate (MIS) Sales and Growth Rate (2019-2025) & (K Units)
Figure 48. Southeast Asia Molded Interconnect Substrate (MIS) Sales and Growth Rate (2019-2025) & (K Units)
Figure 49. South America Molded Interconnect Substrate (MIS) Sales and Growth Rate (K Units)
Figure 50. South America Molded Interconnect Substrate (MIS) Sales Market Share by Country in 2023
Figure 51. Brazil Molded Interconnect Substrate (MIS) Sales and Growth Rate (2019-2025) & (K Units)
Figure 52. Argentina Molded Interconnect Substrate (MIS) Sales and Growth Rate (2019-2025) & (K Units)
Figure 53. Columbia Molded Interconnect Substrate (MIS) Sales and Growth Rate (2019-2025) & (K Units)
Figure 54. Middle East and Africa Molded Interconnect Substrate (MIS) Sales and Growth Rate (K Units)
Figure 55. Middle East and Africa Molded Interconnect Substrate (MIS) Sales Market Share by Region in 2023
Figure 56. Saudi Arabia Molded Interconnect Substrate (MIS) Sales and Growth Rate (2019-2025) & (K Units)
Figure 57. UAE Molded Interconnect Substrate (MIS) Sales and Growth Rate (2019-2025) & (K Units)
Figure 58. Egypt Molded Interconnect Substrate (MIS) Sales and Growth Rate (2019-2025) & (K Units)
Figure 59. Nigeria Molded Interconnect Substrate (MIS) Sales and Growth Rate (2019-2025) & (K Units)
Figure 60. South Africa Molded Interconnect Substrate (MIS) Sales and Growth Rate (2019-2025) & (K Units)
Figure 61. Global Molded Interconnect Substrate (MIS) Production Market Share by Region (2019-2025)
Figure 62. North America Molded Interconnect Substrate (MIS) Production (K Units) Growth Rate (2019-2025)
Figure 63. Europe Molded Interconnect Substrate (MIS) Production (K Units) Growth Rate (2019-2025)
Figure 64. Japan Molded Interconnect Substrate (MIS) Production (K Units) Growth Rate (2019-2025)
Figure 65. China Molded Interconnect Substrate (MIS) Production (K Units) Growth Rate (2019-2025)
Figure 66. Global Molded Interconnect Substrate (MIS) Sales Forecast by Volume (2019-2032) & (K Units)
Figure 67. Global Molded Interconnect Substrate (MIS) Market Size Forecast by Value (2019-2032) & (M USD)
Figure 68. Global Molded Interconnect Substrate (MIS) Sales Market Share Forecast by Type (2025-2032)
Figure 69. Global Molded Interconnect Substrate (MIS) Market Share Forecast by Type (2025-2032)
Figure 70. Global Molded Interconnect Substrate (MIS) Sales Forecast by Application (2025-2032)
Figure 71. Global Molded Interconnect Substrate (MIS) Market Share Forecast by Application (2025-2032)