Microlenses Arrays Market Overview
Micro-Lens array is an array composed of lenses with micron aperture and relief depth. It not only has the basic functions of traditional lens such as focusing and imaging, but also has the characteristics of small unit size and high integration, which makes it able to complete the functions that traditional optical elements can’t accomplish, and can form many new optical systems.
This report provides a deep insight into the global Microlenses Arrays market covering all its essential aspects. This ranges from a macro overview of the market to micro details of the market size, competitive landscape, development trend, niche market, key market drivers and challenges, SWOT analysis, value chain analysis, etc.
The analysis helps the reader to shape the competition within the industries and strategies for the competitive environment to enhance the potential profit. Furthermore, it provides a simple framework for evaluating and accessing the position of the business organization. The report structure also focuses on the competitive landscape of the Global Microlenses Arrays Market, this report introduces in detail the market share, market performance, product situation, operation situation, etc. of the main players, which helps the readers in the industry to identify the main competitors and deeply understand the competition pattern of the market.
In a word, this report is a must-read for industry players, investors, researchers, consultants, business strategists, and all those who have any kind of stake or are planning to foray into the Microlenses Arrays market in any manner.
Microlenses Arrays Market Analysis:
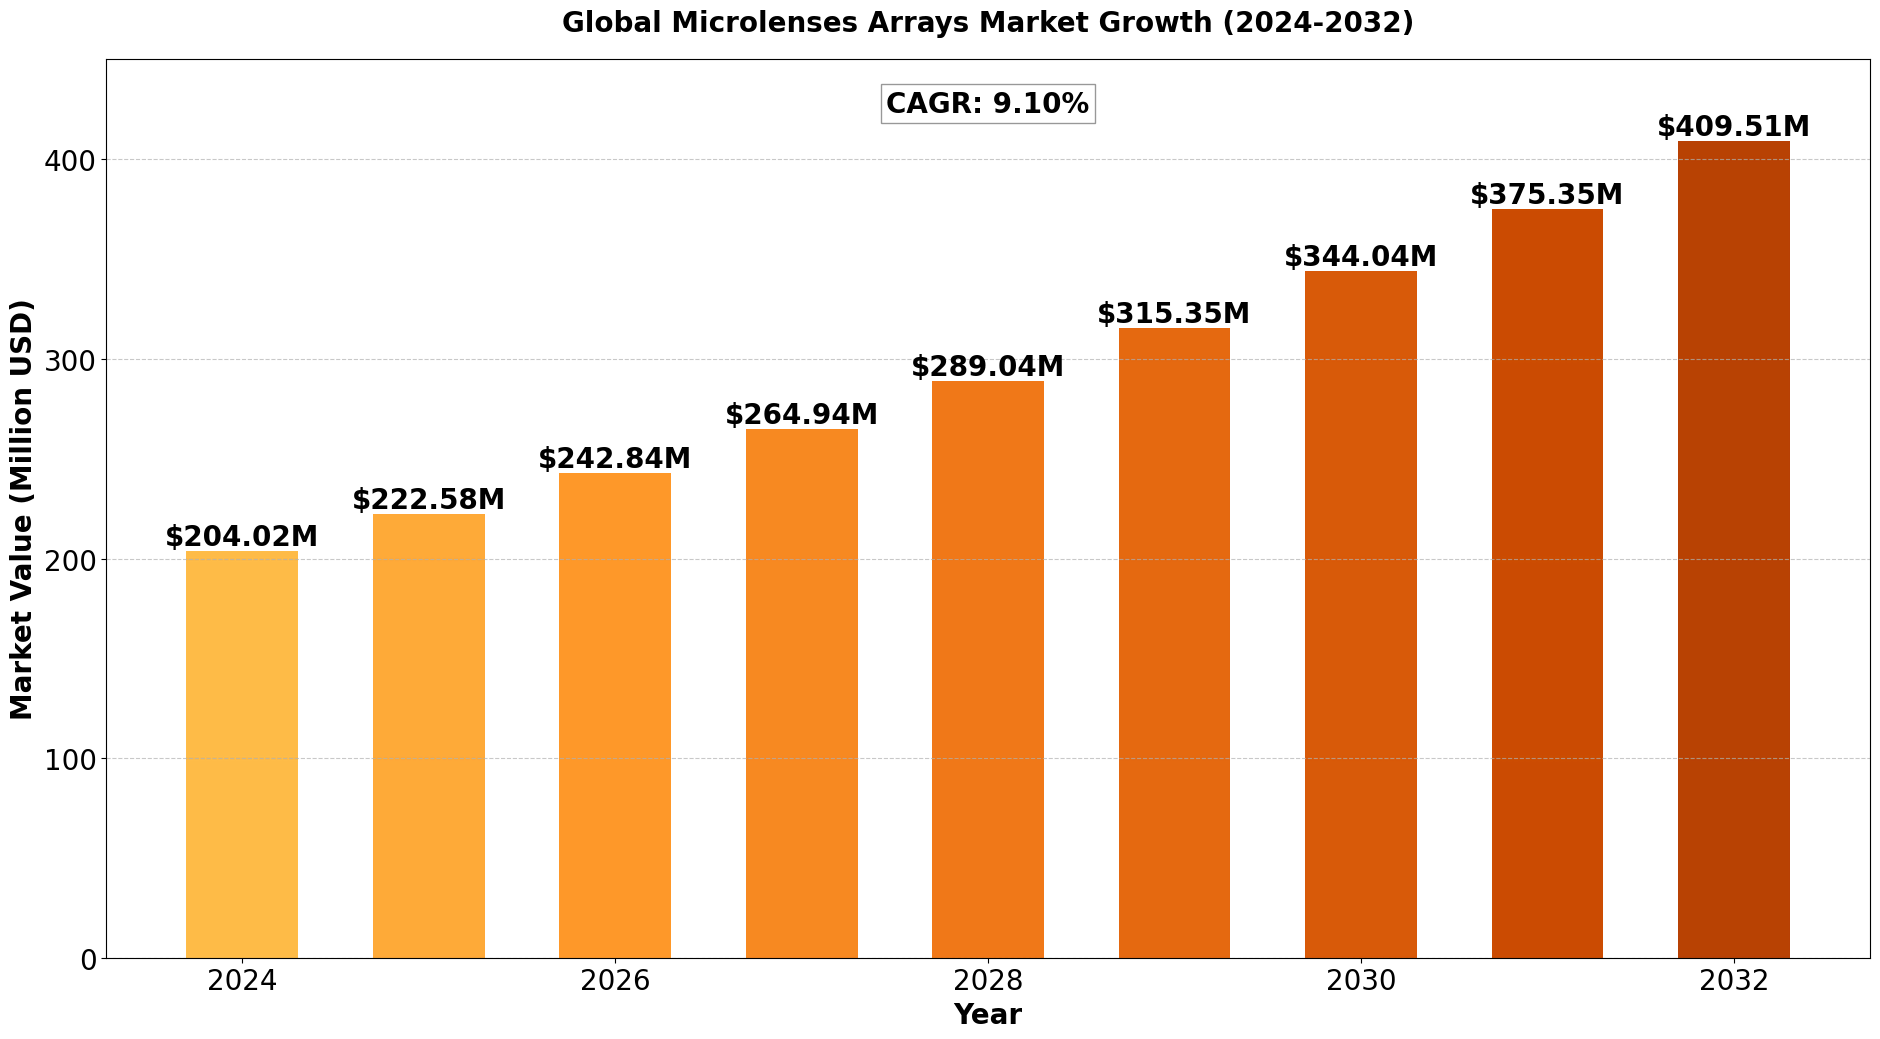
The Global Microlenses Arrays Market size was estimated at USD 187 million in 2023 and is projected to reach USD 409.51 million by 2032, exhibiting a CAGR of 9.10% during the forecast period.
North America Microlenses Arrays market size was estimated at USD 56.62 million in 2023, at a CAGR of 7.80% during the forecast period of 2025 through 2032.
Microlenses Arrays Key Market Trends :
Growing Demand in 3D Imaging & Display
The rising adoption of microlens arrays in 3D imaging, augmented reality (AR), and virtual reality (VR) is driving market growth, particularly in consumer electronics and healthcare applications.Technological Advancements in Microlens Fabrication
Innovations in nanotechnology and advanced manufacturing techniques are enhancing the precision, efficiency, and scalability of microlens arrays, making them more cost-effective for mass production.Increasing Adoption in Optical Sensors
The growing use of microlens arrays in optical sensors, LiDAR systems, and imaging applications is boosting their demand in industries like automotive, aerospace, and defense.Rising Investments in Medical Imaging
The medical sector is leveraging microlens arrays for improved imaging in endoscopy, microscopy, and other diagnostic tools, enhancing patient outcomes and medical research capabilities.Expanding Applications in Automotive Industry
Microlens arrays are being widely used in head-up displays (HUDs), advanced driver-assistance systems (ADAS), and LiDAR, supporting the development of autonomous and smart vehicles.
Microlenses Arrays Market Regional Analysis :

North America:
Strong demand driven by EVs, 5G infrastructure, and renewable energy, with the U.S. leading the market.
Europe:
Growth fueled by automotive electrification, renewable energy, and strong regulatory support, with Germany as a key player.
Asia-Pacific:
Dominates the market due to large-scale manufacturing in China and Japan, with growing demand from EVs, 5G, and semiconductors.
South America:
Emerging market, driven by renewable energy and EV adoption, with Brazil leading growth.
Middle East & Africa:
Gradual growth, mainly due to investments in renewable energy and EV infrastructure, with Saudi Arabia and UAE as key contributors.
Microlenses Arrays Market Segmentation :
The research report includes specific segments by region (country), manufacturers, Type, and Application. Market segmentation creates subsets of a market based on product type, end-user or application, Geographic, and other factors. By understanding the market segments, the decision-maker can leverage this targeting in the product, sales, and marketing strategies. Market segments can power your product development cycles by informing how you create product offerings for different segments.
Key Company
- Sumita
- Axetris AG
- Nanoscribe
- Temicon
- RPC Photonics
- Inc.
- Thorlabs
- Inc.
- Holographix
- Newport Corporation
- INGENERIC
- SUSS MicroOptics SA
- Shanghai Optics
- PowerPhotonic
- NIL Technology
Market Segmentation (by Type)
- Aspherical Microlenses Arrays
- Spherical Microlenses Arrays
Market Segmentation (by Application)
- 3D Imaging and Display
- Medical
- Automotive
- Optical Sensors
Drivers
Surge in Demand for High-Resolution Imaging
Increasing need for superior imaging solutions in healthcare, security, and entertainment industries is propelling market growth.Growing Adoption in Optical Communication
Microlens arrays improve signal transmission in fiber optics, boosting their application in telecom and data centers.Expansion of AR and VR Technologies
The rise of immersive technologies in gaming, education, and retail is creating new opportunities for microlens applications.
Restraints
High Manufacturing Costs
The precision required for microlens fabrication increases production expenses, limiting affordability for small-scale applications.Complex Design and Integration Challenges
Ensuring optimal alignment and efficiency in optical systems can be a challenge, requiring advanced engineering expertise.Limited Awareness in Emerging Markets
Despite growing applications, awareness and adoption in developing regions remain relatively low, affecting market penetration.
Opportunities
Advancements in Nanotechnology
Ongoing research in nanofabrication is expected to enhance microlens performance and reduce production costs.Increasing Demand in the Automotive Sector
The integration of microlens arrays in LiDAR and ADAS presents significant growth potential in smart and autonomous vehicles.Emerging Markets in Asia-Pacific
Countries like China, Japan, and India are witnessing increased investment in optics and photonics, creating new market avenues.
Challenges
Competition from Alternative Technologies
Emerging lens technologies and alternative optical solutions could pose a threat to microlens array adoption.Regulatory and Quality Compliance
Strict industry regulations and quality control standards can impact production efficiency and market expansion.Supply Chain Disruptions
Fluctuations in raw material supply and manufacturing disruptions can affect product availability and pricing.
Key Benefits of This Market Research:
- Industry drivers, restraints, and opportunities covered in the study
- Neutral perspective on the market performance
- Recent industry trends and developments
- Competitive landscape & strategies of key players
- Potential & niche segments and regions exhibiting promising growth covered
- Historical, current, and projected market size, in terms of value
- In-depth analysis of the Microlenses Arrays Market
- Overview of the regional outlook of the Microlenses Arrays Market:
Key Reasons to Buy this Report:
- Access to date statistics compiled by our researchers. These provide you with historical and forecast data, which is analyzed to tell you why your market is set to change
- This enables you to anticipate market changes to remain ahead of your competitors
- You will be able to copy data from the Excel spreadsheet straight into your marketing plans, business presentations, or other strategic documents
- The concise analysis, clear graph, and table format will enable you to pinpoint the information you require quickly
- Provision of market value data for each segment and sub-segment
- Indicates the region and segment that is expected to witness the fastest growth as well as to dominate the market
- Provides insight into the market through Value Chain
- Market dynamics scenario, along with growth opportunities of the market in the years to come
- 6-month post-sales analyst support
Customization of the Report
In case of any queries or customization requirements, please connect with our sales team, who will ensure that your requirements are met.
FAQs
Q: What are the key driving factors and opportunities in the Microlenses Arrays market?
A: The increasing demand for high-resolution imaging, advancements in optical sensors, and the expanding use of microlens arrays in AR/VR, automotive, and medical imaging are driving market growth. Opportunities lie in nanotechnology innovations and rising adoption in smart vehicles.
Q: Which region is projected to have the largest market share?
A: Asia-Pacific is expected to dominate the microlens arrays market due to rapid industrialization, increasing investments in optics, and the presence of key manufacturers in China and Japan.
Q: Who are the top players in the global Microlenses Arrays market?
A: Leading companies include Sumita, Axetris AG, Nanoscribe, Temicon, Thorlabs Inc., Holographix, Newport Corporation, and INGENERIC. These players focus on innovation and expansion to strengthen their market position.
Q: What are the latest technological advancements in the industry?
A: Recent developments include improved nanofabrication techniques, the use of high-precision lithography for better lens alignment, and integration with artificial intelligence (AI) for enhanced imaging applications.
Q: What is the current size of the global Microlenses Arrays market?
A: The market was valued at USD 187 million in 2023 and is projected to reach USD 409.51 million by 2032, with a CAGR of 9.10% during the forecast period.

Get Sample Report PDF for Exclusive Insights
Report Sample Includes
- Table of Contents
- List of Tables & Figures
- Charts, Research Methodology, and more...

