LED Photoelectric Glass Display Market Overview
LED photoelectric glass display is an organic combination of light energy, electric energy and glass. As a kind of glass, photoelectric glass is widely used in engineering, architecture, interior decoration, advertising and so on.
This report provides a deep insight into the global LED Photoelectric Glass Display market covering all its essential aspects. This ranges from a macro overview of the market to micro details of the market size, competitive landscape, development trend, niche market, key market drivers and challenges, SWOT analysis, value chain analysis, etc.
The analysis helps the reader to shape the competition within the industries and strategies for the competitive environment to enhance the potential profit. Furthermore, it provides a simple framework for evaluating and accessing the position of the business organization. The report structure also focuses on the competitive landscape of the Global LED Photoelectric Glass Display Market, this report introduces in detail the market share, market performance, product situation, operation situation, etc. of the main players, which helps the readers in the industry to identify the main competitors and deeply understand the competition pattern of the market.
In a word, this report is a must-read for industry players, investors, researchers, consultants, business strategists, and all those who have any kind of stake or are planning to foray into the LED Photoelectric Glass Display market in any manner.
LED Photoelectric Glass Display Market Analysis:
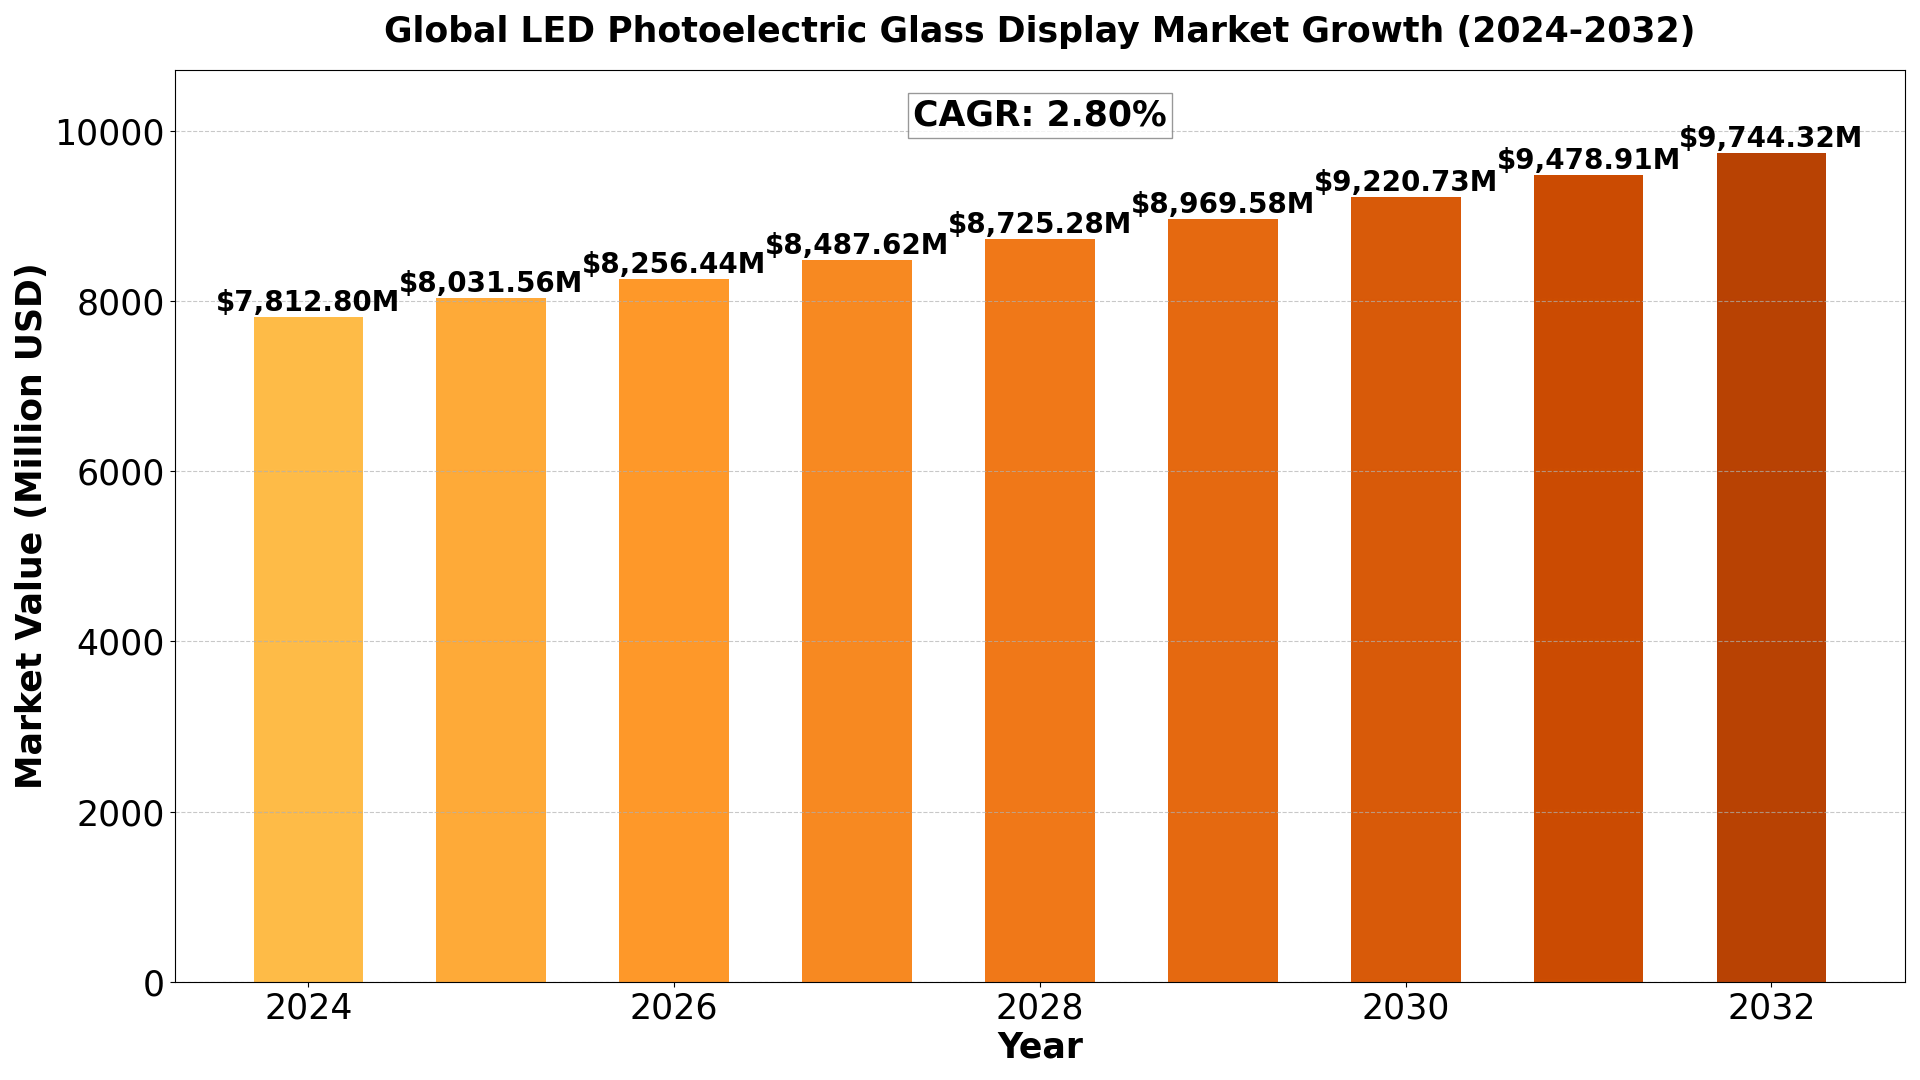
The Global LED Photoelectric Glass Display Market size was estimated at USD 7600 million in 2023 and is projected to reach USD 9744.32 million by 2032, exhibiting a CAGR of 2.80% during the forecast period.
North America LED Photoelectric Glass Display market size was estimated at USD 2076.54 million in 2023, at a CAGR of 2.40% during the forecast period of 2025 through 2032.
LED Photoelectric Glass Display Key Market Trends :
- Rising Demand in Architectural Designs
As the demand for innovative architecture grows, LED photoelectric glass displays are becoming more popular for integrating lighting with design, enhancing aesthetic appeal in buildings. - Advancements in Smart Glass Technologies
The evolution of smart glass, which adjusts to environmental changes, is a significant trend, driven by its application in energy-efficient buildings and interactive displays. - Growing Integration in EVs and Renewable Energy Sectors
With the surge in electric vehicles and renewable energy systems, LED photoelectric glass displays are being adopted for use in automotive dashboards and solar panels, making them more energy-efficient. - Expansion in Commercial Advertising
LED photoelectric glass displays are increasingly used for dynamic advertising solutions in retail spaces, providing more engaging and eye-catching visual content. - Shift Towards Sustainable and Eco-Friendly Solutions
As the world focuses on reducing carbon footprints, there is a growing trend towards the use of eco-friendly LED photoelectric glass displays made from recyclable materials and energy-efficient components.
LED Photoelectric Glass Display Market Regional Analysis :

North America:
Strong demand driven by EVs, 5G infrastructure, and renewable energy, with the U.S. leading the market.
Europe:
Growth fueled by automotive electrification, renewable energy, and strong regulatory support, with Germany as a key player.
Asia-Pacific:
Dominates the market due to large-scale manufacturing in China and Japan, with growing demand from EVs, 5G, and semiconductors.
South America:
Emerging market, driven by renewable energy and EV adoption, with Brazil leading growth.
Middle East & Africa:
Gradual growth, mainly due to investments in renewable energy and EV infrastructure, with Saudi Arabia and UAE as key contributors.
LED Photoelectric Glass Display Market Segmentation :
The research report includes specific segments by region (country), manufacturers, Type, and Application. Market segmentation creates subsets of a market based on product type, end-user or application, Geographic, and other factors. By understanding the market segments, the decision-maker can leverage this targeting in the product, sales, and marketing strategies. Market segments can power your product development cycles by informing how you create product offerings for different segments.
Key Company
- MileStrong
- Leyard Vteam
- Vision Led Pro
- Brompton Technology
- NEXNOVO
- Viewpointec
- Tianqixun Technology
- Shenzhen Guojia Optoelectronics Co.
- Ltd.
- Pro Display
- Glasstronn
- Jasionlight
- ScreeneX
Market Segmentation (by Type)
- Monochrome
- Two Color
- Full Color
Market Segmentation (by Application)
- Consumer Electronics Products
- Commercial Advertising Screen
- Industrial Display
- Others
Drivers
- Rising Demand for Smart Architectural Applications
The integration of LED photoelectric glass displays in modern architecture has seen a surge in demand due to the growing preference for smart buildings and aesthetically pleasing designs. These displays allow for real-time information dissemination and interactive advertising, which are increasingly sought after in commercial and public spaces. - Technological Advancements in LED Displays
Continuous advancements in LED technology, including higher energy efficiency, thinner panels, and improved brightness levels, are driving the adoption of LED photoelectric glass displays. The development of flexible and transparent LED panels further enhances their applicability in diverse environments. - Increased Adoption in Retail and Advertising
Retail outlets and advertisers are increasingly using LED photoelectric glass displays to create visually engaging and dynamic content. These displays offer unique features such as transparency and interactivity, making them ideal for showcasing products and advertisements.
Restraints
- High Initial Investment Costs
The production and installation costs of LED photoelectric glass displays are significantly higher than conventional display technologies. This high upfront cost poses a barrier, especially for small and medium-sized businesses. - Technical Challenges in Integration
Integrating LED displays into architectural glass structures requires advanced engineering and precise customization, which can lead to longer project timelines and increased costs. - Limited Awareness in Emerging Markets
In regions with limited technological penetration and awareness, the adoption of LED photoelectric glass displays remains sluggish, hampering overall market growth.
Opportunities
- Expansion into New Application Areas
Beyond retail and advertising, there is significant potential for LED photoelectric glass displays in healthcare, automotive, and residential sectors. For instance, smart glass displays in cars and homes could transform user experiences by offering interactive interfaces. - Growing Smart City Projects
The proliferation of smart city initiatives worldwide presents a massive opportunity for LED photoelectric glass displays. These cities require innovative solutions for public information systems, advertising, and traffic management, all of which can be enhanced by this technology. - Customization and Design Innovations
Companies are increasingly offering customizable designs and innovative features, such as dynamic color variations and augmented reality (AR) capabilities. These advancements can cater to diverse industry requirements and drive adoption.
Challenges
- Durability and Maintenance Issues
LED photoelectric glass displays face challenges in harsh environmental conditions, such as extreme weather and high humidity, which can impact durability and increase maintenance costs. - Competition from Alternative Technologies
Technologies like OLED and e-ink displays pose competition to LED photoelectric glass displays due to their unique advantages, such as better contrast and lower power consumption. - Regulatory Hurdles
Compliance with building codes and energy regulations can slow down the deployment of LED photoelectric glass displays, particularly in regions with stringent policies.
Key Benefits of This Market Research:
- Industry drivers, restraints, and opportunities covered in the study
- Neutral perspective on the market performance
- Recent industry trends and developments
- Competitive landscape & strategies of key players
- Potential & niche segments and regions exhibiting promising growth covered
- Historical, current, and projected market size, in terms of value
- In-depth analysis of the LED Photoelectric Glass Display Market
- Overview of the regional outlook of the LED Photoelectric Glass Display Market:
Key Reasons to Buy this Report:
- Access to date statistics compiled by our researchers. These provide you with historical and forecast data, which is analyzed to tell you why your market is set to change
- This enables you to anticipate market changes to remain ahead of your competitors
- You will be able to copy data from the Excel spreadsheet straight into your marketing plans, business presentations, or other strategic documents
- The concise analysis, clear graph, and table format will enable you to pinpoint the information you require quickly
- Provision of market value data for each segment and sub-segment
- Indicates the region and segment that is expected to witness the fastest growth as well as to dominate the market
- Includes in-depth analysis of the market from various perspectives through Porters five forces analysis
- Provides insight into the market through Value Chain
- Market dynamics scenario, along with growth opportunities of the market in the years to come
- 6-month post-sales analyst support
Customization of the Report
In case of any queries or customization requirements, please connect with our sales team, who will ensure that your requirements are met.
FAQs
Q: What are the key driving factors and opportunities in the LED Photoelectric Glass Display market?
A: The key drivers include the increasing demand for energy-efficient solutions, advancements in display technology, and the growing adoption of smart buildings. Opportunities lie in interactive displays for retail, government initiatives for sustainable infrastructure, and expansion in the automotive sector.
Q: Which region is projected to have the largest market share?
A: Asia-Pacific is expected to dominate the market due to large-scale manufacturing in China and Japan, with growing demand from electric vehicles, 5G, and semiconductors.
Q: Who are the top players in the global LED Photoelectric Glass Display market?
A: Key players in the market include MileStrong, Leyard Vteam, Vision Led Pro, Brompton Technology, and NEXNOVO.
Q: What are the latest technological advancements in the industry?
A: Recent advancements include improved LED technology with higher resolution, better brightness, and enhanced energy efficiency, along with innovations in smart glass technology.
Q: What is the current size of the global LED Photoelectric Glass Display market?
A: The global LED Photoelectric Glass Display market was valued at USD 7600 million in 2023 and is projected to reach USD 9744.32 million by 2032, growing at a CAGR of 2.80%.
Get Sample Report PDF for Exclusive Insights
Report Sample Includes
- Table of Contents
- List of Tables & Figures
- Charts, Research Methodology, and more...