Global Handheld Optical Gas Imaging (OGI) Camera Market, Size, Trends, Business Strategies 2025-2032

The Global Handheld Optical Gas Imaging (OGI) Camera Market size was estimated at USD 136 million in 2023 and is projected to reach USD 239.71 million by 2032, exhibiting a CAGR of 6.50% during the forecast period.

PDF Icon Download Sample Report PDF
  • Quick Dispatch

    All Orders

  • Secure Payment

    100% Secure Payment

Price range: $1,500.00 through $4,250.00

Clear

Handheld Optical Gas Imaging (OGI) Camera Market Overview

Optical Gas Imaging (OGI) is an innovative thermal imaging technology that utilizes high sensitivity infrared cameras for detecting minute fugitive emissions of industrial gases. Gas leak detection cameras enable the quick and safe detection and visualization of fugitive emissions leaks.

This report provides a deep insight into the global Handheld Optical Gas Imaging (OGI) Camera market covering all its essential aspects. This ranges from a macro overview of the market to micro details of the market size, competitive landscape, development trend, niche market, key market drivers and challenges, SWOT analysis, value chain analysis, etc.

The analysis helps the reader to shape the competition within the industries and strategies for the competitive environment to enhance the potential profit. Furthermore, it provides a simple framework for evaluating and accessing the position of the business organization. The report structure also focuses on the competitive landscape of the Global Handheld Optical Gas Imaging (OGI) Camera Market, this report introduces in detail the market share, market performance, product situation, operation situation, etc. of the main players, which helps the readers in the industry to identify the main competitors and deeply understand the competition pattern of the market.
In a word, this report is a must-read for industry players, investors, researchers, consultants, business strategists, and all those who have any kind of stake or are planning to foray into the Handheld Optical Gas Imaging (OGI) Camera market in any manner.

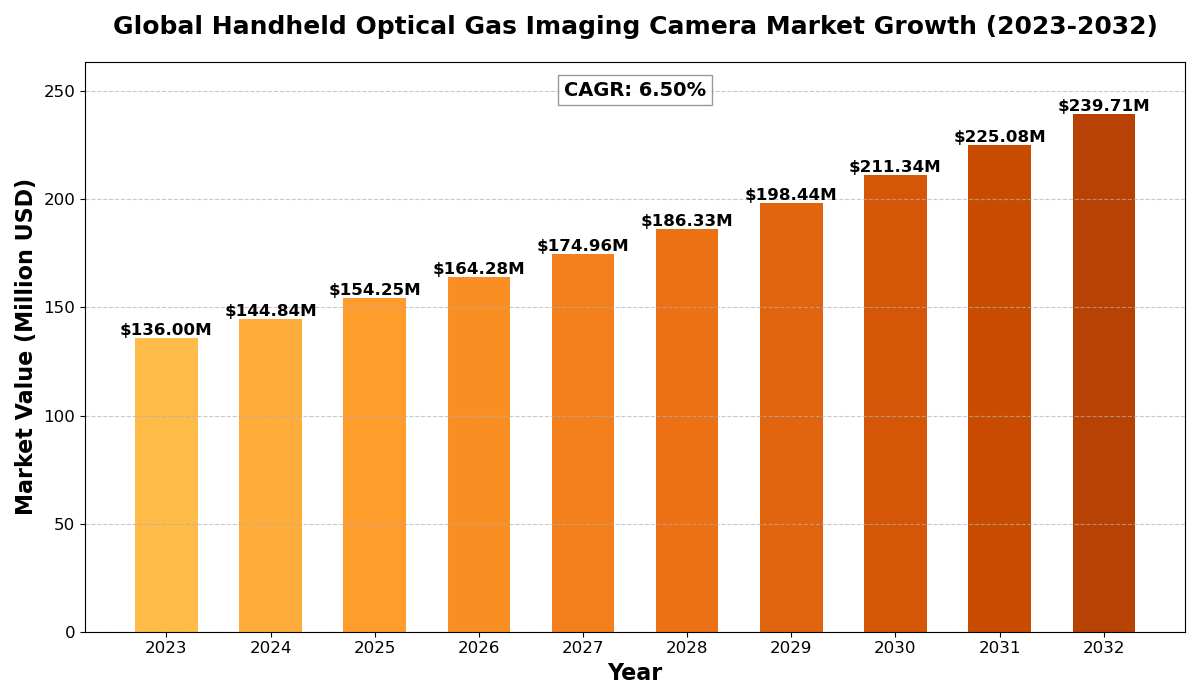
Handheld Optical Gas Imaging (OGI) Camera Market Analysis:

The Global Handheld Optical Gas Imaging (OGI) Camera Market size was estimated at USD 136 million in 2023 and is projected to reach USD 239.71 million by 2032, exhibiting a CAGR of 6.50% during the forecast period.

North America Handheld Optical Gas Imaging (OGI) Camera market size was estimated at USD 39.50 million in 2023, at a CAGR of 5.57% during the forecast period of 2025 through 2032.

Handheld Optical Gas Imaging (OGI) Camera Key Market Trends  :

  1. Technological Advancements in Camera Sensitivity
    There has been a continuous improvement in the sensitivity of infrared cameras, making it easier to detect even the smallest gas leaks, contributing to the growing demand for OGI cameras in various industries.

  2. Rising Environmental Regulations
    Stricter environmental laws and regulations on emission control are boosting the adoption of optical gas imaging cameras as they provide a reliable and non-invasive solution to monitor and detect fugitive emissions in real time.

  3. Growing Industrial Applications
    The demand for handheld OGI cameras is increasing across industries such as oil and gas, chemicals, and power plants, driven by the need for leak detection and safety compliance in hazardous environments.

  4. Shift Towards Uncooled OGI Cameras
    Uncooled OGI cameras are becoming more popular due to their lower cost, ease of use, and lighter weight compared to cooled cameras, especially in smaller industries and emerging markets.

  5. Integration of AI and Machine Learning
    The integration of AI and machine learning technologies in handheld OGI cameras enhances their ability to detect, classify, and report gas leaks, making the systems smarter and more efficient for industrial use.

Handheld Optical Gas Imaging (OGI) Camera Market Regional Analysis :

semi insight

  • North America:

    Strong demand driven by EVs, 5G infrastructure, and renewable energy, with the U.S. leading the market.

  • Europe:

    Growth fueled by automotive electrification, renewable energy, and strong regulatory support, with Germany as a key player.

  • Asia-Pacific:

    Dominates the market due to large-scale manufacturing in China and Japan, with growing demand from EVs, 5G, and semiconductors.

  • South America:

    Emerging market, driven by renewable energy and EV adoption, with Brazil leading growth.

  • Middle East & Africa:

    Gradual growth, mainly due to investments in renewable energy and EV infrastructure, with Saudi Arabia and UAE as key contributors.

Handheld Optical Gas Imaging (OGI) Camera Market Segmentation :

The research report includes specific segments by region (country), manufacturers, Type, and Application. Market segmentation creates subsets of a market based on product type, end-user or application, Geographic, and other factors. By understanding the market segments, the decision-maker can leverage this targeting in the product, sales, and marketing strategies. Market segments can power your product development cycles by informing how you create product offerings for different segments.
Key Company

  • Opgal
  • Sensia
  • FLIR Systems

Market Segmentation (by Type)

  • Uncooled
  • Cooled

Market Segmentation (by Application)

  • Oil and Gas
  • Chemical
  • Others

Drivers

  1. Growing Demand for Leak Detection Solutions
    With industries becoming more focused on minimizing environmental impact, the demand for OGI cameras as an effective tool for detecting leaks and preventing accidents is increasing rapidly.

  2. Increasing Investment in Safety and Compliance
    Companies are investing more in safety technologies to comply with environmental regulations, pushing the demand for handheld OGI cameras to monitor fugitive emissions and reduce risks.

  3. Technological Improvements and Affordability
    The advancements in camera technology, such as better infrared sensing and lower costs of production, make OGI cameras more affordable, attracting a wider range of industrial applications.


Restraints

  1. High Initial Investment
    Although the operating cost is low, the initial investment in optical gas imaging cameras can be expensive, limiting their adoption in small and medium enterprises with restricted budgets.

  2. Limited Awareness in Emerging Markets
    Many developing regions are still unaware of the benefits of OGI cameras, which slows down the market penetration and adoption in these regions.

  3. Technical Expertise Requirement
    The use of handheld OGI cameras requires trained personnel to operate and interpret results, posing challenges in industries where skilled labor is in short supply.


Opportunities

  1. Expansion in Emerging Markets
    The rising industrialization in regions such as Asia-Pacific and South America offers substantial growth opportunities for OGI camera manufacturers to tap into these untapped markets.

  2. Integration with IoT and Cloud Solutions
    Integrating handheld OGI cameras with IoT and cloud-based platforms could provide real-time monitoring and data analytics, opening new possibilities for predictive maintenance and leak detection.

  3. Development of Smaller, More Portable Devices
    There is an opportunity to innovate in creating compact and portable OGI cameras that are even more convenient for on-the-go leak detection in remote and hard-to-reach areas.


Challenges

  1. Cost of Advanced Features
    While the demand for advanced features like higher resolution and enhanced detection capabilities is growing, the associated cost of developing and manufacturing these high-end cameras remains a significant challenge.

  2. Regulatory Compliance Variability
    Different regions have varying environmental and safety regulations, making it challenging for OGI camera manufacturers to develop standardized solutions that comply with all regulations globally.

  3. Competition from Alternative Leak Detection Technologies
    The rise of competing technologies, such as ultrasonic and infrared gas detectors, may limit the widespread adoption of OGI cameras, particularly in industries where cost-effectiveness is a priority.

Key Benefits of This Market Research:

  • Industry drivers, restraints, and opportunities covered in the study
  • Neutral perspective on the market performance
  • Recent industry trends and developments
  • Competitive landscape & strategies of key players
  • Potential & niche segments and regions exhibiting promising growth covered
  • Historical, current, and projected market size, in terms of value
  • In-depth analysis of the Handheld Optical Gas Imaging (OGI) Camera Market
  • Overview of the regional outlook of the Handheld Optical Gas Imaging (OGI) Camera Market:

Key Reasons to Buy this Report:

  • Access to date statistics compiled by our researchers. These provide you with historical and forecast data, which is analyzed to tell you why your market is set to change
  • This enables you to anticipate market changes to remain ahead of your competitors
  • You will be able to copy data from the Excel spreadsheet straight into your marketing plans, business presentations, or other strategic documents
  • The concise analysis, clear graph, and table format will enable you to pinpoint the information you require quickly
  • Provision of market value data for each segment and sub-segment
  • Indicates the region and segment that is expected to witness the fastest growth as well as to dominate the market
  • Provides insight into the market through Value Chain
  • Market dynamics scenario, along with growth opportunities of the market in the years to come
  • 6-month post-sales analyst support

Customization of the Report
In case of any queries or customization requirements, please connect with our sales team, who will ensure that your requirements are met.


FAQs


Q: What are the key driving factors and opportunities in the Handheld Optical Gas Imaging (OGI) Camera market?
A: The main drivers include increasing demand for leak detection solutions, stricter environmental regulations, and technological advancements in camera sensitivity. Key opportunities lie in expanding into emerging markets, integrating with IoT, and developing smaller, portable devices.


Q: Which region is projected to have the largest market share in the Handheld Optical Gas Imaging (OGI) Camera market?
A: North America is projected to hold the largest market share, with a significant growth rate during the forecast period due to high industrial demand, especially in the oil and gas sector.


Q: Who are the top players in the global Handheld Optical Gas Imaging (OGI) Camera market?
A: Major players in the market include Opgal, Sensia, and FLIR Systems, which are leading in providing innovative and high-performance OGI cameras for various industries.


Q: What are the latest technological advancements in the Handheld Optical Gas Imaging (OGI) Camera industry?
A: Key advancements include improved infrared camera sensitivity, the integration of AI and machine learning for enhanced leak detection, and the development of uncooled OGI cameras that are more affordable and lightweight.


Q: What is the current size of the global Handheld Optical Gas Imaging (OGI) Camera market?
A: The global market size was estimated at USD 136 million in 2023 and is projected to reach USD 239.71 million by 2032, growing at a CAGR of 6.50% during the forecast period.

Global Handheld Optical Gas Imaging (OGI) Camera Market, Size, Trends, Business Strategies 2025-2032

Get Sample Report PDF for Exclusive Insights

Report Sample Includes

  • Table of Contents
  • List of Tables & Figures
  • Charts, Research Methodology, and more...
PDF Icon Download Sample Report PDF

Download Sample Report

Table of Content

Table of Contents
1 Research Methodology and Statistical Scope
1.1 Market Definition and Statistical Scope of Handheld Optical Gas Imaging (OGI) Camera
1.2 Key Market Segments
1.2.1 Handheld Optical Gas Imaging (OGI) Camera Segment by Type
1.2.2 Handheld Optical Gas Imaging (OGI) Camera Segment by Application
1.3 Methodology & Sources of Information
1.3.1 Research Methodology
1.3.2 Research Process
1.3.3 Market Breakdown and Data Triangulation
1.3.4 Base Year
1.3.5 Report Assumptions & Caveats
2 Handheld Optical Gas Imaging (OGI) Camera Market Overview
2.1 Global Market Overview
2.1.1 Global Handheld Optical Gas Imaging (OGI) Camera Market Size (M USD) Estimates and Forecasts (2019-2032)
2.1.2 Global Handheld Optical Gas Imaging (OGI) Camera Sales Estimates and Forecasts (2019-2032)
2.2 Market Segment Executive Summary
2.3 Global Market Size by Region
3 Handheld Optical Gas Imaging (OGI) Camera Market Competitive Landscape
3.1 Global Handheld Optical Gas Imaging (OGI) Camera Sales by Manufacturers (2019-2025)
3.2 Global Handheld Optical Gas Imaging (OGI) Camera Revenue Market Share by Manufacturers (2019-2025)
3.3 Handheld Optical Gas Imaging (OGI) Camera Market Share by Company Type (Tier 1, Tier 2, and Tier 3)
3.4 Global Handheld Optical Gas Imaging (OGI) Camera Average Price by Manufacturers (2019-2025)
3.5 Manufacturers Handheld Optical Gas Imaging (OGI) Camera Sales Sites, Area Served, Product Type
3.6 Handheld Optical Gas Imaging (OGI) Camera Market Competitive Situation and Trends
3.6.1 Handheld Optical Gas Imaging (OGI) Camera Market Concentration Rate
3.6.2 Global 5 and 10 Largest Handheld Optical Gas Imaging (OGI) Camera Players Market Share by Revenue
3.6.3 Mergers & Acquisitions, Expansion
4 Handheld Optical Gas Imaging (OGI) Camera Industry Chain Analysis
4.1 Handheld Optical Gas Imaging (OGI) Camera Industry Chain Analysis
4.2 Market Overview of Key Raw Materials
4.3 Midstream Market Analysis
4.4 Downstream Customer Analysis
5 The Development and Dynamics of Handheld Optical Gas Imaging (OGI) Camera Market
5.1 Key Development Trends
5.2 Driving Factors
5.3 Market Challenges
5.4 Market Restraints
5.5 Industry News
5.5.1 New Product Developments
5.5.2 Mergers & Acquisitions
5.5.3 Expansions
5.5.4 Collaboration/Supply Contracts
5.6 Industry Policies
6 Handheld Optical Gas Imaging (OGI) Camera Market Segmentation by Type
6.1 Evaluation Matrix of Segment Market Development Potential (Type)
6.2 Global Handheld Optical Gas Imaging (OGI) Camera Sales Market Share by Type (2019-2025)
6.3 Global Handheld Optical Gas Imaging (OGI) Camera Market Size Market Share by Type (2019-2025)
6.4 Global Handheld Optical Gas Imaging (OGI) Camera Price by Type (2019-2025)
7 Handheld Optical Gas Imaging (OGI) Camera Market Segmentation by Application
7.1 Evaluation Matrix of Segment Market Development Potential (Application)
7.2 Global Handheld Optical Gas Imaging (OGI) Camera Market Sales by Application (2019-2025)
7.3 Global Handheld Optical Gas Imaging (OGI) Camera Market Size (M USD) by Application (2019-2025)
7.4 Global Handheld Optical Gas Imaging (OGI) Camera Sales Growth Rate by Application (2019-2025)
8 Handheld Optical Gas Imaging (OGI) Camera Market Consumption by Region
8.1 Global Handheld Optical Gas Imaging (OGI) Camera Sales by Region
8.1.1 Global Handheld Optical Gas Imaging (OGI) Camera Sales by Region
8.1.2 Global Handheld Optical Gas Imaging (OGI) Camera Sales Market Share by Region
8.2 North America
8.2.1 North America Handheld Optical Gas Imaging (OGI) Camera Sales by Country
8.2.2 U.S.
8.2.3 Canada
8.2.4 Mexico
8.3 Europe
8.3.1 Europe Handheld Optical Gas Imaging (OGI) Camera Sales by Country
8.3.2 Germany
8.3.3 France
8.3.4 U.K.
8.3.5 Italy
8.3.6 Russia
8.4 Asia Pacific
8.4.1 Asia Pacific Handheld Optical Gas Imaging (OGI) Camera Sales by Region
8.4.2 China
8.4.3 Japan
8.4.4 South Korea
8.4.5 India
8.4.6 Southeast Asia
8.5 South America
8.5.1 South America Handheld Optical Gas Imaging (OGI) Camera Sales by Country
8.5.2 Brazil
8.5.3 Argentina
8.5.4 Columbia
8.6 Middle East and Africa
8.6.1 Middle East and Africa Handheld Optical Gas Imaging (OGI) Camera Sales by Region
8.6.2 Saudi Arabia
8.6.3 UAE
8.6.4 Egypt
8.6.5 Nigeria
8.6.6 South Africa
9 Handheld Optical Gas Imaging (OGI) Camera Market Production by Region
9.1 Global Production of Handheld Optical Gas Imaging (OGI) Camera by Region (2019-2025)
9.2 Global Handheld Optical Gas Imaging (OGI) Camera Revenue Market Share by Region (2019-2025)
9.3 Global Handheld Optical Gas Imaging (OGI) Camera Production, Revenue, Price and Gross Margin (2019-2025)
9.4 North America Handheld Optical Gas Imaging (OGI) Camera Production
9.4.1 North America Handheld Optical Gas Imaging (OGI) Camera Production Growth Rate (2019-2025)
9.4.2 North America Handheld Optical Gas Imaging (OGI) Camera Production, Revenue, Price and Gross Margin (2019-2025)
9.5 Europe Handheld Optical Gas Imaging (OGI) Camera Production
9.5.1 Europe Handheld Optical Gas Imaging (OGI) Camera Production Growth Rate (2019-2025)
9.5.2 Europe Handheld Optical Gas Imaging (OGI) Camera Production, Revenue, Price and Gross Margin (2019-2025)
9.6 Japan Handheld Optical Gas Imaging (OGI) Camera Production (2019-2025)
9.6.1 Japan Handheld Optical Gas Imaging (OGI) Camera Production Growth Rate (2019-2025)
9.6.2 Japan Handheld Optical Gas Imaging (OGI) Camera Production, Revenue, Price and Gross Margin (2019-2025)
9.7 China Handheld Optical Gas Imaging (OGI) Camera Production (2019-2025)
9.7.1 China Handheld Optical Gas Imaging (OGI) Camera Production Growth Rate (2019-2025)
9.7.2 China Handheld Optical Gas Imaging (OGI) Camera Production, Revenue, Price and Gross Margin (2019-2025)
10 Key Companies Profile
10.1 Opgal
10.1.1 Opgal Handheld Optical Gas Imaging (OGI) Camera Basic Information
10.1.2 Opgal Handheld Optical Gas Imaging (OGI) Camera Product Overview
10.1.3 Opgal Handheld Optical Gas Imaging (OGI) Camera Product Market Performance
10.1.4 Opgal Business Overview
10.1.5 Opgal Handheld Optical Gas Imaging (OGI) Camera SWOT Analysis
10.1.6 Opgal Recent Developments
10.2 Sensia
10.2.1 Sensia Handheld Optical Gas Imaging (OGI) Camera Basic Information
10.2.2 Sensia Handheld Optical Gas Imaging (OGI) Camera Product Overview
10.2.3 Sensia Handheld Optical Gas Imaging (OGI) Camera Product Market Performance
10.2.4 Sensia Business Overview
10.2.5 Sensia Handheld Optical Gas Imaging (OGI) Camera SWOT Analysis
10.2.6 Sensia Recent Developments
10.3 FLIR Systems
10.3.1 FLIR Systems Handheld Optical Gas Imaging (OGI) Camera Basic Information
10.3.2 FLIR Systems Handheld Optical Gas Imaging (OGI) Camera Product Overview
10.3.3 FLIR Systems Handheld Optical Gas Imaging (OGI) Camera Product Market Performance
10.3.4 FLIR Systems Handheld Optical Gas Imaging (OGI) Camera SWOT Analysis
10.3.5 FLIR Systems Business Overview
10.3.6 FLIR Systems Recent Developments
11 Handheld Optical Gas Imaging (OGI) Camera Market Forecast by Region
11.1 Global Handheld Optical Gas Imaging (OGI) Camera Market Size Forecast
11.2 Global Handheld Optical Gas Imaging (OGI) Camera Market Forecast by Region
11.2.1 North America Market Size Forecast by Country
11.2.2 Europe Handheld Optical Gas Imaging (OGI) Camera Market Size Forecast by Country
11.2.3 Asia Pacific Handheld Optical Gas Imaging (OGI) Camera Market Size Forecast by Region
11.2.4 South America Handheld Optical Gas Imaging (OGI) Camera Market Size Forecast by Country
11.2.5 Middle East and Africa Forecasted Consumption of Handheld Optical Gas Imaging (OGI) Camera by Country
12 Forecast Market by Type and by Application (2025-2032)
12.1 Global Handheld Optical Gas Imaging (OGI) Camera Market Forecast by Type (2025-2032)
12.1.1 Global Forecasted Sales of Handheld Optical Gas Imaging (OGI) Camera by Type (2025-2032)
12.1.2 Global Handheld Optical Gas Imaging (OGI) Camera Market Size Forecast by Type (2025-2032)
12.1.3 Global Forecasted Price of Handheld Optical Gas Imaging (OGI) Camera by Type (2025-2032)
12.2 Global Handheld Optical Gas Imaging (OGI) Camera Market Forecast by Application (2025-2032)
12.2.1 Global Handheld Optical Gas Imaging (OGI) Camera Sales (K Units) Forecast by Application
12.2.2 Global Handheld Optical Gas Imaging (OGI) Camera Market Size (M USD) Forecast by Application (2025-2032)
13 Conclusion and Key FindingsList of Tables
Table 1. Introduction of the Type
Table 2. Introduction of the Application
Table 3. Market Size (M USD) Segment Executive Summary
Table 4. Handheld Optical Gas Imaging (OGI) Camera Market Size Comparison by Region (M USD)
Table 5. Global Handheld Optical Gas Imaging (OGI) Camera Sales (K Units) by Manufacturers (2019-2025)
Table 6. Global Handheld Optical Gas Imaging (OGI) Camera Sales Market Share by Manufacturers (2019-2025)
Table 7. Global Handheld Optical Gas Imaging (OGI) Camera Revenue (M USD) by Manufacturers (2019-2025)
Table 8. Global Handheld Optical Gas Imaging (OGI) Camera Revenue Share by Manufacturers (2019-2025)
Table 9. Company Type (Tier 1, Tier 2, and Tier 3) & (based on the Revenue in Handheld Optical Gas Imaging (OGI) Camera as of 2022)
Table 10. Global Market Handheld Optical Gas Imaging (OGI) Camera Average Price (USD/Unit) of Key Manufacturers (2019-2025)
Table 11. Manufacturers Handheld Optical Gas Imaging (OGI) Camera Sales Sites and Area Served
Table 12. Manufacturers Handheld Optical Gas Imaging (OGI) Camera Product Type
Table 13. Global Handheld Optical Gas Imaging (OGI) Camera Manufacturers Market Concentration Ratio (CR5 and HHI)
Table 14. Mergers & Acquisitions, Expansion Plans
Table 15. Industry Chain Map of Handheld Optical Gas Imaging (OGI) Camera
Table 16. Market Overview of Key Raw Materials
Table 17. Midstream Market Analysis
Table 18. Downstream Customer Analysis
Table 19. Key Development Trends
Table 20. Driving Factors
Table 21. Handheld Optical Gas Imaging (OGI) Camera Market Challenges
Table 22. Global Handheld Optical Gas Imaging (OGI) Camera Sales by Type (K Units)
Table 23. Global Handheld Optical Gas Imaging (OGI) Camera Market Size by Type (M USD)
Table 24. Global Handheld Optical Gas Imaging (OGI) Camera Sales (K Units) by Type (2019-2025)
Table 25. Global Handheld Optical Gas Imaging (OGI) Camera Sales Market Share by Type (2019-2025)
Table 26. Global Handheld Optical Gas Imaging (OGI) Camera Market Size (M USD) by Type (2019-2025)
Table 27. Global Handheld Optical Gas Imaging (OGI) Camera Market Size Share by Type (2019-2025)
Table 28. Global Handheld Optical Gas Imaging (OGI) Camera Price (USD/Unit) by Type (2019-2025)
Table 29. Global Handheld Optical Gas Imaging (OGI) Camera Sales (K Units) by Application
Table 30. Global Handheld Optical Gas Imaging (OGI) Camera Market Size by Application
Table 31. Global Handheld Optical Gas Imaging (OGI) Camera Sales by Application (2019-2025) & (K Units)
Table 32. Global Handheld Optical Gas Imaging (OGI) Camera Sales Market Share by Application (2019-2025)
Table 33. Global Handheld Optical Gas Imaging (OGI) Camera Sales by Application (2019-2025) & (M USD)
Table 34. Global Handheld Optical Gas Imaging (OGI) Camera Market Share by Application (2019-2025)
Table 35. Global Handheld Optical Gas Imaging (OGI) Camera Sales Growth Rate by Application (2019-2025)
Table 36. Global Handheld Optical Gas Imaging (OGI) Camera Sales by Region (2019-2025) & (K Units)
Table 37. Global Handheld Optical Gas Imaging (OGI) Camera Sales Market Share by Region (2019-2025)
Table 38. North America Handheld Optical Gas Imaging (OGI) Camera Sales by Country (2019-2025) & (K Units)
Table 39. Europe Handheld Optical Gas Imaging (OGI) Camera Sales by Country (2019-2025) & (K Units)
Table 40. Asia Pacific Handheld Optical Gas Imaging (OGI) Camera Sales by Region (2019-2025) & (K Units)
Table 41. South America Handheld Optical Gas Imaging (OGI) Camera Sales by Country (2019-2025) & (K Units)
Table 42. Middle East and Africa Handheld Optical Gas Imaging (OGI) Camera Sales by Region (2019-2025) & (K Units)
Table 43. Global Handheld Optical Gas Imaging (OGI) Camera Production (K Units) by Region (2019-2025)
Table 44. Global Handheld Optical Gas Imaging (OGI) Camera Revenue (US$ Million) by Region (2019-2025)
Table 45. Global Handheld Optical Gas Imaging (OGI) Camera Revenue Market Share by Region (2019-2025)
Table 46. Global Handheld Optical Gas Imaging (OGI) Camera Production (K Units), Revenue (US$ Million), Price (USD/Unit) and Gross Margin (2019-2025)
Table 47. North America Handheld Optical Gas Imaging (OGI) Camera Production (K Units), Revenue (US$ Million), Price (USD/Unit) and Gross Margin (2019-2025)
Table 48. Europe Handheld Optical Gas Imaging (OGI) Camera Production (K Units), Revenue (US$ Million), Price (USD/Unit) and Gross Margin (2019-2025)
Table 49. Japan Handheld Optical Gas Imaging (OGI) Camera Production (K Units), Revenue (US$ Million), Price (USD/Unit) and Gross Margin (2019-2025)
Table 50. China Handheld Optical Gas Imaging (OGI) Camera Production (K Units), Revenue (US$ Million), Price (USD/Unit) and Gross Margin (2019-2025)
Table 51. Opgal Handheld Optical Gas Imaging (OGI) Camera Basic Information
Table 52. Opgal Handheld Optical Gas Imaging (OGI) Camera Product Overview
Table 53. Opgal Handheld Optical Gas Imaging (OGI) Camera Sales (K Units), Revenue (M USD), Price (USD/Unit) and Gross Margin (2019-2025)
Table 54. Opgal Business Overview
Table 55. Opgal Handheld Optical Gas Imaging (OGI) Camera SWOT Analysis
Table 56. Opgal Recent Developments
Table 57. Sensia Handheld Optical Gas Imaging (OGI) Camera Basic Information
Table 58. Sensia Handheld Optical Gas Imaging (OGI) Camera Product Overview
Table 59. Sensia Handheld Optical Gas Imaging (OGI) Camera Sales (K Units), Revenue (M USD), Price (USD/Unit) and Gross Margin (2019-2025)
Table 60. Sensia Business Overview
Table 61. Sensia Handheld Optical Gas Imaging (OGI) Camera SWOT Analysis
Table 62. Sensia Recent Developments
Table 63. FLIR Systems Handheld Optical Gas Imaging (OGI) Camera Basic Information
Table 64. FLIR Systems Handheld Optical Gas Imaging (OGI) Camera Product Overview
Table 65. FLIR Systems Handheld Optical Gas Imaging (OGI) Camera Sales (K Units), Revenue (M USD), Price (USD/Unit) and Gross Margin (2019-2025)
Table 66. FLIR Systems Handheld Optical Gas Imaging (OGI) Camera SWOT Analysis
Table 67. FLIR Systems Business Overview
Table 68. FLIR Systems Recent Developments
Table 69. Global Handheld Optical Gas Imaging (OGI) Camera Sales Forecast by Region (2025-2032) & (K Units)
Table 70. Global Handheld Optical Gas Imaging (OGI) Camera Market Size Forecast by Region (2025-2032) & (M USD)
Table 71. North America Handheld Optical Gas Imaging (OGI) Camera Sales Forecast by Country (2025-2032) & (K Units)
Table 72. North America Handheld Optical Gas Imaging (OGI) Camera Market Size Forecast by Country (2025-2032) & (M USD)
Table 73. Europe Handheld Optical Gas Imaging (OGI) Camera Sales Forecast by Country (2025-2032) & (K Units)
Table 74. Europe Handheld Optical Gas Imaging (OGI) Camera Market Size Forecast by Country (2025-2032) & (M USD)
Table 75. Asia Pacific Handheld Optical Gas Imaging (OGI) Camera Sales Forecast by Region (2025-2032) & (K Units)
Table 76. Asia Pacific Handheld Optical Gas Imaging (OGI) Camera Market Size Forecast by Region (2025-2032) & (M USD)
Table 77. South America Handheld Optical Gas Imaging (OGI) Camera Sales Forecast by Country (2025-2032) & (K Units)
Table 78. South America Handheld Optical Gas Imaging (OGI) Camera Market Size Forecast by Country (2025-2032) & (M USD)
Table 79. Middle East and Africa Handheld Optical Gas Imaging (OGI) Camera Consumption Forecast by Country (2025-2032) & (Units)
Table 80. Middle East and Africa Handheld Optical Gas Imaging (OGI) Camera Market Size Forecast by Country (2025-2032) & (M USD)
Table 81. Global Handheld Optical Gas Imaging (OGI) Camera Sales Forecast by Type (2025-2032) & (K Units)
Table 82. Global Handheld Optical Gas Imaging (OGI) Camera Market Size Forecast by Type (2025-2032) & (M USD)
Table 83. Global Handheld Optical Gas Imaging (OGI) Camera Price Forecast by Type (2025-2032) & (USD/Unit)
Table 84. Global Handheld Optical Gas Imaging (OGI) Camera Sales (K Units) Forecast by Application (2025-2032)
Table 85. Global Handheld Optical Gas Imaging (OGI) Camera Market Size Forecast by Application (2025-2032) & (M USD)
List of Figures
Figure 1. Product Picture of Handheld Optical Gas Imaging (OGI) Camera
Figure 2. Data Triangulation
Figure 3. Key Caveats
Figure 4. Global Handheld Optical Gas Imaging (OGI) Camera Market Size (M USD), 2019-2032
Figure 5. Global Handheld Optical Gas Imaging (OGI) Camera Market Size (M USD) (2019-2032)
Figure 6. Global Handheld Optical Gas Imaging (OGI) Camera Sales (K Units) & (2019-2032)
Figure 7. Evaluation Matrix of Segment Market Development Potential (Type)
Figure 8. Evaluation Matrix of Segment Market Development Potential (Application)
Figure 9. Evaluation Matrix of Regional Market Development Potential
Figure 10. Handheld Optical Gas Imaging (OGI) Camera Market Size by Country (M USD)
Figure 11. Handheld Optical Gas Imaging (OGI) Camera Sales Share by Manufacturers in 2023
Figure 12. Global Handheld Optical Gas Imaging (OGI) Camera Revenue Share by Manufacturers in 2023
Figure 13. Handheld Optical Gas Imaging (OGI) Camera Market Share by Company Type (Tier 1, Tier 2 and Tier 3): 2023
Figure 14. Global Market Handheld Optical Gas Imaging (OGI) Camera Average Price (USD/Unit) of Key Manufacturers in 2023
Figure 15. The Global 5 and 10 Largest Players: Market Share by Handheld Optical Gas Imaging (OGI) Camera Revenue in 2023
Figure 16. Evaluation Matrix of Segment Market Development Potential (Type)
Figure 17. Global Handheld Optical Gas Imaging (OGI) Camera Market Share by Type
Figure 18. Sales Market Share of Handheld Optical Gas Imaging (OGI) Camera by Type (2019-2025)
Figure 19. Sales Market Share of Handheld Optical Gas Imaging (OGI) Camera by Type in 2023
Figure 20. Market Size Share of Handheld Optical Gas Imaging (OGI) Camera by Type (2019-2025)
Figure 21. Market Size Market Share of Handheld Optical Gas Imaging (OGI) Camera by Type in 2023
Figure 22. Evaluation Matrix of Segment Market Development Potential (Application)
Figure 23. Global Handheld Optical Gas Imaging (OGI) Camera Market Share by Application
Figure 24. Global Handheld Optical Gas Imaging (OGI) Camera Sales Market Share by Application (2019-2025)
Figure 25. Global Handheld Optical Gas Imaging (OGI) Camera Sales Market Share by Application in 2023
Figure 26. Global Handheld Optical Gas Imaging (OGI) Camera Market Share by Application (2019-2025)
Figure 27. Global Handheld Optical Gas Imaging (OGI) Camera Market Share by Application in 2023
Figure 28. Global Handheld Optical Gas Imaging (OGI) Camera Sales Growth Rate by Application (2019-2025)
Figure 29. Global Handheld Optical Gas Imaging (OGI) Camera Sales Market Share by Region (2019-2025)
Figure 30. North America Handheld Optical Gas Imaging (OGI) Camera Sales and Growth Rate (2019-2025) & (K Units)
Figure 31. North America Handheld Optical Gas Imaging (OGI) Camera Sales Market Share by Country in 2023
Figure 32. U.S. Handheld Optical Gas Imaging (OGI) Camera Sales and Growth Rate (2019-2025) & (K Units)
Figure 33. Canada Handheld Optical Gas Imaging (OGI) Camera Sales (K Units) and Growth Rate (2019-2025)
Figure 34. Mexico Handheld Optical Gas Imaging (OGI) Camera Sales (Units) and Growth Rate (2019-2025)
Figure 35. Europe Handheld Optical Gas Imaging (OGI) Camera Sales and Growth Rate (2019-2025) & (K Units)
Figure 36. Europe Handheld Optical Gas Imaging (OGI) Camera Sales Market Share by Country in 2023
Figure 37. Germany Handheld Optical Gas Imaging (OGI) Camera Sales and Growth Rate (2019-2025) & (K Units)
Figure 38. France Handheld Optical Gas Imaging (OGI) Camera Sales and Growth Rate (2019-2025) & (K Units)
Figure 39. U.K. Handheld Optical Gas Imaging (OGI) Camera Sales and Growth Rate (2019-2025) & (K Units)
Figure 40. Italy Handheld Optical Gas Imaging (OGI) Camera Sales and Growth Rate (2019-2025) & (K Units)
Figure 41. Russia Handheld Optical Gas Imaging (OGI) Camera Sales and Growth Rate (2019-2025) & (K Units)
Figure 42. Asia Pacific Handheld Optical Gas Imaging (OGI) Camera Sales and Growth Rate (K Units)
Figure 43. Asia Pacific Handheld Optical Gas Imaging (OGI) Camera Sales Market Share by Region in 2023
Figure 44. China Handheld Optical Gas Imaging (OGI) Camera Sales and Growth Rate (2019-2025) & (K Units)
Figure 45. Japan Handheld Optical Gas Imaging (OGI) Camera Sales and Growth Rate (2019-2025) & (K Units)
Figure 46. South Korea Handheld Optical Gas Imaging (OGI) Camera Sales and Growth Rate (2019-2025) & (K Units)
Figure 47. India Handheld Optical Gas Imaging (OGI) Camera Sales and Growth Rate (2019-2025) & (K Units)
Figure 48. Southeast Asia Handheld Optical Gas Imaging (OGI) Camera Sales and Growth Rate (2019-2025) & (K Units)
Figure 49. South America Handheld Optical Gas Imaging (OGI) Camera Sales and Growth Rate (K Units)
Figure 50. South America Handheld Optical Gas Imaging (OGI) Camera Sales Market Share by Country in 2023
Figure 51. Brazil Handheld Optical Gas Imaging (OGI) Camera Sales and Growth Rate (2019-2025) & (K Units)
Figure 52. Argentina Handheld Optical Gas Imaging (OGI) Camera Sales and Growth Rate (2019-2025) & (K Units)
Figure 53. Columbia Handheld Optical Gas Imaging (OGI) Camera Sales and Growth Rate (2019-2025) & (K Units)
Figure 54. Middle East and Africa Handheld Optical Gas Imaging (OGI) Camera Sales and Growth Rate (K Units)
Figure 55. Middle East and Africa Handheld Optical Gas Imaging (OGI) Camera Sales Market Share by Region in 2023
Figure 56. Saudi Arabia Handheld Optical Gas Imaging (OGI) Camera Sales and Growth Rate (2019-2025) & (K Units)
Figure 57. UAE Handheld Optical Gas Imaging (OGI) Camera Sales and Growth Rate (2019-2025) & (K Units)
Figure 58. Egypt Handheld Optical Gas Imaging (OGI) Camera Sales and Growth Rate (2019-2025) & (K Units)
Figure 59. Nigeria Handheld Optical Gas Imaging (OGI) Camera Sales and Growth Rate (2019-2025) & (K Units)
Figure 60. South Africa Handheld Optical Gas Imaging (OGI) Camera Sales and Growth Rate (2019-2025) & (K Units)
Figure 61. Global Handheld Optical Gas Imaging (OGI) Camera Production Market Share by Region (2019-2025)
Figure 62. North America Handheld Optical Gas Imaging (OGI) Camera Production (K Units) Growth Rate (2019-2025)
Figure 63. Europe Handheld Optical Gas Imaging (OGI) Camera Production (K Units) Growth Rate (2019-2025)
Figure 64. Japan Handheld Optical Gas Imaging (OGI) Camera Production (K Units) Growth Rate (2019-2025)
Figure 65. China Handheld Optical Gas Imaging (OGI) Camera Production (K Units) Growth Rate (2019-2025)
Figure 66. Global Handheld Optical Gas Imaging (OGI) Camera Sales Forecast by Volume (2019-2032) & (K Units)
Figure 67. Global Handheld Optical Gas Imaging (OGI) Camera Market Size Forecast by Value (2019-2032) & (M USD)
Figure 68. Global Handheld Optical Gas Imaging (OGI) Camera Sales Market Share Forecast by Type (2025-2032)
Figure 69. Global Handheld Optical Gas Imaging (OGI) Camera Market Share Forecast by Type (2025-2032)
Figure 70. Global Handheld Optical Gas Imaging (OGI) Camera Sales Forecast by Application (2025-2032)
Figure 71. Global Handheld Optical Gas Imaging (OGI) Camera Market Share Forecast by Application (2025-2032)