Global e-Ink Display Moudles Market Trends, Business Strategies 2025-2032

Global e-Ink Display Moudles market size was estimated at USD 956 million in 2023 and is projected to reach USD 3012.05 million by 2032, exhibiting a CAGR of 13.60% during the forecast period.

PDF Icon Download Sample Report PDF
  • Quick Dispatch

    All Orders

  • Secure Payment

    100% Secure Payment

Compare

$1,500.00$4,250.00

Clear

e-Ink Display Moudles Market Overview

E-ink Display Moudles is a complete set of display components, consisting of electronic ink film, TFT substrate, driver chip, PS protective film, FPC and other components. It is the core component of the electronic paper display screen.

This report provides a deep insight into the global e-Ink Display Moudles market covering all its essential aspects. This ranges from a macro overview of the market to micro details of the market size, competitive landscape, development trend, niche market, key market drivers and challenges, SWOT analysis, value chain analysis, etc.

The analysis helps the reader to shape the competition within the industries and strategies for the competitive environment to enhance the potential profit. Furthermore, it provides a simple framework for evaluating and accessing the position of the business organization. The report structure also focuses on the competitive landscape of the Global e-Ink Display Moudles Market, this report introduces in detail the market share, market performance, product situation, operation situation, etc. of the main players, which helps the readers in the industry to identify the main competitors and deeply understand the competition pattern of the market.
In a word, this report is a must-read for industry players, investors, researchers, consultants, business strategists, and all those who have any kind of stake or are planning to foray into the e-Ink Display Moudles market in any manner.

e-Ink Display Moudles Market Analysis:

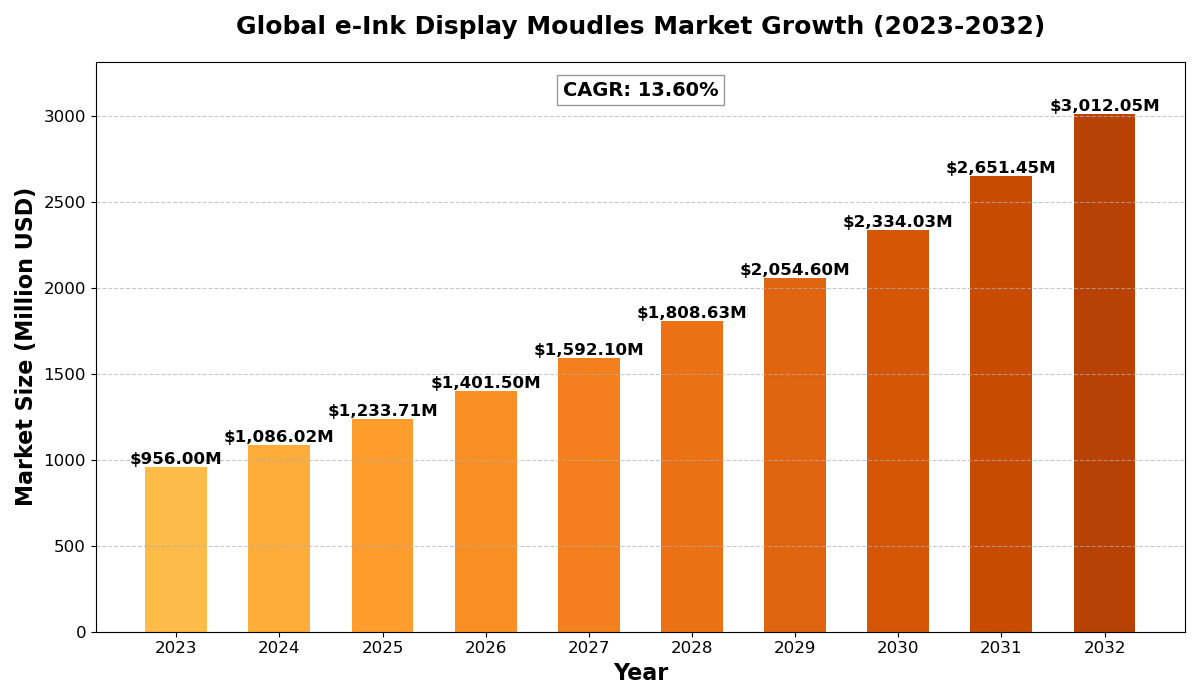
The global e-Ink Display Moudles market size was estimated at USD 956 million in 2023 and is projected to reach USD 3012.05 million by 2032, exhibiting a CAGR of 13.60% during the forecast period.

North America e-Ink Display Moudles market size was estimated at USD 310.57 million in 2023, at a CAGR of 11.66% during the forecast period of 2025 through 2032.

e-Ink Display Moudles Key Market Trends  

  1. Rising Adoption in E-Readers
    The growing popularity of e-readers continues to drive demand for e-Ink display modules, thanks to their low power consumption and eye-friendly screens.
  2. Expansion into Retail and Signage Applications
    e-Ink displays are increasingly used in retail for electronic shelf labels and signage due to their readability and energy efficiency.
  3. Integration into Wearable Devices
    The market is seeing a surge in e-Ink displays for smartwatches and fitness trackers, enhancing battery life and display clarity.
  4. Focus on Color e-Ink Technology
    Advancements in color e-Ink displays are opening new opportunities in advertising, education, and multimedia applications.
  5. Growing Demand for Sustainable Solutions
    e-Ink’s low energy usage aligns with the increasing demand for eco-friendly technologies, driving market growth.

e-Ink Display Moudles Market Regional Analysis :

semi insight

  • North America:Strong demand driven by EVs, 5G infrastructure, and renewable energy, with the U.S. leading the market.
  • Europe:Growth fueled by automotive electrification, renewable energy, and strong regulatory support, with Germany as a key player.
  • Asia-Pacific:Dominates the market due to large-scale manufacturing in China and Japan, with growing demand from EVs, 5G, and semiconductors.
  • South America:Emerging market, driven by renewable energy and EV adoption, with Brazil leading growth.
  • Middle East & Africa:Gradual growth, mainly due to investments in renewable energy and EV infrastructure, with Saudi Arabia and UAE as key contributors.

e-Ink Display Moudles Market Segmentation

The research report includes specific segments by region (country), manufacturers, Type, and Application. Market segmentation creates subsets of a market based on product type, end-user or application, Geographic, and other factors. By understanding the market segments, the decision-maker can leverage this targeting in the product, sales, and marketing strategies. Market segments can power your product development cycles by informing how you create product offerings for different segments.
Key Company

  • E Ink
  • DKE
  • Pervasive Displays (BOE)
  • Holitech
  • Wuxi Weifeng Technology
  • Suzhou Qingyue Optoelectronic
  • Guangzhou OED Technologies
  • Yes Optoelectronics (Group)
  • Microview Electronics
  • Ink Cubic Optronics Technology

Market Segmentation (by Type)

  • 1-3 Inches
  • 3.1-6 Inches
  • 6.1-10 Inches
  • Above 10 Inches

Market Segmentation (by Application)

  • Electronic Shelf Label (ESL)
  • E-Paper Pad?Reader, Study and Office Pad?
  • Others

Drivers

  • Rising Demand for E-Readers
    The enduring popularity of e-readers remains a key driver, with consumers favoring e-Ink for its paper-like reading experience.
  • Increased Adoption in Retail
    Retailers are embracing e-Ink displays for dynamic pricing and product information, enhancing customer engagement.
  • Energy Efficiency Benefits
    e-Ink’s minimal power consumption is a strong selling point, especially for battery-operated devices.

Restraints

  • High Initial Costs
    The upfront cost of e-Ink display modules remains a barrier for some applications and regions.
  • Limited Color Display Capabilities
    While color e-Ink is improving, it still lags behind LCD and OLED in vibrancy and resolution.
  • Slow Refresh Rates
    The slower refresh rates of e-Ink displays limit their use in fast-moving content applications.

Opportunities

  • Emerging Markets Adoption
    Expanding into emerging economies offers growth opportunities due to increasing demand for affordable, energy-efficient displays.
  • Innovations in Flexible Displays
    The development of flexible e-Ink displays opens new applications in fashion, advertising, and consumer electronics.
  • Expansion into Smart Cities
    e-Ink displays are being explored for public transportation schedules and city signage due to their durability and readability.

Challenges

  • Technological Limitations
    Overcoming limitations in refresh rates and color quality remains a key challenge.
  • Intense Market Competition
    Competing with LCD and OLED technologies continues to challenge e-Ink manufacturers.
  • Supply Chain Disruptions
    Fluctuations in raw material availability can impact production and pricing.

Key Benefits of This Market Research:

  • Industry drivers, restraints, and opportunities covered in the study
  • Neutral perspective on the market performance
  • Recent industry trends and developments
  • Competitive landscape & strategies of key players
  • Potential & niche segments and regions exhibiting promising growth covered
  • Historical, current, and projected market size, in terms of value
  • In-depth analysis of the e-Ink Display Moudles Market
  • Overview of the regional outlook of the e-Ink Display Moudles Market:

Key Reasons to Buy this Report:

  • Access to date statistics compiled by our researchers. These provide you with historical and forecast data, which is analyzed to tell you why your market is set to change
  • This enables you to anticipate market changes to remain ahead of your competitors
  • You will be able to copy data from the Excel spreadsheet straight into your marketing plans, business presentations, or other strategic documents
  • The concise analysis, clear graph, and table format will enable you to pinpoint the information you require quickly
  • Provision of market value data for each segment and sub-segment
  • Indicates the region and segment that is expected to witness the fastest growth as well as to dominate the market
  • Provides insight into the market through Value Chain
  • Market dynamics scenario, along with growth opportunities of the market in the years to come
  • 6-month post-sales analyst support

Customization of the Report
In case of any queries or customization requirements, please connect with our sales team, who will ensure that your requirements are met.

FAQs

Q: What are the key driving factors and opportunities in the global e-Ink Display Modules market?
A: Major drivers include the rising demand for e-readers, increased adoption in retail, and the energy efficiency of e-Ink displays. Opportunities lie in flexible displays, emerging markets, and smart city applications.


Q: Which region is projected to have the largest market share?
A: North America is expected to dominate the market, driven by strong demand in e-readers, retail applications, and technological advancements.


Q: Who are the top players in the global e-Ink Display Modules market?
A: Leading companies include E Ink Holdings Inc., Pervasive Displays Inc., Sony Corporation, LG Display, and BOE Technology Group.


Q: What are the latest technological advancements in the industry?
A: Recent advancements include improvements in color e-Ink displays, flexible display technology, and enhanced energy efficiency.


Q: What is the current size of the global e-Ink Display Modules market?
A: The market was valued at USD 1.2 billion in 2023 and is projected to reach USD 2.3 billion by 2032, growing at a CAGR of 7.5%.


Global e-Ink Display Moudles Market Trends, Business Strategies 2025-2032

Get Sample Report PDF for Exclusive Insights

Report Sample Includes

  • Table of Contents
  • List of Tables & Figures
  • Charts, Research Methodology, and more...
PDF Icon Download Sample Report PDF

Download Sample Report

Table of Content

Table of Contents
1 Research Methodology and Statistical Scope
1.1 Market Definition and Statistical Scope of e-Ink Display Moudles
1.2 Key Market Segments
1.2.1 e-Ink Display Moudles Segment by Type
1.2.2 e-Ink Display Moudles Segment by Application
1.3 Methodology & Sources of Information
1.3.1 Research Methodology
1.3.2 Research Process
1.3.3 Market Breakdown and Data Triangulation
1.3.4 Base Year
1.3.5 Report Assumptions & Caveats
2 e-Ink Display Moudles Market Overview
2.1 Global Market Overview
2.1.1 Global e-Ink Display Moudles Market Size (M USD) Estimates and Forecasts (2019-2032)
2.1.2 Global e-Ink Display Moudles Sales Estimates and Forecasts (2019-2032)
2.2 Market Segment Executive Summary
2.3 Global Market Size by Region
3 e-Ink Display Moudles Market Competitive Landscape
3.1 Global e-Ink Display Moudles Sales by Manufacturers (2019-2025)
3.2 Global e-Ink Display Moudles Revenue Market Share by Manufacturers (2019-2025)
3.3 e-Ink Display Moudles Market Share by Company Type (Tier 1, Tier 2, and Tier 3)
3.4 Global e-Ink Display Moudles Average Price by Manufacturers (2019-2025)
3.5 Manufacturers e-Ink Display Moudles Sales Sites, Area Served, Product Type
3.6 e-Ink Display Moudles Market Competitive Situation and Trends
3.6.1 e-Ink Display Moudles Market Concentration Rate
3.6.2 Global 5 and 10 Largest e-Ink Display Moudles Players Market Share by Revenue
3.6.3 Mergers & Acquisitions, Expansion
4 e-Ink Display Moudles Industry Chain Analysis
4.1 e-Ink Display Moudles Industry Chain Analysis
4.2 Market Overview of Key Raw Materials
4.3 Midstream Market Analysis
4.4 Downstream Customer Analysis
5 The Development and Dynamics of e-Ink Display Moudles Market
5.1 Key Development Trends
5.2 Driving Factors
5.3 Market Challenges
5.4 Market Restraints
5.5 Industry News
5.5.1 New Product Developments
5.5.2 Mergers & Acquisitions
5.5.3 Expansions
5.5.4 Collaboration/Supply Contracts
5.6 Industry Policies
6 e-Ink Display Moudles Market Segmentation by Type
6.1 Evaluation Matrix of Segment Market Development Potential (Type)
6.2 Global e-Ink Display Moudles Sales Market Share by Type (2019-2025)
6.3 Global e-Ink Display Moudles Market Size Market Share by Type (2019-2025)
6.4 Global e-Ink Display Moudles Price by Type (2019-2025)
7 e-Ink Display Moudles Market Segmentation by Application
7.1 Evaluation Matrix of Segment Market Development Potential (Application)
7.2 Global e-Ink Display Moudles Market Sales by Application (2019-2025)
7.3 Global e-Ink Display Moudles Market Size (M USD) by Application (2019-2025)
7.4 Global e-Ink Display Moudles Sales Growth Rate by Application (2019-2025)
8 e-Ink Display Moudles Market Consumption by Region
8.1 Global e-Ink Display Moudles Sales by Region
8.1.1 Global e-Ink Display Moudles Sales by Region
8.1.2 Global e-Ink Display Moudles Sales Market Share by Region
8.2 North America
8.2.1 North America e-Ink Display Moudles Sales by Country
8.2.2 U.S.
8.2.3 Canada
8.2.4 Mexico
8.3 Europe
8.3.1 Europe e-Ink Display Moudles Sales by Country
8.3.2 Germany
8.3.3 France
8.3.4 U.K.
8.3.5 Italy
8.3.6 Russia
8.4 Asia Pacific
8.4.1 Asia Pacific e-Ink Display Moudles Sales by Region
8.4.2 China
8.4.3 Japan
8.4.4 South Korea
8.4.5 India
8.4.6 Southeast Asia
8.5 South America
8.5.1 South America e-Ink Display Moudles Sales by Country
8.5.2 Brazil
8.5.3 Argentina
8.5.4 Columbia
8.6 Middle East and Africa
8.6.1 Middle East and Africa e-Ink Display Moudles Sales by Region
8.6.2 Saudi Arabia
8.6.3 UAE
8.6.4 Egypt
8.6.5 Nigeria
8.6.6 South Africa
9 e-Ink Display Moudles Market Production by Region
9.1 Global Production of e-Ink Display Moudles by Region (2019-2025)
9.2 Global e-Ink Display Moudles Revenue Market Share by Region (2019-2025)
9.3 Global e-Ink Display Moudles Production, Revenue, Price and Gross Margin (2019-2025)
9.4 North America e-Ink Display Moudles Production
9.4.1 North America e-Ink Display Moudles Production Growth Rate (2019-2025)
9.4.2 North America e-Ink Display Moudles Production, Revenue, Price and Gross Margin (2019-2025)
9.5 Europe e-Ink Display Moudles Production
9.5.1 Europe e-Ink Display Moudles Production Growth Rate (2019-2025)
9.5.2 Europe e-Ink Display Moudles Production, Revenue, Price and Gross Margin (2019-2025)
9.6 Japan e-Ink Display Moudles Production (2019-2025)
9.6.1 Japan e-Ink Display Moudles Production Growth Rate (2019-2025)
9.6.2 Japan e-Ink Display Moudles Production, Revenue, Price and Gross Margin (2019-2025)
9.7 China e-Ink Display Moudles Production (2019-2025)
9.7.1 China e-Ink Display Moudles Production Growth Rate (2019-2025)
9.7.2 China e-Ink Display Moudles Production, Revenue, Price and Gross Margin (2019-2025)
10 Key Companies Profile
10.1 E Ink
10.1.1 E Ink e-Ink Display Moudles Basic Information
10.1.2 E Ink e-Ink Display Moudles Product Overview
10.1.3 E Ink e-Ink Display Moudles Product Market Performance
10.1.4 E Ink Business Overview
10.1.5 E Ink e-Ink Display Moudles SWOT Analysis
10.1.6 E Ink Recent Developments
10.2 DKE
10.2.1 DKE e-Ink Display Moudles Basic Information
10.2.2 DKE e-Ink Display Moudles Product Overview
10.2.3 DKE e-Ink Display Moudles Product Market Performance
10.2.4 DKE Business Overview
10.2.5 DKE e-Ink Display Moudles SWOT Analysis
10.2.6 DKE Recent Developments
10.3 Pervasive Displays (BOE)
10.3.1 Pervasive Displays (BOE) e-Ink Display Moudles Basic Information
10.3.2 Pervasive Displays (BOE) e-Ink Display Moudles Product Overview
10.3.3 Pervasive Displays (BOE) e-Ink Display Moudles Product Market Performance
10.3.4 Pervasive Displays (BOE) e-Ink Display Moudles SWOT Analysis
10.3.5 Pervasive Displays (BOE) Business Overview
10.3.6 Pervasive Displays (BOE) Recent Developments
10.4 Holitech
10.4.1 Holitech e-Ink Display Moudles Basic Information
10.4.2 Holitech e-Ink Display Moudles Product Overview
10.4.3 Holitech e-Ink Display Moudles Product Market Performance
10.4.4 Holitech Business Overview
10.4.5 Holitech Recent Developments
10.5 Wuxi Weifeng Technology
10.5.1 Wuxi Weifeng Technology e-Ink Display Moudles Basic Information
10.5.2 Wuxi Weifeng Technology e-Ink Display Moudles Product Overview
10.5.3 Wuxi Weifeng Technology e-Ink Display Moudles Product Market Performance
10.5.4 Wuxi Weifeng Technology Business Overview
10.5.5 Wuxi Weifeng Technology Recent Developments
10.6 Suzhou Qingyue Optoelectronic
10.6.1 Suzhou Qingyue Optoelectronic e-Ink Display Moudles Basic Information
10.6.2 Suzhou Qingyue Optoelectronic e-Ink Display Moudles Product Overview
10.6.3 Suzhou Qingyue Optoelectronic e-Ink Display Moudles Product Market Performance
10.6.4 Suzhou Qingyue Optoelectronic Business Overview
10.6.5 Suzhou Qingyue Optoelectronic Recent Developments
10.7 Guangzhou OED Technologies
10.7.1 Guangzhou OED Technologies e-Ink Display Moudles Basic Information
10.7.2 Guangzhou OED Technologies e-Ink Display Moudles Product Overview
10.7.3 Guangzhou OED Technologies e-Ink Display Moudles Product Market Performance
10.7.4 Guangzhou OED Technologies Business Overview
10.7.5 Guangzhou OED Technologies Recent Developments
10.8 Yes Optoelectronics (Group)
10.8.1 Yes Optoelectronics (Group) e-Ink Display Moudles Basic Information
10.8.2 Yes Optoelectronics (Group) e-Ink Display Moudles Product Overview
10.8.3 Yes Optoelectronics (Group) e-Ink Display Moudles Product Market Performance
10.8.4 Yes Optoelectronics (Group) Business Overview
10.8.5 Yes Optoelectronics (Group) Recent Developments
10.9 Microview Electronics
10.9.1 Microview Electronics e-Ink Display Moudles Basic Information
10.9.2 Microview Electronics e-Ink Display Moudles Product Overview
10.9.3 Microview Electronics e-Ink Display Moudles Product Market Performance
10.9.4 Microview Electronics Business Overview
10.9.5 Microview Electronics Recent Developments
10.10 Ink Cubic Optronics Technology
10.10.1 Ink Cubic Optronics Technology e-Ink Display Moudles Basic Information
10.10.2 Ink Cubic Optronics Technology e-Ink Display Moudles Product Overview
10.10.3 Ink Cubic Optronics Technology e-Ink Display Moudles Product Market Performance
10.10.4 Ink Cubic Optronics Technology Business Overview
10.10.5 Ink Cubic Optronics Technology Recent Developments
11 e-Ink Display Moudles Market Forecast by Region
11.1 Global e-Ink Display Moudles Market Size Forecast
11.2 Global e-Ink Display Moudles Market Forecast by Region
11.2.1 North America Market Size Forecast by Country
11.2.2 Europe e-Ink Display Moudles Market Size Forecast by Country
11.2.3 Asia Pacific e-Ink Display Moudles Market Size Forecast by Region
11.2.4 South America e-Ink Display Moudles Market Size Forecast by Country
11.2.5 Middle East and Africa Forecasted Consumption of e-Ink Display Moudles by Country
12 Forecast Market by Type and by Application (2025-2032)
12.1 Global e-Ink Display Moudles Market Forecast by Type (2025-2032)
12.1.1 Global Forecasted Sales of e-Ink Display Moudles by Type (2025-2032)
12.1.2 Global e-Ink Display Moudles Market Size Forecast by Type (2025-2032)
12.1.3 Global Forecasted Price of e-Ink Display Moudles by Type (2025-2032)
12.2 Global e-Ink Display Moudles Market Forecast by Application (2025-2032)
12.2.1 Global e-Ink Display Moudles Sales (K Units) Forecast by Application
12.2.2 Global e-Ink Display Moudles Market Size (M USD) Forecast by Application (2025-2032)
13 Conclusion and Key FindingsList of Tables
Table 1. Introduction of the Type
Table 2. Introduction of the Application
Table 3. Market Size (M USD) Segment Executive Summary
Table 4. e-Ink Display Moudles Market Size Comparison by Region (M USD)
Table 5. Global e-Ink Display Moudles Sales (K Units) by Manufacturers (2019-2025)
Table 6. Global e-Ink Display Moudles Sales Market Share by Manufacturers (2019-2025)
Table 7. Global e-Ink Display Moudles Revenue (M USD) by Manufacturers (2019-2025)
Table 8. Global e-Ink Display Moudles Revenue Share by Manufacturers (2019-2025)
Table 9. Company Type (Tier 1, Tier 2, and Tier 3) & (based on the Revenue in e-Ink Display Moudles as of 2022)
Table 10. Global Market e-Ink Display Moudles Average Price (USD/Unit) of Key Manufacturers (2019-2025)
Table 11. Manufacturers e-Ink Display Moudles Sales Sites and Area Served
Table 12. Manufacturers e-Ink Display Moudles Product Type
Table 13. Global e-Ink Display Moudles Manufacturers Market Concentration Ratio (CR5 and HHI)
Table 14. Mergers & Acquisitions, Expansion Plans
Table 15. Industry Chain Map of e-Ink Display Moudles
Table 16. Market Overview of Key Raw Materials
Table 17. Midstream Market Analysis
Table 18. Downstream Customer Analysis
Table 19. Key Development Trends
Table 20. Driving Factors
Table 21. e-Ink Display Moudles Market Challenges
Table 22. Global e-Ink Display Moudles Sales by Type (K Units)
Table 23. Global e-Ink Display Moudles Market Size by Type (M USD)
Table 24. Global e-Ink Display Moudles Sales (K Units) by Type (2019-2025)
Table 25. Global e-Ink Display Moudles Sales Market Share by Type (2019-2025)
Table 26. Global e-Ink Display Moudles Market Size (M USD) by Type (2019-2025)
Table 27. Global e-Ink Display Moudles Market Size Share by Type (2019-2025)
Table 28. Global e-Ink Display Moudles Price (USD/Unit) by Type (2019-2025)
Table 29. Global e-Ink Display Moudles Sales (K Units) by Application
Table 30. Global e-Ink Display Moudles Market Size by Application
Table 31. Global e-Ink Display Moudles Sales by Application (2019-2025) & (K Units)
Table 32. Global e-Ink Display Moudles Sales Market Share by Application (2019-2025)
Table 33. Global e-Ink Display Moudles Sales by Application (2019-2025) & (M USD)
Table 34. Global e-Ink Display Moudles Market Share by Application (2019-2025)
Table 35. Global e-Ink Display Moudles Sales Growth Rate by Application (2019-2025)
Table 36. Global e-Ink Display Moudles Sales by Region (2019-2025) & (K Units)
Table 37. Global e-Ink Display Moudles Sales Market Share by Region (2019-2025)
Table 38. North America e-Ink Display Moudles Sales by Country (2019-2025) & (K Units)
Table 39. Europe e-Ink Display Moudles Sales by Country (2019-2025) & (K Units)
Table 40. Asia Pacific e-Ink Display Moudles Sales by Region (2019-2025) & (K Units)
Table 41. South America e-Ink Display Moudles Sales by Country (2019-2025) & (K Units)
Table 42. Middle East and Africa e-Ink Display Moudles Sales by Region (2019-2025) & (K Units)
Table 43. Global e-Ink Display Moudles Production (K Units) by Region (2019-2025)
Table 44. Global e-Ink Display Moudles Revenue (US$ Million) by Region (2019-2025)
Table 45. Global e-Ink Display Moudles Revenue Market Share by Region (2019-2025)
Table 46. Global e-Ink Display Moudles Production (K Units), Revenue (US$ Million), Price (USD/Unit) and Gross Margin (2019-2025)
Table 47. North America e-Ink Display Moudles Production (K Units), Revenue (US$ Million), Price (USD/Unit) and Gross Margin (2019-2025)
Table 48. Europe e-Ink Display Moudles Production (K Units), Revenue (US$ Million), Price (USD/Unit) and Gross Margin (2019-2025)
Table 49. Japan e-Ink Display Moudles Production (K Units), Revenue (US$ Million), Price (USD/Unit) and Gross Margin (2019-2025)
Table 50. China e-Ink Display Moudles Production (K Units), Revenue (US$ Million), Price (USD/Unit) and Gross Margin (2019-2025)
Table 51. E Ink e-Ink Display Moudles Basic Information
Table 52. E Ink e-Ink Display Moudles Product Overview
Table 53. E Ink e-Ink Display Moudles Sales (K Units), Revenue (M USD), Price (USD/Unit) and Gross Margin (2019-2025)
Table 54. E Ink Business Overview
Table 55. E Ink e-Ink Display Moudles SWOT Analysis
Table 56. E Ink Recent Developments
Table 57. DKE e-Ink Display Moudles Basic Information
Table 58. DKE e-Ink Display Moudles Product Overview
Table 59. DKE e-Ink Display Moudles Sales (K Units), Revenue (M USD), Price (USD/Unit) and Gross Margin (2019-2025)
Table 60. DKE Business Overview
Table 61. DKE e-Ink Display Moudles SWOT Analysis
Table 62. DKE Recent Developments
Table 63. Pervasive Displays (BOE) e-Ink Display Moudles Basic Information
Table 64. Pervasive Displays (BOE) e-Ink Display Moudles Product Overview
Table 65. Pervasive Displays (BOE) e-Ink Display Moudles Sales (K Units), Revenue (M USD), Price (USD/Unit) and Gross Margin (2019-2025)
Table 66. Pervasive Displays (BOE) e-Ink Display Moudles SWOT Analysis
Table 67. Pervasive Displays (BOE) Business Overview
Table 68. Pervasive Displays (BOE) Recent Developments
Table 69. Holitech e-Ink Display Moudles Basic Information
Table 70. Holitech e-Ink Display Moudles Product Overview
Table 71. Holitech e-Ink Display Moudles Sales (K Units), Revenue (M USD), Price (USD/Unit) and Gross Margin (2019-2025)
Table 72. Holitech Business Overview
Table 73. Holitech Recent Developments
Table 74. Wuxi Weifeng Technology e-Ink Display Moudles Basic Information
Table 75. Wuxi Weifeng Technology e-Ink Display Moudles Product Overview
Table 76. Wuxi Weifeng Technology e-Ink Display Moudles Sales (K Units), Revenue (M USD), Price (USD/Unit) and Gross Margin (2019-2025)
Table 77. Wuxi Weifeng Technology Business Overview
Table 78. Wuxi Weifeng Technology Recent Developments
Table 79. Suzhou Qingyue Optoelectronic e-Ink Display Moudles Basic Information
Table 80. Suzhou Qingyue Optoelectronic e-Ink Display Moudles Product Overview
Table 81. Suzhou Qingyue Optoelectronic e-Ink Display Moudles Sales (K Units), Revenue (M USD), Price (USD/Unit) and Gross Margin (2019-2025)
Table 82. Suzhou Qingyue Optoelectronic Business Overview
Table 83. Suzhou Qingyue Optoelectronic Recent Developments
Table 84. Guangzhou OED Technologies e-Ink Display Moudles Basic Information
Table 85. Guangzhou OED Technologies e-Ink Display Moudles Product Overview
Table 86. Guangzhou OED Technologies e-Ink Display Moudles Sales (K Units), Revenue (M USD), Price (USD/Unit) and Gross Margin (2019-2025)
Table 87. Guangzhou OED Technologies Business Overview
Table 88. Guangzhou OED Technologies Recent Developments
Table 89. Yes Optoelectronics (Group) e-Ink Display Moudles Basic Information
Table 90. Yes Optoelectronics (Group) e-Ink Display Moudles Product Overview
Table 91. Yes Optoelectronics (Group) e-Ink Display Moudles Sales (K Units), Revenue (M USD), Price (USD/Unit) and Gross Margin (2019-2025)
Table 92. Yes Optoelectronics (Group) Business Overview
Table 93. Yes Optoelectronics (Group) Recent Developments
Table 94. Microview Electronics e-Ink Display Moudles Basic Information
Table 95. Microview Electronics e-Ink Display Moudles Product Overview
Table 96. Microview Electronics e-Ink Display Moudles Sales (K Units), Revenue (M USD), Price (USD/Unit) and Gross Margin (2019-2025)
Table 97. Microview Electronics Business Overview
Table 98. Microview Electronics Recent Developments
Table 99. Ink Cubic Optronics Technology e-Ink Display Moudles Basic Information
Table 100. Ink Cubic Optronics Technology e-Ink Display Moudles Product Overview
Table 101. Ink Cubic Optronics Technology e-Ink Display Moudles Sales (K Units), Revenue (M USD), Price (USD/Unit) and Gross Margin (2019-2025)
Table 102. Ink Cubic Optronics Technology Business Overview
Table 103. Ink Cubic Optronics Technology Recent Developments
Table 104. Global e-Ink Display Moudles Sales Forecast by Region (2025-2032) & (K Units)
Table 105. Global e-Ink Display Moudles Market Size Forecast by Region (2025-2032) & (M USD)
Table 106. North America e-Ink Display Moudles Sales Forecast by Country (2025-2032) & (K Units)
Table 107. North America e-Ink Display Moudles Market Size Forecast by Country (2025-2032) & (M USD)
Table 108. Europe e-Ink Display Moudles Sales Forecast by Country (2025-2032) & (K Units)
Table 109. Europe e-Ink Display Moudles Market Size Forecast by Country (2025-2032) & (M USD)
Table 110. Asia Pacific e-Ink Display Moudles Sales Forecast by Region (2025-2032) & (K Units)
Table 111. Asia Pacific e-Ink Display Moudles Market Size Forecast by Region (2025-2032) & (M USD)
Table 112. South America e-Ink Display Moudles Sales Forecast by Country (2025-2032) & (K Units)
Table 113. South America e-Ink Display Moudles Market Size Forecast by Country (2025-2032) & (M USD)
Table 114. Middle East and Africa e-Ink Display Moudles Consumption Forecast by Country (2025-2032) & (Units)
Table 115. Middle East and Africa e-Ink Display Moudles Market Size Forecast by Country (2025-2032) & (M USD)
Table 116. Global e-Ink Display Moudles Sales Forecast by Type (2025-2032) & (K Units)
Table 117. Global e-Ink Display Moudles Market Size Forecast by Type (2025-2032) & (M USD)
Table 118. Global e-Ink Display Moudles Price Forecast by Type (2025-2032) & (USD/Unit)
Table 119. Global e-Ink Display Moudles Sales (K Units) Forecast by Application (2025-2032)
Table 120. Global e-Ink Display Moudles Market Size Forecast by Application (2025-2032) & (M USD)
List of Figures
Figure 1. Product Picture of e-Ink Display Moudles
Figure 2. Data Triangulation
Figure 3. Key Caveats
Figure 4. Global e-Ink Display Moudles Market Size (M USD), 2019-2032
Figure 5. Global e-Ink Display Moudles Market Size (M USD) (2019-2032)
Figure 6. Global e-Ink Display Moudles Sales (K Units) & (2019-2032)
Figure 7. Evaluation Matrix of Segment Market Development Potential (Type)
Figure 8. Evaluation Matrix of Segment Market Development Potential (Application)
Figure 9. Evaluation Matrix of Regional Market Development Potential
Figure 10. e-Ink Display Moudles Market Size by Country (M USD)
Figure 11. e-Ink Display Moudles Sales Share by Manufacturers in 2023
Figure 12. Global e-Ink Display Moudles Revenue Share by Manufacturers in 2023
Figure 13. e-Ink Display Moudles Market Share by Company Type (Tier 1, Tier 2 and Tier 3): 2023
Figure 14. Global Market e-Ink Display Moudles Average Price (USD/Unit) of Key Manufacturers in 2023
Figure 15. The Global 5 and 10 Largest Players: Market Share by e-Ink Display Moudles Revenue in 2023
Figure 16. Evaluation Matrix of Segment Market Development Potential (Type)
Figure 17. Global e-Ink Display Moudles Market Share by Type
Figure 18. Sales Market Share of e-Ink Display Moudles by Type (2019-2025)
Figure 19. Sales Market Share of e-Ink Display Moudles by Type in 2023
Figure 20. Market Size Share of e-Ink Display Moudles by Type (2019-2025)
Figure 21. Market Size Market Share of e-Ink Display Moudles by Type in 2023
Figure 22. Evaluation Matrix of Segment Market Development Potential (Application)
Figure 23. Global e-Ink Display Moudles Market Share by Application
Figure 24. Global e-Ink Display Moudles Sales Market Share by Application (2019-2025)
Figure 25. Global e-Ink Display Moudles Sales Market Share by Application in 2023
Figure 26. Global e-Ink Display Moudles Market Share by Application (2019-2025)
Figure 27. Global e-Ink Display Moudles Market Share by Application in 2023
Figure 28. Global e-Ink Display Moudles Sales Growth Rate by Application (2019-2025)
Figure 29. Global e-Ink Display Moudles Sales Market Share by Region (2019-2025)
Figure 30. North America e-Ink Display Moudles Sales and Growth Rate (2019-2025) & (K Units)
Figure 31. North America e-Ink Display Moudles Sales Market Share by Country in 2023
Figure 32. U.S. e-Ink Display Moudles Sales and Growth Rate (2019-2025) & (K Units)
Figure 33. Canada e-Ink Display Moudles Sales (K Units) and Growth Rate (2019-2025)
Figure 34. Mexico e-Ink Display Moudles Sales (Units) and Growth Rate (2019-2025)
Figure 35. Europe e-Ink Display Moudles Sales and Growth Rate (2019-2025) & (K Units)
Figure 36. Europe e-Ink Display Moudles Sales Market Share by Country in 2023
Figure 37. Germany e-Ink Display Moudles Sales and Growth Rate (2019-2025) & (K Units)
Figure 38. France e-Ink Display Moudles Sales and Growth Rate (2019-2025) & (K Units)
Figure 39. U.K. e-Ink Display Moudles Sales and Growth Rate (2019-2025) & (K Units)
Figure 40. Italy e-Ink Display Moudles Sales and Growth Rate (2019-2025) & (K Units)
Figure 41. Russia e-Ink Display Moudles Sales and Growth Rate (2019-2025) & (K Units)
Figure 42. Asia Pacific e-Ink Display Moudles Sales and Growth Rate (K Units)
Figure 43. Asia Pacific e-Ink Display Moudles Sales Market Share by Region in 2023
Figure 44. China e-Ink Display Moudles Sales and Growth Rate (2019-2025) & (K Units)
Figure 45. Japan e-Ink Display Moudles Sales and Growth Rate (2019-2025) & (K Units)
Figure 46. South Korea e-Ink Display Moudles Sales and Growth Rate (2019-2025) & (K Units)
Figure 47. India e-Ink Display Moudles Sales and Growth Rate (2019-2025) & (K Units)
Figure 48. Southeast Asia e-Ink Display Moudles Sales and Growth Rate (2019-2025) & (K Units)
Figure 49. South America e-Ink Display Moudles Sales and Growth Rate (K Units)
Figure 50. South America e-Ink Display Moudles Sales Market Share by Country in 2023
Figure 51. Brazil e-Ink Display Moudles Sales and Growth Rate (2019-2025) & (K Units)
Figure 52. Argentina e-Ink Display Moudles Sales and Growth Rate (2019-2025) & (K Units)
Figure 53. Columbia e-Ink Display Moudles Sales and Growth Rate (2019-2025) & (K Units)
Figure 54. Middle East and Africa e-Ink Display Moudles Sales and Growth Rate (K Units)
Figure 55. Middle East and Africa e-Ink Display Moudles Sales Market Share by Region in 2023
Figure 56. Saudi Arabia e-Ink Display Moudles Sales and Growth Rate (2019-2025) & (K Units)
Figure 57. UAE e-Ink Display Moudles Sales and Growth Rate (2019-2025) & (K Units)
Figure 58. Egypt e-Ink Display Moudles Sales and Growth Rate (2019-2025) & (K Units)
Figure 59. Nigeria e-Ink Display Moudles Sales and Growth Rate (2019-2025) & (K Units)
Figure 60. South Africa e-Ink Display Moudles Sales and Growth Rate (2019-2025) & (K Units)
Figure 61. Global e-Ink Display Moudles Production Market Share by Region (2019-2025)
Figure 62. North America e-Ink Display Moudles Production (K Units) Growth Rate (2019-2025)
Figure 63. Europe e-Ink Display Moudles Production (K Units) Growth Rate (2019-2025)
Figure 64. Japan e-Ink Display Moudles Production (K Units) Growth Rate (2019-2025)
Figure 65. China e-Ink Display Moudles Production (K Units) Growth Rate (2019-2025)
Figure 66. Global e-Ink Display Moudles Sales Forecast by Volume (2019-2032) & (K Units)
Figure 67. Global e-Ink Display Moudles Market Size Forecast by Value (2019-2032) & (M USD)
Figure 68. Global e-Ink Display Moudles Sales Market Share Forecast by Type (2025-2032)
Figure 69. Global e-Ink Display Moudles Market Share Forecast by Type (2025-2032)
Figure 70. Global e-Ink Display Moudles Sales Forecast by Application (2025-2032)
Figure 71. Global e-Ink Display Moudles Market Share Forecast by Application (2025-2032)