Global Commercial Ion Implantation Systems Market, Emerging Trends, Technological Advancements, and Business Strategies 2026-2034

Commercial Ion Implantation Systems Market size was valued at USD 3.86 billion in 2025. The market is projected to grow from USD 4.35 billion in 2026 to USD 9.07 billion by 2034, exhibiting a CAGR of 13.3% during the forecast period.

PDF Icon Download Sample Report PDF
  • Quick Dispatch

    All Orders

  • Secure Payment

    100% Secure Payment

Price range: $1,500.00 through $4,250.00

Clear

Market Insights

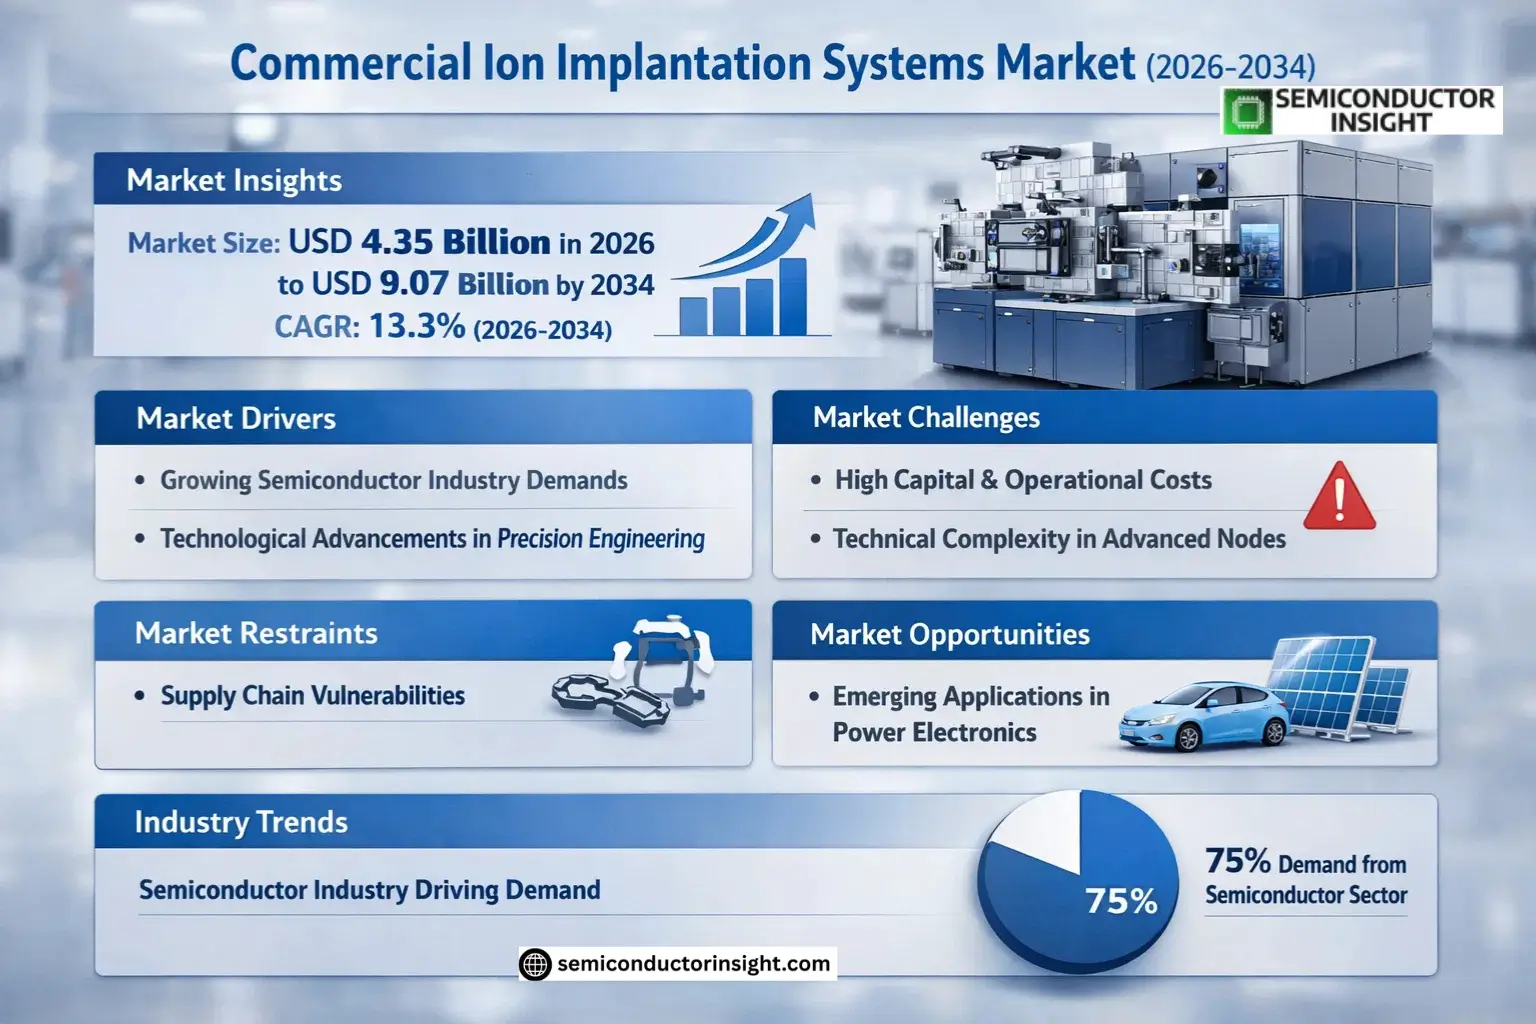
Global Commercial Ion Implantation Systems Market size was valued at USD 3.86 billion in 2025. The market is projected to grow from USD 4.35 billion in 2026 to USD 9.07 billion by 2034, exhibiting a CAGR of 13.3% during the forecast period.

Commercial ion implantation systems are specialized semiconductor manufacturing equipment used to modify the electrical properties of materials by implanting ions into substrates such as silicon wafers. These systems play a critical role in semiconductor fabrication, enabling precise doping processes essential for integrated circuits, MEMS devices, and photovoltaic cells.

The market growth is driven by increasing demand for advanced semiconductor devices, particularly in applications like AI, IoT, and 5G technologies. While the U.S. remains a key market due to its strong semiconductor manufacturing base, China’s rapid expansion in chip production is creating significant opportunities. However, supply chain constraints and high capital costs pose challenges for smaller manufacturers looking to adopt these systems.

Global Commercial Ion Implantation Systems Market Insights

MARKET DRIVERS

Growing Semiconductor Industry Demands

Global semiconductor industry’s rapid expansion is a key driver for the Commercial Ion Implantation Systems Market. With semiconductor manufacturers requiring precise doping processes for advanced chip fabrication, demand for ion implantation systems has grown by approximately 18% annually. The need for high-performance chips in AI, 5G, and IoT applications further accelerates this trend.

Technological Advancements in Precision Engineering

Recent innovations in beam current stability and dose control have enhanced the capabilities of commercial ion implantation systems. Manufacturers are investing in cluster tool compatibility and single-wafer processing solutions, with system accuracy now reaching sub-nanometer precision levels. The market has seen a 25% increase in demand for multi-species implantation systems since 2022.

Government initiatives supporting domestic semiconductor production in the U.S., EU, and Asia-Pacific are creating additional growth opportunities for commercial ion implantation system providers.

MARKET CHALLENGES

High Capital and Operational Costs

Commercial ion implantation systems represent a significant capital expenditure, with advanced systems costing between USD 3-10 million per unit. The operational costs, including maintenance and specialized operator training, add to the total cost of ownership. This creates a high barrier to entry for smaller semiconductor fabrication facilities.

Other Challenges

Technical Complexity in Advanced Nodes
As semiconductor nodes shrink below 5nm, ion implantation systems face increasing challenges in maintaining uniformity and preventing wafer damage. The precision requirements for ultra-shallow junctions and 3D structures push the limits of current technology.

MARKET RESTRAINTS

Supply Chain Vulnerabilities

Commercial Ion Implantation Systems Market faces supply chain constraints for critical components like ion sources and high-voltage power supplies. Lead times for certain systems have extended to 9-12 months due to semiconductor component shortages, impacting market growth projections by an estimated 8-10% annually.

MARKET OPPORTUNITIES

Emerging Applications in Power Electronics

The growing demand for power semiconductors in electric vehicles and renewable energy systems is creating new opportunities for commercial ion implantation systems. These applications require specialized doping profiles for SiC and GaN devices, driving a 30% increase in system customization requests since 2023.

Commercial Ion Implantation Systems Market Trends
Semiconductor Industry Driving Demand

The semiconductor industry remains the primary driver for Commercial Ion Implantation Systems, accounting for over 75% of total demand. These systems are critical for doping semiconductors with precise ion concentrations to modify electrical properties. Leading manufacturers are investing in advanced systems capable of handling smaller node processes below 7nm.

Other Trends

Medium-Current Implanter Segment Growth

Medium-current implanters are gaining market share due to their versatility in handling multiple doping applications across different semiconductor types. This segment is particularly favored for memory chip production where balanced implantation depth and dose control are essential.

Regional Market Shifts

Asia-Pacific continues to dominate the Commercial Ion Implantation Systems market, with China, Taiwan and South Korea representing over 60% of global demand. The region’s semiconductor manufacturing expansion and government support for domestic chip production are key growth factors. Meanwhile, North America maintains strong R&D investments in next-generation implantation technologies.

Other Trends

Equipment Innovation Focus

Major players like Applied Materials and Axcelis Technologies are developing implantation systems with improved beam uniformity and energy efficiency. Recent advancements include hybrid systems combining multiple implantation technologies to address diverse semiconductor manufacturing requirements.

Supply Chain Optimization

Commercial Ion Implantation Systems Market is seeing increased vertical integration as manufacturers seek to secure critical components. This trend responds to semiconductor industry demands for more stable equipment supply chains and shorter lead times for system maintenance and upgrades.

COMPETITIVE LANDSCAPE

Key Industry Players

Global ion implantation systems market dominated by semiconductor equipment giants and specialized manufacturers

Commercial Ion Implantation Systems Market is consolidated, with the top five players accounting for a significant revenue share in 2025. Applied Materials (AMAT) and Axcelis Technologies lead the market with their comprehensive product portfolios and strong presence across semiconductor fabrication facilities worldwide. These market leaders have maintained dominance through continuous R&D investments in advanced implantation technologies for sub-7nm nodes and emerging memory applications.

Specialized manufacturers like Nissin Ion Equipment and Advanced Ion Beam Technology (AIBT) compete through niche high-energy implantation solutions, particularly for power devices and MEMS applications. Chinese players such as CETC Electronics Equipment and Kingstone Semiconductor are gaining traction in domestic semiconductor fabs, supported by government initiatives to strengthen local semiconductor supply chains. The market also features several Japanese precision engineering firms with strong capabilities in ion beam technologies.

List of Key Commercial Ion Implantation Systems Companies Profiled

Segment Analysis:

Segment Category Sub-Segments Key Insights
By Type
  • Medium-Current Implanter
  • High-Current Implanter
  • High-Energy Implanter
Medium-Current Implanter dominates with superior adoption in mainstream semiconductor manufacturing:

  • Balances precision and throughput for standard IC production requirements
  • Offers optimal doping efficiency for most semiconductor materials
  • Widely compatible with existing semiconductor fabrication workflows
By Application
  • Semiconductor Industry
  • Photovoltaic (PV) Industry
  • Research & Development
Semiconductor Industry drives extensive adoption with critical process requirements:

  • Essential for creating precise doping profiles in IC manufacturing
  • Increasing demand from advanced logic and memory chip production
  • Technology node shrink drives equipment upgrades and replacements
  • Emerging applications in 3D NAND and power semiconductor production
By End User
  • Foundries
  • IDMs (Integrated Device Manufacturers)
  • Research Institutions
  • Solar Cell Manufacturers
Foundries represent the core demand segment with intensive production needs:

  • High-volume production requires multiple implantation systems per facility
  • Technology leadership drives adoption of latest implantation technologies
  • Strategic equipment investments to maintain competitive fab capabilities
By Technology Node
  • Advanced Nodes (<28nm)
  • Mature Nodes (28-90nm)
  • Legacy Nodes (>90nm)
Advanced Nodes (<28nm) show strongest growth potential:

  • Demands ultra-precise implantation with minimal damage to wafers
  • Requires specialized high-energy and high-current implanters
  • Increasing adoption in cutting-edge logic and memory applications
By System Configuration
  • Standalone Systems
  • Cluster Systems
  • Customized Solutions
Cluster Systems gain prominence in advanced fabs:

  • Integrated solutions improve wafer throughput and yield
  • Reduces particle contamination through vacuum wafer transfer
  • Enables better process control for complex semiconductor structures
  • Preferred choice for high-volume manufacturing environments

Regional Analysis: Global Commercial Ion Implantation Systems Market

Asia-Pacific

The Asia-Pacific region dominates the Commercial Ion Implantation Systems Market , driven by robust semiconductor manufacturing ecosystems in China, South Korea, and Taiwan. This region benefits from concentrated fabrication plants investing heavily in advanced doping technologies for next-gen chips. Government initiatives supporting domestic semiconductor production, combined with expanding foundry capacities in the Electronics Manufacturing Clusters (EMCs), create sustained demand for high-precision ion implantation equipment. The APAC market sees accelerating adoption of medium-current implanters for MEMS applications and high-energy systems for power devices. Regional players are actively integrating AI-driven process optimization in implantation systems to improve yield rates while maintaining stringent contamination control standards required for cutting-edge nodes.

Technology Leadership
China’s SMIC and Taiwan’s TSMC lead in adopting cluster tool architectures combining implantation with etch and deposition modules, driving demand for advanced systems with sub-10nm process capabilities and AI-based beam control.
Manufacturing Hubs
Korea’s semiconductor belt spanning Pyeongtaek to Hwaseong concentrates over 40% of regional implantation capacity, with Samsung deploying self-calibrating implanters featuring real-time dopant profile monitoring through integrated machine learning algorithms.
R&D Investment
Japan’s collaboration between equipment makers like Nissin Electric and material suppliers develops novel beamline designs optimized for silicon carbide and gallium nitride power devices, addressing automotive electrification needs.
Supply Chain Dynamics
Southeast Asia emerges as secondary hub with Singapore and Malaysia hosting backend implantation services and specialty foundries utilizing refurbished mid-range implanters for analog and mixed-signal IC production.

North America
The North American Commercial Ion Implantation Systems Market thrives on advanced research facilities and specialized compound semiconductor production. The U.S. leads in developing plasma doping technologies for 3D IC packaging, with major fabless companies driving demand for ultra-low energy implanters. Defense applications stimulate needs for radiation-hardened implantation processes, while national semiconductor initiatives encourage equipment upgrades among domestic IDMs. Canada’s photonics industry creates niche demand for precise dopant placement in optoelectronic devices.

Europe
Europe maintains strong positions in automotive and industrial power semiconductors requiring robust ion implantation solutions. Germany’s automotive chipmakers favor high-voltage implanters for silicon carbide devices, while France’s research institutes pioneer quantum computing applications using single-ion implantation techniques. The EU Chips Act accelerates equipment investments, particularly in MEMS and sensor manufacturing clusters across the Dresden-Nanterre innovation corridor.

Middle East & Africa
The region shows emerging potential with Saudi Arabia’s semiconductor initiatives and Israel’s specialized foundries focusing on medical device applications. Investments in technology transfer programs facilitate localized maintenance capabilities for implantation systems, while sovereign wealth funds explore partnerships with major equipment manufacturers to establish regional service hubs.

South America
Brazil leads regional adoption through its electronics manufacturing incentives, primarily utilizing mid-range implantation systems for discrete semiconductors. Argentina’s nuclear technology sector drives specialized demand for high-energy implanters in radiation detector production, while regional universities collaborate on developing compact ion sources for research applications.

Report Scope

This market research report provides a comprehensive analysis of the Commercial Ion Implantation Systems Market, covering the forecast period 2025–2034. It offers detailed insights into market dynamics, technological advancements, competitive landscape, and key trends shaping the industry.

Key focus areas of the report include:

  • Market Overview: The report begins with an overview outlining its current market scenario, key growth indicators, and industry transformation drivers. It discusses macroeconomic factors, demand–supply balance, regulatory landscape, and the strategic role of ion implantation systems in powering advancements across industries such as semiconductors, photovoltaics, and electronic devices.
  • Market Size & Forecast: Historical data and future projections for revenue, unit shipments, and market value across major regions and segments.
  • Segmentation Analysis: Detailed breakdown by product type, technology, application, and end-user industry to identify high-growth segments and investment opportunities.
  • Regional Insights: Insights into market performance across North America, Europe, Asia-Pacific, Latin America, and the Middle East & Africa, including country-level analysis where relevant.
  • Competitive Landscape: Profiles of leading market participants, including their product offerings, R&D focus, manufacturing capacity, pricing strategies, and recent developments such as mergers, acquisitions, and partnerships.
  • Technology Trends & Innovation: Assessment of emerging technologies, integration of AI/IoT, semiconductor design trends, fabrication techniques, and evolving industry standards.
  • Market Drivers & Restraints: Evaluation of factors driving market growth along with challenges, supply chain constraints, regulatory issues, and market-entry barriers.
  • Stakeholder Insights: Insights for component suppliers, OEMs, system integrators, investors, and policymakers regarding the evolving ecosystem and strategic opportunities.

Primary and secondary research methods are employed, including interviews with industry experts, data from verified sources, and real-time market intelligence to ensure the accuracy and reliability of the insights presented.

FREQUENTLY ASKED QUESTIONS:

What is the current market size of Commercial Ion Implantation Systems Market?

-> Commercial Ion Implantation Systems Market size was valued at USD 3.86 billion in 2025. The market is projected to grow from USD 4.35 billion in 2026 to USD 9.07 billion by 2034, exhibiting a CAGR of 13.3% during the forecast period.

Which key companies operate in Commercial Ion Implantation Systems Market?

-> Key players include AMAT (Applied Materials), Axcelis Technologies, Sumitomo Heavy Industries, Nissin Ion Equipment, Advanced Ion Beam Technology (AIBT), CETC Electronics Equipment, ULVAC Technologies, Kingstone Semiconductor, among others.

What are the key growth drivers?

-> Key growth drivers include rising demand for semiconductors, advancements in photovoltaic technology, and increasing adoption of electronic devices.

Which region dominates the market?

-> Asia is the dominant market, with China leading in terms of market size and growth potential.

What are the emerging trends?

-> Emerging trends include development of high-current and high-energy implanters, integration of AI in semiconductor manufacturing, and sustainable fabrication techniques.

Global Commercial Ion Implantation Systems Market, Emerging Trends, Technological Advancements, and Business Strategies 2026-2034

Get Sample Report PDF for Exclusive Insights

Report Sample Includes

  • Table of Contents
  • List of Tables & Figures
  • Charts, Research Methodology, and more...
PDF Icon Download Sample Report PDF

Download Sample Report

Table of Content

Table of Contents
1 Research Methodology and Statistical Scope
1.1 Market Definition and Statistical Scope of Commercial Ion Implantation Systems
1.2 Key Market Segments
1.2.1 Commercial Ion Implantation Systems Segment by Type
1.2.2 Commercial Ion Implantation Systems Segment by Application
1.3 Methodology & Sources of Information
1.3.1 Research Methodology
1.3.2 Research Process
1.3.3 Market Breakdown and Data Triangulation
1.3.4 Base Year
1.3.5 Report Assumptions & Caveats
2 Commercial Ion Implantation Systems Market Overview
2.1 Global Market Overview
2.1.1 Global Commercial Ion Implantation Systems Market Size (M USD) Estimates and Forecasts (2019-2032)
2.1.2 Global Commercial Ion Implantation Systems Sales Estimates and Forecasts (2019-2032)
2.2 Market Segment Executive Summary
2.3 Global Market Size by Region
3 Commercial Ion Implantation Systems Market Competitive Landscape
3.1 Global Commercial Ion Implantation Systems Sales by Manufacturers (2019-2025)
3.2 Global Commercial Ion Implantation Systems Revenue Market Share by Manufacturers (2019-2025)
3.3 Commercial Ion Implantation Systems Market Share by Company Type (Tier 1, Tier 2, and Tier 3)
3.4 Global Commercial Ion Implantation Systems Average Price by Manufacturers (2019-2025)
3.5 Manufacturers Commercial Ion Implantation Systems Sales Sites, Area Served, Product Type
3.6 Commercial Ion Implantation Systems Market Competitive Situation and Trends
3.6.1 Commercial Ion Implantation Systems Market Concentration Rate
3.6.2 Global 5 and 10 Largest Commercial Ion Implantation Systems Players Market Share by Revenue
3.6.3 Mergers & Acquisitions, Expansion
4 Commercial Ion Implantation Systems Industry Chain Analysis
4.1 Commercial Ion Implantation Systems Industry Chain Analysis
4.2 Market Overview of Key Raw Materials
4.3 Midstream Market Analysis
4.4 Downstream Customer Analysis
5 The Development and Dynamics of Commercial Ion Implantation Systems Market
5.1 Key Development Trends
5.2 Driving Factors
5.3 Market Challenges
5.4 Market Restraints
5.5 Industry News
5.5.1 New Product Developments
5.5.2 Mergers & Acquisitions
5.5.3 Expansions
5.5.4 Collaboration/Supply Contracts
5.6 Industry Policies
6 Commercial Ion Implantation Systems Market Segmentation by Type
6.1 Evaluation Matrix of Segment Market Development Potential (Type)
6.2 Global Commercial Ion Implantation Systems Sales Market Share by Type (2019-2025)
6.3 Global Commercial Ion Implantation Systems Market Size Market Share by Type (2019-2025)
6.4 Global Commercial Ion Implantation Systems Price by Type (2019-2025)
7 Commercial Ion Implantation Systems Market Segmentation by Application
7.1 Evaluation Matrix of Segment Market Development Potential (Application)
7.2 Global Commercial Ion Implantation Systems Market Sales by Application (2019-2025)
7.3 Global Commercial Ion Implantation Systems Market Size (M USD) by Application (2019-2025)
7.4 Global Commercial Ion Implantation Systems Sales Growth Rate by Application (2019-2025)
8 Commercial Ion Implantation Systems Market Consumption by Region
8.1 Global Commercial Ion Implantation Systems Sales by Region
8.1.1 Global Commercial Ion Implantation Systems Sales by Region
8.1.2 Global Commercial Ion Implantation Systems Sales Market Share by Region
8.2 North America
8.2.1 North America Commercial Ion Implantation Systems Sales by Country
8.2.2 U.S.
8.2.3 Canada
8.2.4 Mexico
8.3 Europe
8.3.1 Europe Commercial Ion Implantation Systems Sales by Country
8.3.2 Germany
8.3.3 France
8.3.4 U.K.
8.3.5 Italy
8.3.6 Russia
8.4 Asia Pacific
8.4.1 Asia Pacific Commercial Ion Implantation Systems Sales by Region
8.4.2 China
8.4.3 Japan
8.4.4 South Korea
8.4.5 India
8.4.6 Southeast Asia
8.5 South America
8.5.1 South America Commercial Ion Implantation Systems Sales by Country
8.5.2 Brazil
8.5.3 Argentina
8.5.4 Columbia
8.6 Middle East and Africa
8.6.1 Middle East and Africa Commercial Ion Implantation Systems Sales by Region
8.6.2 Saudi Arabia
8.6.3 UAE
8.6.4 Egypt
8.6.5 Nigeria
8.6.6 South Africa
9 Commercial Ion Implantation Systems Market Production by Region
9.1 Global Production of Commercial Ion Implantation Systems by Region (2019-2025)
9.2 Global Commercial Ion Implantation Systems Revenue Market Share by Region (2019-2025)
9.3 Global Commercial Ion Implantation Systems Production, Revenue, Price and Gross Margin (2019-2025)
9.4 North America Commercial Ion Implantation Systems Production
9.4.1 North America Commercial Ion Implantation Systems Production Growth Rate (2019-2025)
9.4.2 North America Commercial Ion Implantation Systems Production, Revenue, Price and Gross Margin (2019-2025)
9.5 Europe Commercial Ion Implantation Systems Production
9.5.1 Europe Commercial Ion Implantation Systems Production Growth Rate (2019-2025)
9.5.2 Europe Commercial Ion Implantation Systems Production, Revenue, Price and Gross Margin (2019-2025)
9.6 Japan Commercial Ion Implantation Systems Production (2019-2025)
9.6.1 Japan Commercial Ion Implantation Systems Production Growth Rate (2019-2025)
9.6.2 Japan Commercial Ion Implantation Systems Production, Revenue, Price and Gross Margin (2019-2025)
9.7 China Commercial Ion Implantation Systems Production (2019-2025)
9.7.1 China Commercial Ion Implantation Systems Production Growth Rate (2019-2025)
9.7.2 China Commercial Ion Implantation Systems Production, Revenue, Price and Gross Margin (2019-2025)
10 Key Companies Profile
10.1 AMAT (Applied Materials)
10.1.1 AMAT (Applied Materials) Commercial Ion Implantation Systems Basic Information
10.1.2 AMAT (Applied Materials) Commercial Ion Implantation Systems Product Overview
10.1.3 AMAT (Applied Materials) Commercial Ion Implantation Systems Product Market Performance
10.1.4 AMAT (Applied Materials) Business Overview
10.1.5 AMAT (Applied Materials) Commercial Ion Implantation Systems SWOT Analysis
10.1.6 AMAT (Applied Materials) Recent Developments
10.2 Axcelis Technologies
10.2.1 Axcelis Technologies Commercial Ion Implantation Systems Basic Information
10.2.2 Axcelis Technologies Commercial Ion Implantation Systems Product Overview
10.2.3 Axcelis Technologies Commercial Ion Implantation Systems Product Market Performance
10.2.4 Axcelis Technologies Business Overview
10.2.5 Axcelis Technologies Commercial Ion Implantation Systems SWOT Analysis
10.2.6 Axcelis Technologies Recent Developments
10.3 Sumitomo Heavy Industries
10.3.1 Sumitomo Heavy Industries Commercial Ion Implantation Systems Basic Information
10.3.2 Sumitomo Heavy Industries Commercial Ion Implantation Systems Product Overview
10.3.3 Sumitomo Heavy Industries Commercial Ion Implantation Systems Product Market Performance
10.3.4 Sumitomo Heavy Industries Commercial Ion Implantation Systems SWOT Analysis
10.3.5 Sumitomo Heavy Industries Business Overview
10.3.6 Sumitomo Heavy Industries Recent Developments
10.4 Nissin Ion Equipment
10.4.1 Nissin Ion Equipment Commercial Ion Implantation Systems Basic Information
10.4.2 Nissin Ion Equipment Commercial Ion Implantation Systems Product Overview
10.4.3 Nissin Ion Equipment Commercial Ion Implantation Systems Product Market Performance
10.4.4 Nissin Ion Equipment Business Overview
10.4.5 Nissin Ion Equipment Recent Developments
10.5 Advanced Ion Beam Technology (AIBT)
10.5.1 Advanced Ion Beam Technology (AIBT) Commercial Ion Implantation Systems Basic Information
10.5.2 Advanced Ion Beam Technology (AIBT) Commercial Ion Implantation Systems Product Overview
10.5.3 Advanced Ion Beam Technology (AIBT) Commercial Ion Implantation Systems Product Market Performance
10.5.4 Advanced Ion Beam Technology (AIBT) Business Overview
10.5.5 Advanced Ion Beam Technology (AIBT) Recent Developments
10.6 CETC Electronics Equipment
10.6.1 CETC Electronics Equipment Commercial Ion Implantation Systems Basic Information
10.6.2 CETC Electronics Equipment Commercial Ion Implantation Systems Product Overview
10.6.3 CETC Electronics Equipment Commercial Ion Implantation Systems Product Market Performance
10.6.4 CETC Electronics Equipment Business Overview
10.6.5 CETC Electronics Equipment Recent Developments
10.7 ULVAC Technologies
10.7.1 ULVAC Technologies Commercial Ion Implantation Systems Basic Information
10.7.2 ULVAC Technologies Commercial Ion Implantation Systems Product Overview
10.7.3 ULVAC Technologies Commercial Ion Implantation Systems Product Market Performance
10.7.4 ULVAC Technologies Business Overview
10.7.5 ULVAC Technologies Recent Developments
10.8 Kingstone Semiconductor
10.8.1 Kingstone Semiconductor Commercial Ion Implantation Systems Basic Information
10.8.2 Kingstone Semiconductor Commercial Ion Implantation Systems Product Overview
10.8.3 Kingstone Semiconductor Commercial Ion Implantation Systems Product Market Performance
10.8.4 Kingstone Semiconductor Business Overview
10.8.5 Kingstone Semiconductor Recent Developments
11 Commercial Ion Implantation Systems Market Forecast by Region
11.1 Global Commercial Ion Implantation Systems Market Size Forecast
11.2 Global Commercial Ion Implantation Systems Market Forecast by Region
11.2.1 North America Market Size Forecast by Country
11.2.2 Europe Commercial Ion Implantation Systems Market Size Forecast by Country
11.2.3 Asia Pacific Commercial Ion Implantation Systems Market Size Forecast by Region
11.2.4 South America Commercial Ion Implantation Systems Market Size Forecast by Country
11.2.5 Middle East and Africa Forecasted Consumption of Commercial Ion Implantation Systems by Country
12 Forecast Market by Type and by Application (2025-2032)
12.1 Global Commercial Ion Implantation Systems Market Forecast by Type (2025-2032)
12.1.1 Global Forecasted Sales of Commercial Ion Implantation Systems by Type (2025-2032)
12.1.2 Global Commercial Ion Implantation Systems Market Size Forecast by Type (2025-2032)
12.1.3 Global Forecasted Price of Commercial Ion Implantation Systems by Type (2025-2032)
12.2 Global Commercial Ion Implantation Systems Market Forecast by Application (2025-2032)
12.2.1 Global Commercial Ion Implantation Systems Sales (K Units) Forecast by Application
12.2.2 Global Commercial Ion Implantation Systems Market Size (M USD) Forecast by Application (2025-2032)
13 Conclusion and Key FindingsList of Tables
Table 1. Introduction of the Type
Table 2. Introduction of the Application
Table 3. Market Size (M USD) Segment Executive Summary
Table 4. Commercial Ion Implantation Systems Market Size Comparison by Region (M USD)
Table 5. Global Commercial Ion Implantation Systems Sales (K Units) by Manufacturers (2019-2025)
Table 6. Global Commercial Ion Implantation Systems Sales Market Share by Manufacturers (2019-2025)
Table 7. Global Commercial Ion Implantation Systems Revenue (M USD) by Manufacturers (2019-2025)
Table 8. Global Commercial Ion Implantation Systems Revenue Share by Manufacturers (2019-2025)
Table 9. Company Type (Tier 1, Tier 2, and Tier 3) & (based on the Revenue in Commercial Ion Implantation Systems as of 2022)
Table 10. Global Market Commercial Ion Implantation Systems Average Price (USD/Unit) of Key Manufacturers (2019-2025)
Table 11. Manufacturers Commercial Ion Implantation Systems Sales Sites and Area Served
Table 12. Manufacturers Commercial Ion Implantation Systems Product Type
Table 13. Global Commercial Ion Implantation Systems Manufacturers Market Concentration Ratio (CR5 and HHI)
Table 14. Mergers & Acquisitions, Expansion Plans
Table 15. Industry Chain Map of Commercial Ion Implantation Systems
Table 16. Market Overview of Key Raw Materials
Table 17. Midstream Market Analysis
Table 18. Downstream Customer Analysis
Table 19. Key Development Trends
Table 20. Driving Factors
Table 21. Commercial Ion Implantation Systems Market Challenges
Table 22. Global Commercial Ion Implantation Systems Sales by Type (K Units)
Table 23. Global Commercial Ion Implantation Systems Market Size by Type (M USD)
Table 24. Global Commercial Ion Implantation Systems Sales (K Units) by Type (2019-2025)
Table 25. Global Commercial Ion Implantation Systems Sales Market Share by Type (2019-2025)
Table 26. Global Commercial Ion Implantation Systems Market Size (M USD) by Type (2019-2025)
Table 27. Global Commercial Ion Implantation Systems Market Size Share by Type (2019-2025)
Table 28. Global Commercial Ion Implantation Systems Price (USD/Unit) by Type (2019-2025)
Table 29. Global Commercial Ion Implantation Systems Sales (K Units) by Application
Table 30. Global Commercial Ion Implantation Systems Market Size by Application
Table 31. Global Commercial Ion Implantation Systems Sales by Application (2019-2025) & (K Units)
Table 32. Global Commercial Ion Implantation Systems Sales Market Share by Application (2019-2025)
Table 33. Global Commercial Ion Implantation Systems Sales by Application (2019-2025) & (M USD)
Table 34. Global Commercial Ion Implantation Systems Market Share by Application (2019-2025)
Table 35. Global Commercial Ion Implantation Systems Sales Growth Rate by Application (2019-2025)
Table 36. Global Commercial Ion Implantation Systems Sales by Region (2019-2025) & (K Units)
Table 37. Global Commercial Ion Implantation Systems Sales Market Share by Region (2019-2025)
Table 38. North America Commercial Ion Implantation Systems Sales by Country (2019-2025) & (K Units)
Table 39. Europe Commercial Ion Implantation Systems Sales by Country (2019-2025) & (K Units)
Table 40. Asia Pacific Commercial Ion Implantation Systems Sales by Region (2019-2025) & (K Units)
Table 41. South America Commercial Ion Implantation Systems Sales by Country (2019-2025) & (K Units)
Table 42. Middle East and Africa Commercial Ion Implantation Systems Sales by Region (2019-2025) & (K Units)
Table 43. Global Commercial Ion Implantation Systems Production (K Units) by Region (2019-2025)
Table 44. Global Commercial Ion Implantation Systems Revenue (US$ Million) by Region (2019-2025)
Table 45. Global Commercial Ion Implantation Systems Revenue Market Share by Region (2019-2025)
Table 46. Global Commercial Ion Implantation Systems Production (K Units), Revenue (US$ Million), Price (USD/Unit) and Gross Margin (2019-2025)
Table 47. North America Commercial Ion Implantation Systems Production (K Units), Revenue (US$ Million), Price (USD/Unit) and Gross Margin (2019-2025)
Table 48. Europe Commercial Ion Implantation Systems Production (K Units), Revenue (US$ Million), Price (USD/Unit) and Gross Margin (2019-2025)
Table 49. Japan Commercial Ion Implantation Systems Production (K Units), Revenue (US$ Million), Price (USD/Unit) and Gross Margin (2019-2025)
Table 50. China Commercial Ion Implantation Systems Production (K Units), Revenue (US$ Million), Price (USD/Unit) and Gross Margin (2019-2025)
Table 51. AMAT (Applied Materials) Commercial Ion Implantation Systems Basic Information
Table 52. AMAT (Applied Materials) Commercial Ion Implantation Systems Product Overview
Table 53. AMAT (Applied Materials) Commercial Ion Implantation Systems Sales (K Units), Revenue (M USD), Price (USD/Unit) and Gross Margin (2019-2025)
Table 54. AMAT (Applied Materials) Business Overview
Table 55. AMAT (Applied Materials) Commercial Ion Implantation Systems SWOT Analysis
Table 56. AMAT (Applied Materials) Recent Developments
Table 57. Axcelis Technologies Commercial Ion Implantation Systems Basic Information
Table 58. Axcelis Technologies Commercial Ion Implantation Systems Product Overview
Table 59. Axcelis Technologies Commercial Ion Implantation Systems Sales (K Units), Revenue (M USD), Price (USD/Unit) and Gross Margin (2019-2025)
Table 60. Axcelis Technologies Business Overview
Table 61. Axcelis Technologies Commercial Ion Implantation Systems SWOT Analysis
Table 62. Axcelis Technologies Recent Developments
Table 63. Sumitomo Heavy Industries Commercial Ion Implantation Systems Basic Information
Table 64. Sumitomo Heavy Industries Commercial Ion Implantation Systems Product Overview
Table 65. Sumitomo Heavy Industries Commercial Ion Implantation Systems Sales (K Units), Revenue (M USD), Price (USD/Unit) and Gross Margin (2019-2025)
Table 66. Sumitomo Heavy Industries Commercial Ion Implantation Systems SWOT Analysis
Table 67. Sumitomo Heavy Industries Business Overview
Table 68. Sumitomo Heavy Industries Recent Developments
Table 69. Nissin Ion Equipment Commercial Ion Implantation Systems Basic Information
Table 70. Nissin Ion Equipment Commercial Ion Implantation Systems Product Overview
Table 71. Nissin Ion Equipment Commercial Ion Implantation Systems Sales (K Units), Revenue (M USD), Price (USD/Unit) and Gross Margin (2019-2025)
Table 72. Nissin Ion Equipment Business Overview
Table 73. Nissin Ion Equipment Recent Developments
Table 74. Advanced Ion Beam Technology (AIBT) Commercial Ion Implantation Systems Basic Information
Table 75. Advanced Ion Beam Technology (AIBT) Commercial Ion Implantation Systems Product Overview
Table 76. Advanced Ion Beam Technology (AIBT) Commercial Ion Implantation Systems Sales (K Units), Revenue (M USD), Price (USD/Unit) and Gross Margin (2019-2025)
Table 77. Advanced Ion Beam Technology (AIBT) Business Overview
Table 78. Advanced Ion Beam Technology (AIBT) Recent Developments
Table 79. CETC Electronics Equipment Commercial Ion Implantation Systems Basic Information
Table 80. CETC Electronics Equipment Commercial Ion Implantation Systems Product Overview
Table 81. CETC Electronics Equipment Commercial Ion Implantation Systems Sales (K Units), Revenue (M USD), Price (USD/Unit) and Gross Margin (2019-2025)
Table 82. CETC Electronics Equipment Business Overview
Table 83. CETC Electronics Equipment Recent Developments
Table 84. ULVAC Technologies Commercial Ion Implantation Systems Basic Information
Table 85. ULVAC Technologies Commercial Ion Implantation Systems Product Overview
Table 86. ULVAC Technologies Commercial Ion Implantation Systems Sales (K Units), Revenue (M USD), Price (USD/Unit) and Gross Margin (2019-2025)
Table 87. ULVAC Technologies Business Overview
Table 88. ULVAC Technologies Recent Developments
Table 89. Kingstone Semiconductor Commercial Ion Implantation Systems Basic Information
Table 90. Kingstone Semiconductor Commercial Ion Implantation Systems Product Overview
Table 91. Kingstone Semiconductor Commercial Ion Implantation Systems Sales (K Units), Revenue (M USD), Price (USD/Unit) and Gross Margin (2019-2025)
Table 92. Kingstone Semiconductor Business Overview
Table 93. Kingstone Semiconductor Recent Developments
Table 94. Global Commercial Ion Implantation Systems Sales Forecast by Region (2025-2032) & (K Units)
Table 95. Global Commercial Ion Implantation Systems Market Size Forecast by Region (2025-2032) & (M USD)
Table 96. North America Commercial Ion Implantation Systems Sales Forecast by Country (2025-2032) & (K Units)
Table 97. North America Commercial Ion Implantation Systems Market Size Forecast by Country (2025-2032) & (M USD)
Table 98. Europe Commercial Ion Implantation Systems Sales Forecast by Country (2025-2032) & (K Units)
Table 99. Europe Commercial Ion Implantation Systems Market Size Forecast by Country (2025-2032) & (M USD)
Table 100. Asia Pacific Commercial Ion Implantation Systems Sales Forecast by Region (2025-2032) & (K Units)
Table 101. Asia Pacific Commercial Ion Implantation Systems Market Size Forecast by Region (2025-2032) & (M USD)
Table 102. South America Commercial Ion Implantation Systems Sales Forecast by Country (2025-2032) & (K Units)
Table 103. South America Commercial Ion Implantation Systems Market Size Forecast by Country (2025-2032) & (M USD)
Table 104. Middle East and Africa Commercial Ion Implantation Systems Consumption Forecast by Country (2025-2032) & (Units)
Table 105. Middle East and Africa Commercial Ion Implantation Systems Market Size Forecast by Country (2025-2032) & (M USD)
Table 106. Global Commercial Ion Implantation Systems Sales Forecast by Type (2025-2032) & (K Units)
Table 107. Global Commercial Ion Implantation Systems Market Size Forecast by Type (2025-2032) & (M USD)
Table 108. Global Commercial Ion Implantation Systems Price Forecast by Type (2025-2032) & (USD/Unit)
Table 109. Global Commercial Ion Implantation Systems Sales (K Units) Forecast by Application (2025-2032)
Table 110. Global Commercial Ion Implantation Systems Market Size Forecast by Application (2025-2032) & (M USD)
List of Figures
Figure 1. Product Picture of Commercial Ion Implantation Systems
Figure 2. Data Triangulation
Figure 3. Key Caveats
Figure 4. Global Commercial Ion Implantation Systems Market Size (M USD), 2019-2032
Figure 5. Global Commercial Ion Implantation Systems Market Size (M USD) (2019-2032)
Figure 6. Global Commercial Ion Implantation Systems Sales (K Units) & (2019-2032)
Figure 7. Evaluation Matrix of Segment Market Development Potential (Type)
Figure 8. Evaluation Matrix of Segment Market Development Potential (Application)
Figure 9. Evaluation Matrix of Regional Market Development Potential
Figure 10. Commercial Ion Implantation Systems Market Size by Country (M USD)
Figure 11. Commercial Ion Implantation Systems Sales Share by Manufacturers in 2023
Figure 12. Global Commercial Ion Implantation Systems Revenue Share by Manufacturers in 2023
Figure 13. Commercial Ion Implantation Systems Market Share by Company Type (Tier 1, Tier 2 and Tier 3): 2023
Figure 14. Global Market Commercial Ion Implantation Systems Average Price (USD/Unit) of Key Manufacturers in 2023
Figure 15. The Global 5 and 10 Largest Players: Market Share by Commercial Ion Implantation Systems Revenue in 2023
Figure 16. Evaluation Matrix of Segment Market Development Potential (Type)
Figure 17. Global Commercial Ion Implantation Systems Market Share by Type
Figure 18. Sales Market Share of Commercial Ion Implantation Systems by Type (2019-2025)
Figure 19. Sales Market Share of Commercial Ion Implantation Systems by Type in 2023
Figure 20. Market Size Share of Commercial Ion Implantation Systems by Type (2019-2025)
Figure 21. Market Size Market Share of Commercial Ion Implantation Systems by Type in 2023
Figure 22. Evaluation Matrix of Segment Market Development Potential (Application)
Figure 23. Global Commercial Ion Implantation Systems Market Share by Application
Figure 24. Global Commercial Ion Implantation Systems Sales Market Share by Application (2019-2025)
Figure 25. Global Commercial Ion Implantation Systems Sales Market Share by Application in 2023
Figure 26. Global Commercial Ion Implantation Systems Market Share by Application (2019-2025)
Figure 27. Global Commercial Ion Implantation Systems Market Share by Application in 2023
Figure 28. Global Commercial Ion Implantation Systems Sales Growth Rate by Application (2019-2025)
Figure 29. Global Commercial Ion Implantation Systems Sales Market Share by Region (2019-2025)
Figure 30. North America Commercial Ion Implantation Systems Sales and Growth Rate (2019-2025) & (K Units)
Figure 31. North America Commercial Ion Implantation Systems Sales Market Share by Country in 2023
Figure 32. U.S. Commercial Ion Implantation Systems Sales and Growth Rate (2019-2025) & (K Units)
Figure 33. Canada Commercial Ion Implantation Systems Sales (K Units) and Growth Rate (2019-2025)
Figure 34. Mexico Commercial Ion Implantation Systems Sales (Units) and Growth Rate (2019-2025)
Figure 35. Europe Commercial Ion Implantation Systems Sales and Growth Rate (2019-2025) & (K Units)
Figure 36. Europe Commercial Ion Implantation Systems Sales Market Share by Country in 2023
Figure 37. Germany Commercial Ion Implantation Systems Sales and Growth Rate (2019-2025) & (K Units)
Figure 38. France Commercial Ion Implantation Systems Sales and Growth Rate (2019-2025) & (K Units)
Figure 39. U.K. Commercial Ion Implantation Systems Sales and Growth Rate (2019-2025) & (K Units)
Figure 40. Italy Commercial Ion Implantation Systems Sales and Growth Rate (2019-2025) & (K Units)
Figure 41. Russia Commercial Ion Implantation Systems Sales and Growth Rate (2019-2025) & (K Units)
Figure 42. Asia Pacific Commercial Ion Implantation Systems Sales and Growth Rate (K Units)
Figure 43. Asia Pacific Commercial Ion Implantation Systems Sales Market Share by Region in 2023
Figure 44. China Commercial Ion Implantation Systems Sales and Growth Rate (2019-2025) & (K Units)
Figure 45. Japan Commercial Ion Implantation Systems Sales and Growth Rate (2019-2025) & (K Units)
Figure 46. South Korea Commercial Ion Implantation Systems Sales and Growth Rate (2019-2025) & (K Units)
Figure 47. India Commercial Ion Implantation Systems Sales and Growth Rate (2019-2025) & (K Units)
Figure 48. Southeast Asia Commercial Ion Implantation Systems Sales and Growth Rate (2019-2025) & (K Units)
Figure 49. South America Commercial Ion Implantation Systems Sales and Growth Rate (K Units)
Figure 50. South America Commercial Ion Implantation Systems Sales Market Share by Country in 2023
Figure 51. Brazil Commercial Ion Implantation Systems Sales and Growth Rate (2019-2025) & (K Units)
Figure 52. Argentina Commercial Ion Implantation Systems Sales and Growth Rate (2019-2025) & (K Units)
Figure 53. Columbia Commercial Ion Implantation Systems Sales and Growth Rate (2019-2025) & (K Units)
Figure 54. Middle East and Africa Commercial Ion Implantation Systems Sales and Growth Rate (K Units)
Figure 55. Middle East and Africa Commercial Ion Implantation Systems Sales Market Share by Region in 2023
Figure 56. Saudi Arabia Commercial Ion Implantation Systems Sales and Growth Rate (2019-2025) & (K Units)
Figure 57. UAE Commercial Ion Implantation Systems Sales and Growth Rate (2019-2025) & (K Units)
Figure 58. Egypt Commercial Ion Implantation Systems Sales and Growth Rate (2019-2025) & (K Units)
Figure 59. Nigeria Commercial Ion Implantation Systems Sales and Growth Rate (2019-2025) & (K Units)
Figure 60. South Africa Commercial Ion Implantation Systems Sales and Growth Rate (2019-2025) & (K Units)
Figure 61. Global Commercial Ion Implantation Systems Production Market Share by Region (2019-2025)
Figure 62. North America Commercial Ion Implantation Systems Production (K Units) Growth Rate (2019-2025)
Figure 63. Europe Commercial Ion Implantation Systems Production (K Units) Growth Rate (2019-2025)
Figure 64. Japan Commercial Ion Implantation Systems Production (K Units) Growth Rate (2019-2025)
Figure 65. China Commercial Ion Implantation Systems Production (K Units) Growth Rate (2019-2025)
Figure 66. Global Commercial Ion Implantation Systems Sales Forecast by Volume (2019-2032) & (K Units)
Figure 67. Global Commercial Ion Implantation Systems Market Size Forecast by Value (2019-2032) & (M USD)
Figure 68. Global Commercial Ion Implantation Systems Sales Market Share Forecast by Type (2025-2032)
Figure 69. Global Commercial Ion Implantation Systems Market Share Forecast by Type (2025-2032)
Figure 70. Global Commercial Ion Implantation Systems Sales Forecast by Application (2025-2032)
Figure 71. Global Commercial Ion Implantation Systems Market Share Forecast by Application (2025-2032)